Map
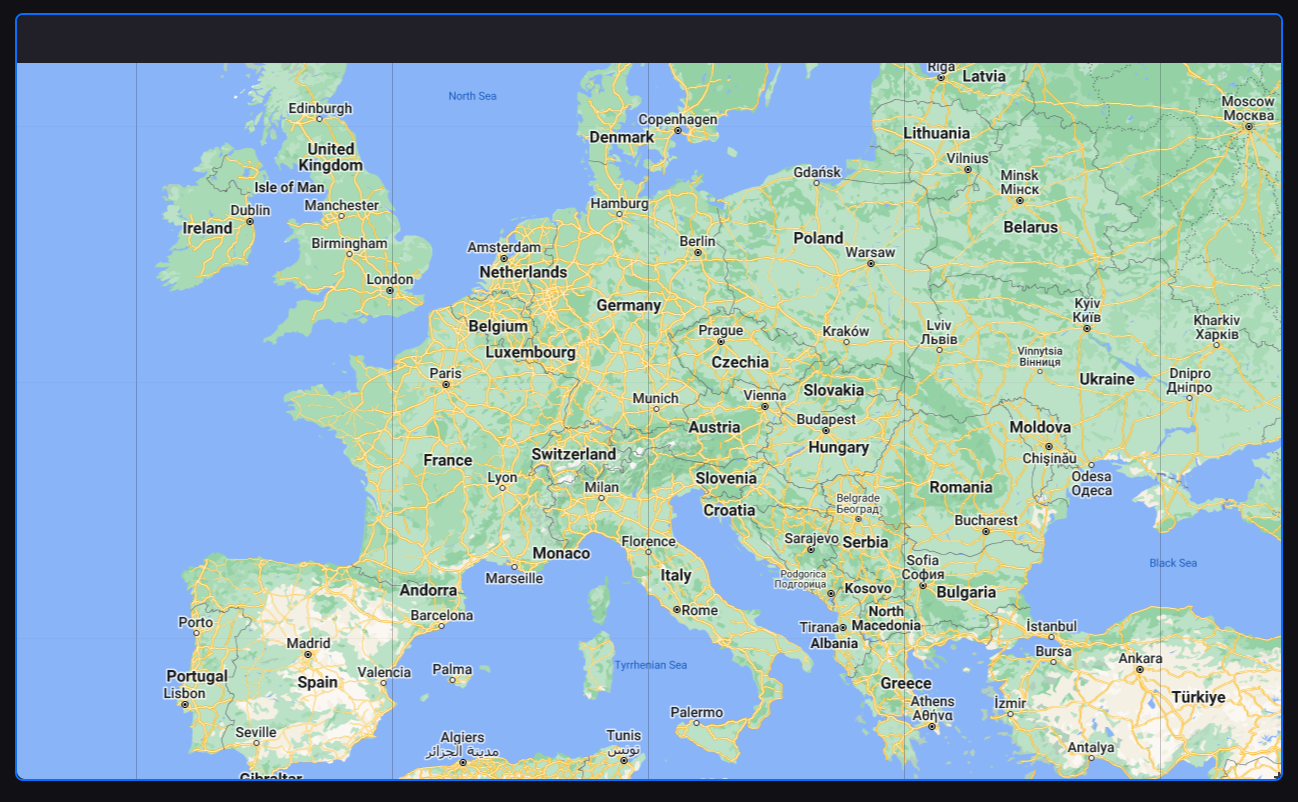
The map widget provides visual analysis based on geographic location, using longitude and latitude data to analyze and view data across regions. A global filter can be configured on the map widget to filter the data shown.
This topic describes the configuration items specific to the map. For common items such as the title, the widget (background, rounded corners, padding, and so on), filters, refresh frequency, and exporting widget data, see Common Configurations for Charts.
Data Fields
Field |
Count |
|---|---|
Dimension |
0 to 2 |
Measurement |
Unlimited |
Chart Style
Map Configurations
Basic Configurations
The basic behavior of the map, which controls its initial viewpoint and interaction.
Center
Sets the center of the view when the map first loads. With Auto Calculate selected, the system derives the center coordinates from the data points; once cleared, you can enter a Lng and a Lat manually to fix the center.
Zoom Level
Sets the zoom level at which the map is first shown, from 1 to 18. The larger the value, the finer the map.
Enable Drag
Controls whether users can pan the map view by dragging with the mouse. When off, the map stays at its initial viewpoint and cannot be dragged.
Enable Zoom
Controls whether users can zoom the map with the scroll wheel or a gesture. When off, the map is locked at its initial zoom level.
Enable Interactive Layers
Controls whether users can interact with the data layers on the map (markers, bubbles, and so on), for example by clicking and hovering. When off, the data layers are display only and do not respond to the mouse.
Show View Toolbar
Controls whether the zoom control icons (+/-) are shown on the map. Once hidden, users can still zoom with the scroll wheel but no clickable zoom buttons appear.
Interaction Settings
Configures an external jump link for the map, whose entry appears when a user hovers over the map.
Name
Specifies the text shown on the jump link button. Supports multiple languages.
URL
Enter the target URL to navigate to when the jump button is selected.
Interactive Layer Configurations
Adds, configures, and orders layers. Each layer controls one kind of map content independently, and several layers are stacked.
When creating a new layer, enter a Layer Name and select a Layer Type. The available layer types are:
map: The base layer, which determines the visual base of the map.
poi: The marker layer, which places icons on the map by longitude and latitude.
bubble: The bubble layer, which expresses values through bubble size and color.
geojson: The region layer, which renders values onto administrative region areas.
Hierarchy (Beta): The hierarchical region layer, which supports drilling down through administrative divisions level by level.
Note
Layer type names are shown in English in the interface and are not localized. Hierarchy (Beta) is still in beta. A map layer is always rendered below all other layers and is not affected by drag ordering in the list; drag ordering only changes the stacking order among non-map layers.
Map (map)
The map layer is the base map configuration and determines the visual base of the map.
Map Source
Select the data source of the base map. The options are determined by the map configuration of the platform, so the sources available may differ between environments; Offline Map is always offered at the end of the list.
Once Offline Map is selected, Map Type is hidden and Offline URL is shown instead.
Map Type
Select the display style of the base map: Normal, Satellite, Hybrid, or Terrain. Shown only when Map Source is not Offline Map.
Offline URL
Shown only when Map Source is Offline Map. Enter the address of the offline tile service.
Marker (POI)
The marker layer places icons on the map by longitude and latitude coordinates, which suits showing the positions of discrete geographic entities such as assets and sites.
Longitude
Select the data field in the dataset that holds the longitude coordinate of each data point.
Latitude
Select the data field in the dataset that holds the latitude coordinate of each data point.
Asset Name
Select the data field that holds the name or identifier of a data point, which is shown as the label of the marker.
Show Coordinates
Controls whether the longitude and latitude of a point are shown in the bubble when the mouse hovers over it.
Aggregation
When on, data points that are too close together at the current zoom level are merged into an aggregation icon showing their count.
Data Field
Select the data field used to distinguish aggregation granularity. The system uses it to decide which points belong to the same aggregation group.
Icon Configurations
Configures a different icon style per data point. Each icon rule contains:
Value: The identifier value of a data point. When the corresponding field of a data point matches this value, the rule applies.
Icon Style: Upload a custom icon image. The JPEG, PNG, GIF, and SVG formats are supported.
Select Icon: Select a preset icon from the built-in icon library.
Icon Color: Specify the color of the selected icon.
Highlight Color: Specify the color shown when the mouse hovers over the icon.
Note
Icon Style is mutually exclusive with the last three items: once an image is uploaded, Select Icon, Icon Color, and Highlight Color are hidden automatically, and they reappear once the image is cleared. A rule with no Value entered acts as a fallback and applies to every unmatched data point.
POI Icon Size
Sets the Height and Width of the icon separately, in pixels. The defaults are a height of 40 and a width of 25.
Enable Widget Link
When on, selecting a marker on the map can trigger data filtering or an update in other widgets on the same page.
Bubble (bubble)
The bubble layer shows values on the map as circular bubbles, whose size and color reflect the magnitude of the data. It suits showing geographic distribution density or comparing values.
Longitude
Select the data field in the dataset that holds the longitude coordinate of each data point.
Latitude
Select the data field in the dataset that holds the latitude coordinate of each data point.
Bubble Source
Select the numeric data field that determines bubble size: the larger the value, the larger the bubble.
Bubble Size
Sets the minimum and maximum display size of the bubbles in pixels, mapping the minimum and maximum of the data into that range.
Color Mapping
Configures how bubble color maps to data value. You can specify the minimum and maximum manually, or select Auto to let the system use the minimum and maximum in the dataset as the ends of the scale. Selecting Reverse reverses the direction of the color scheme.
Color Pattern
Select one of the preset color themes as the gradient scheme for bubble color mapping.
Geojson
The Geojson layer renders numeric data onto administrative region areas, showing regional differences by fill color, which suits comparing distribution across regions.
Region
Select the administrative region range to show. Options include the presets China, Singapore, and World, or Custom. Selecting Custom shows a file upload entry, where you upload a map file in GeoJSON format (.json).
Region Code Field
Select the data field in the dataset that holds the region code key, which the system uses to match data rows with map regions.
Data Value Field
Select the data field that holds the value to show per region, which determines the depth of the region color.
Enable Zoom On Click
When on, selecting a region zooms the map in and focuses on that region.
Zoom Level
Sets the target zoom level after a region is selected, from 1 to 18.
Color Mapping
Configures how region fill color maps to data value. You can specify the minimum and maximum of the scale manually; selecting Auto uses the actual maximum and minimum of the dataset as the bounds, and selecting Reverse reverses the color direction.
Color Pattern
Select one of the preset color themes as the gradient scheme for the region fill.
Highlight Color
Specify the highlight color of a region when the mouse hovers over it.
Outline
Configures the style of the region boundary lines, including width and color, which distinguishes adjacent regions.
Font
Sets the font style of the region name labels, including the font, font size, and color.
Enable Widget Link
When on, selecting a region on the map can trigger data filtering or an update in other widgets on the same page.
Hierarchy
The hierarchy layer presents administrative regions with level-by-level drill-down: users select a region to expand its sub-regions, which suits viewing geographic data from macro to micro level.
Geojson URL
Enter the address of the service that provides the GeoJSON data. The default is https://geo.datav.aliyun.com/areas_v3/bound/{adcode}_full.json, where {adcode} is replaced automatically with the code of the administrative region currently shown.
Linking Parameter
Enter the name of the page parameter that maps to the administrative region code (Adcode) of the current layer. Once configured, the layer listens for changes to that page parameter and switches the region shown accordingly. For more information, see Configuring Page Parameters.
Default Adcode
Sets the administrative region code shown when the map first loads. For example, entering 310000 shows the map of Shanghai by default.
Region Code Field
Select the data field in the dataset that holds the administrative region code, which the system uses to match data with map regions.
Data Value Field
Select the numeric data field to show per region. The value is rendered as the depth of the region color and can also appear in the label.
Display Name and Data
Controls whether the region name and its value label are shown directly on each region.
Display Name and Data on Hover
Controls whether the name and value of a region are shown in a bubble when the mouse hovers over it.
Decimal Places
Rounds the value shown on a region to the specified number of decimal places, with a default of 2.
Color Mapping
Configures how region fill color maps to data value. You can specify the bounds of the scale manually; selecting Auto uses the actual range of the dataset as the bounds, and selecting Reverse reverses the color direction.
Color Pattern
Select one of the preset color themes as the gradient scheme for the region fill.
Highlight Color
Specify the highlight color of a region when the mouse hovers over it.
Outline
Configures the style of the region boundary lines, including width and color.
Font
Specifies the font style of the region name and data labels.
Enable Widget Link
When on, selecting a map region can trigger data filtering or an update in other widgets on the same page.
Data Value Unit
Sets the unit text of the data value field. It only takes effect when Display Legends is on, and the unit appears in the legend annotation.
Display Legends
When on, a legend explaining the mapping between colors and values is shown at the side of the map.
Data on Hover
Configures the additional data fields shown in the bubble when the mouse hovers over a region. Each field can have its own data field, unit, and decimal places.
Interactions at Runtime
The map behaves as follows at runtime:
Panning: Requires Enable Drag to be on. Drag the canvas to pan the view.
Zooming: Requires Enable Zoom to be on. You can zoom with the scroll wheel, a double click, or a touch gesture, up to a maximum zoom level of 18. Once Show View Toolbar is on, reset, zoom in, and zoom out buttons also appear on the map; reset returns to the initial view given by Center and Zoom Level, or re-fits to the current data points if Center has Auto Calculate selected.
Hover bubble: Requires Enable Interactive Layers to be on. Hovering over a marker or a region opens a bubble. The bubble content of a marker layer depends on whether that layer has a name field and coordinate display configured; the bubble of a hierarchy layer is additionally controlled by the hover switch of that layer, and its content is the region name and the fields configured in Data on Hover.
Click linkage: Requires Enable Interactive Layers to be on, linkage to be enabled in the corresponding interactive layer, and linkage to be configured on the Filter tab. Selecting a marker or a region triggers linkage, and the marker acting as the linkage value is shown with an enlarged icon. For the configuration method, see Link Other Widgets.
Click to focus a region: Once zoom on click is enabled in a Geojson layer, selecting a region zooms to the zoom level specified for that layer.
External jump: Once a link is entered in Interaction Settings, a jump entry appears on the map and selecting it opens that address in a new window.
Note
The visibility of interactive layers can only be configured on the Style tab; end users cannot switch layers themselves at runtime. Hover information on the map is always a bubble, and no persistent info window is provided after a click.