Visualizing TSDB Data
Overview
EnOS Digital Twin Visualization (DTV) is a model-based low-code application development tool that provides rich widgets and flexible configuration capabilities, empowering citizen developers to quickly build visualization applications and greatly improve development efficiency. DTV supports the configuration of visualization pages using data from EnOS Time Series Database (TSDB). TSDB provides efficient and stable storage and management for real-time data uploaded by devices, data processed through stream processing, and time series data integrated through offline channels.
Taking building visualization application pages as an example, this page explains how to visualize asset point data stored in TSDB through DTV. The products involved are shown in the table below:
Product Name |
Mandatory/Optional |
Dependent Function Description |
|---|---|---|
EnOS Device Connectivity & Management (DCM) |
Mandatory |
To connect the required assets |
TSDB |
Mandatory |
To store time series data |
EnOS Application Portal |
Optional |
To host DTV |
Scenario
This page guides you to quickly build a demo page that visually displays real-time air quality data uploaded by an air device sensor, including real-time indoor temperature, humidity, and other air-related metrics.
Sample Visualization Page Based on the TSDB Data:
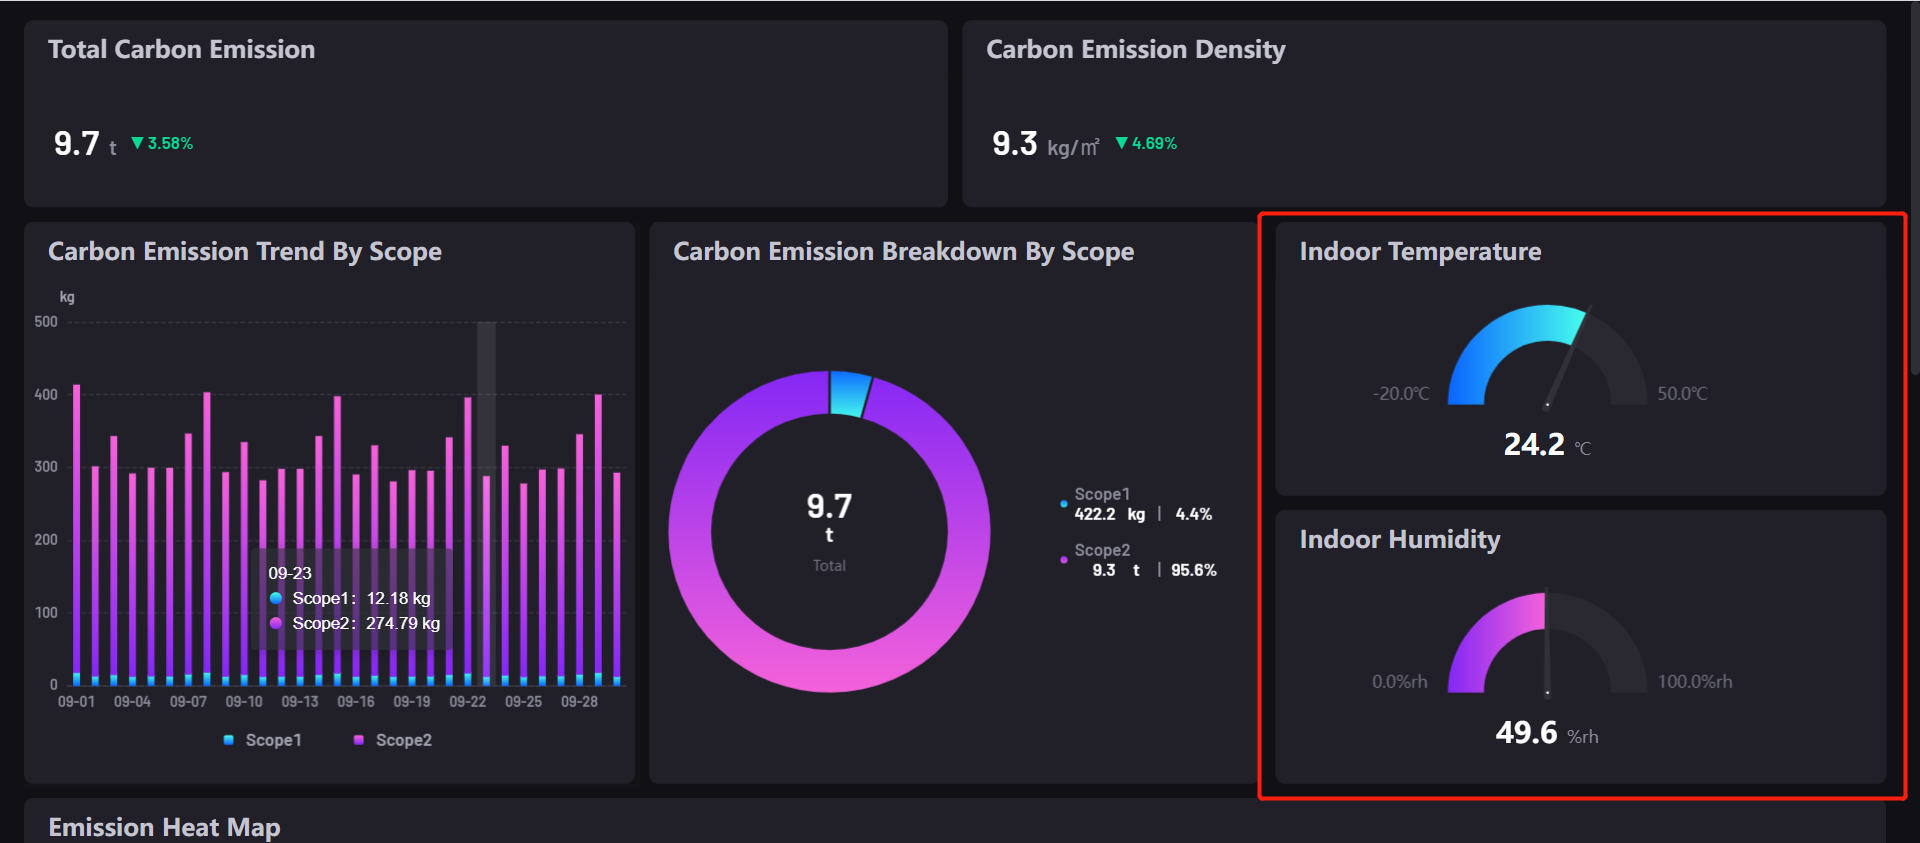
Widget List:
Widget |
Style |
Data Source |
Description |
|---|---|---|---|
Indoor Temperature |
Meter Gauge |
LatestData |
Display real-time indoor temperature |
Indoor Humidity |
Meter Gauge |
LatestData |
Display real-time indoor humidity |
For more information, see Meter Gauge.
Data Source List
Data Source |
Data Source Type |
Description |
|---|---|---|
Latest Data |
TSDB |
Obtain the latest uploaded data from TSDB. |
For more information about TSDB data source, see Preparing TSDB Data Source.
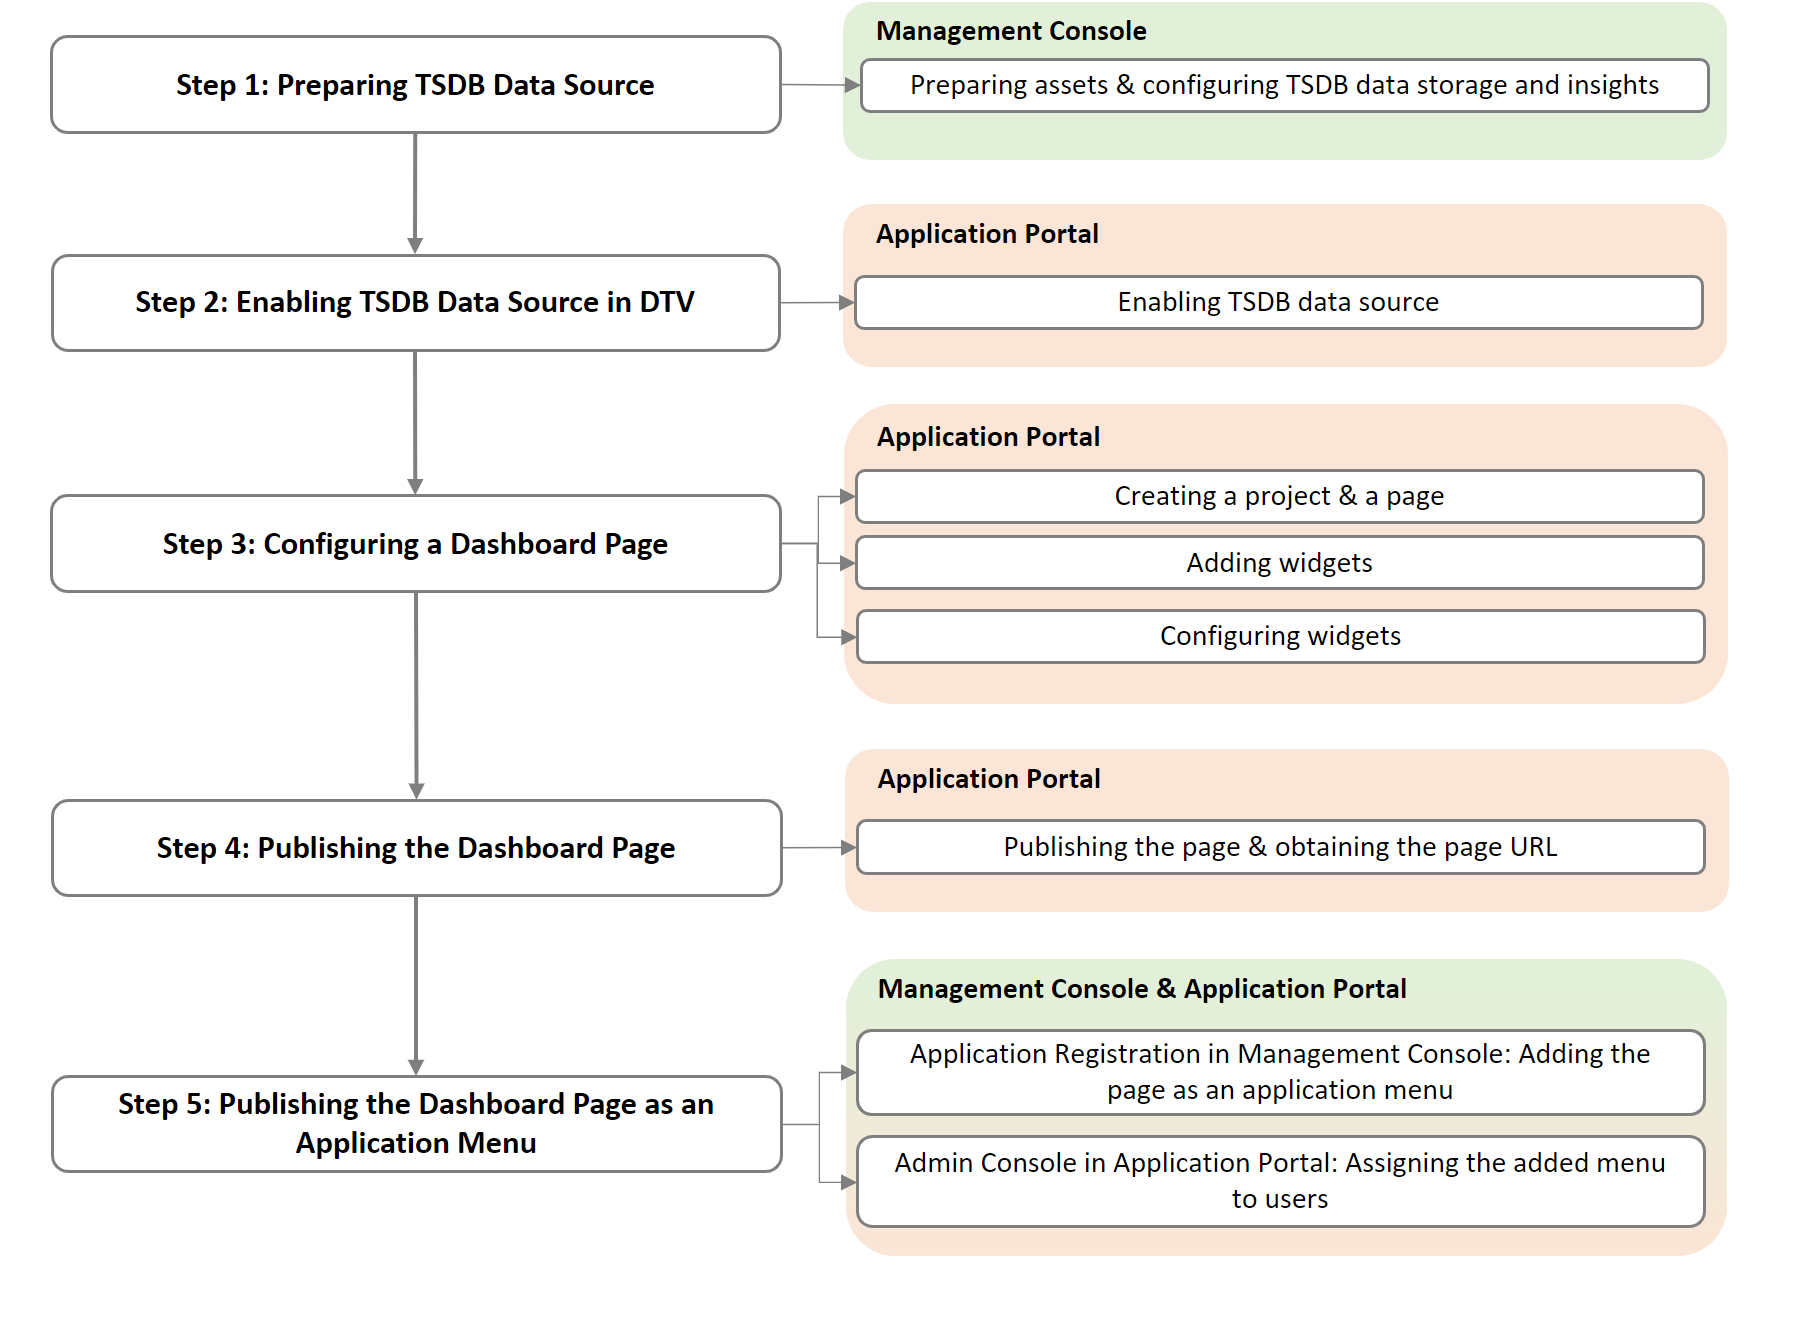
Workflow
Prerequisites
Before you start, make sure of the following items:
The required assets are connected to DCM and you have access to the assets in Application Portal.
You have admin permissions in Application Portal > Developer Console (contact the system admin for permissions) and you have access to the following menus in Application Portal > Developer Console:
Menu | Mandatory/Optional | Description |———————————————– | —————— | ————————————————– |Device Management > Device Assets | Mandatory | Check if the required assets are connected to DCM. |Data > Data Insights | Mandatory | Check if the TSDB data is usable in DTV. |To obtain access to the above menus, contact the OU administrator.
You have access to the following EnOS Industry Application Common Building Blocks (CBB):
CBB | Mandatory/Optional | Description |— | —————— | ———————————————– |DTV | Mandatory | Create visualization pages using the TSDB data. |To obtain access to the above CBB, contact the OU administrator.
Design Mode
This section describes how to configure dashboard pages in DTV to visualize the TSDB data.
Step 1: Preparing the TSDB Data Source
In this scenario, all the required devices are connected through DCM, and the corresponding data is stored in TSDB and can be used in DTV to configure the visualization pages. Here, as real-time indoor air quality data needs to be visualized on the DTV page, the LatestData data source needs to be prepared to obtain the latest uploaded time series data. Check the required devices and data with the following steps:
Go to Device Management > Device Assets in Application Portal > Developer Console, and check the following items:
Asset ID: ID of the required device, which is the ID of the sensor for obtaining real-time air quality data, e.g., 9PC9LNpk. When configuring data for the corresponding widget later, you will need this ID to specify the device.

Device Name: Name of the required device, e.g., IAQ_1_1.
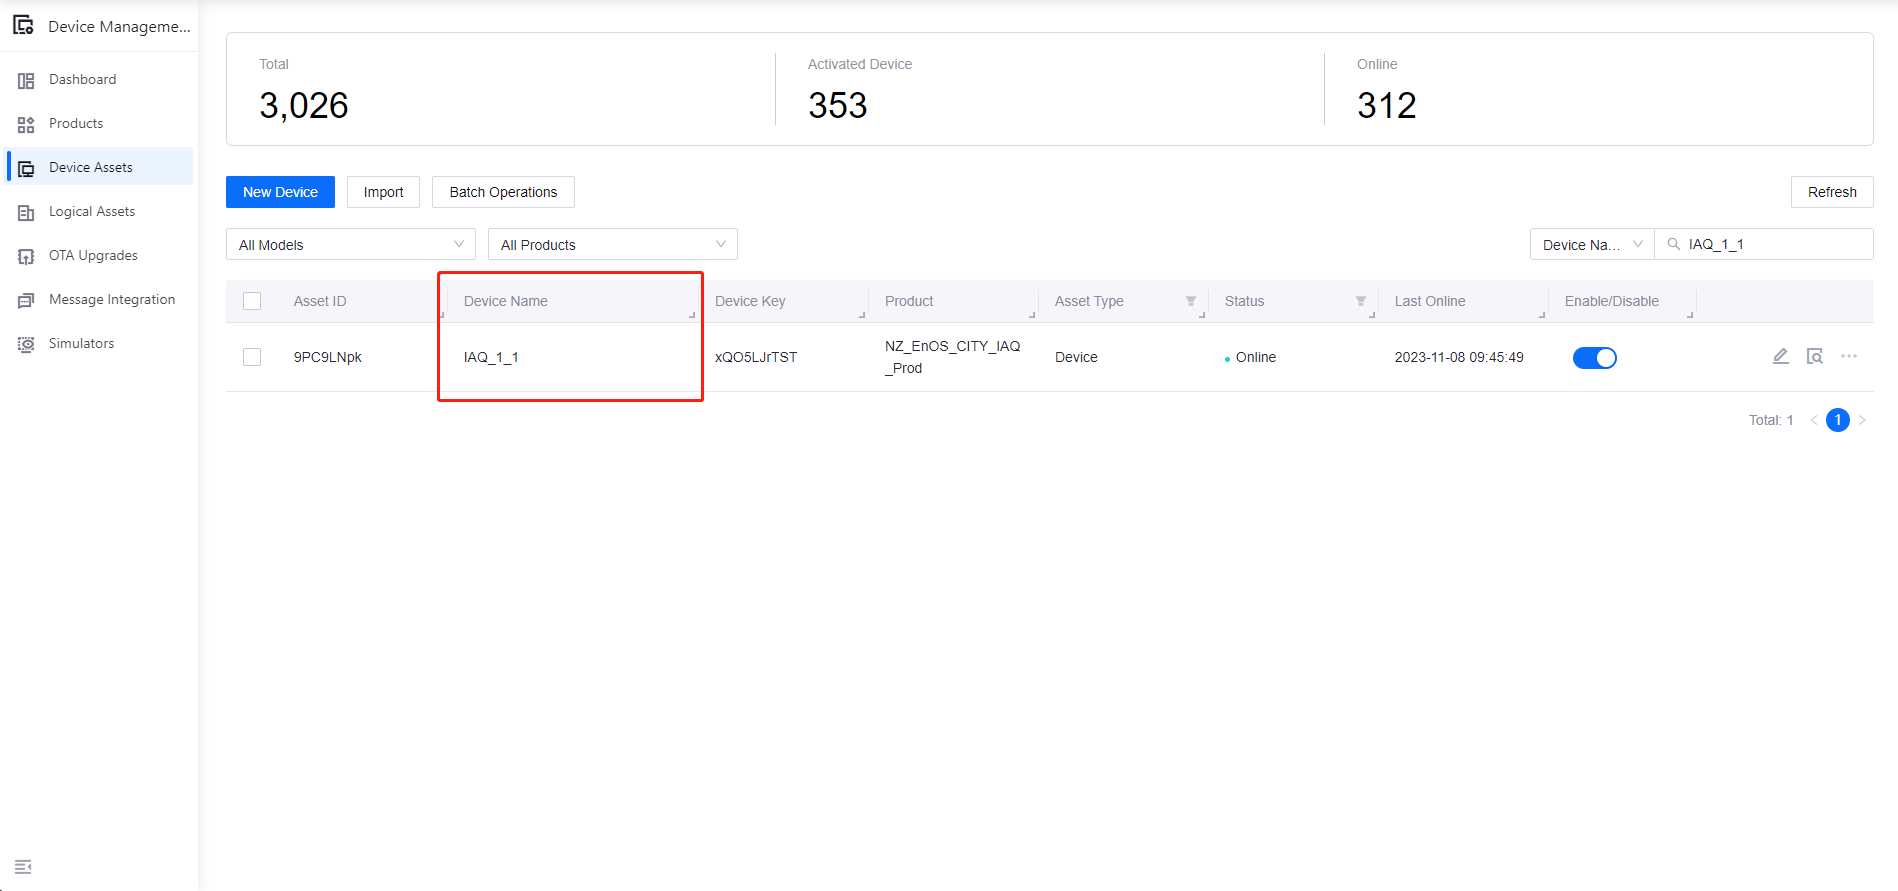
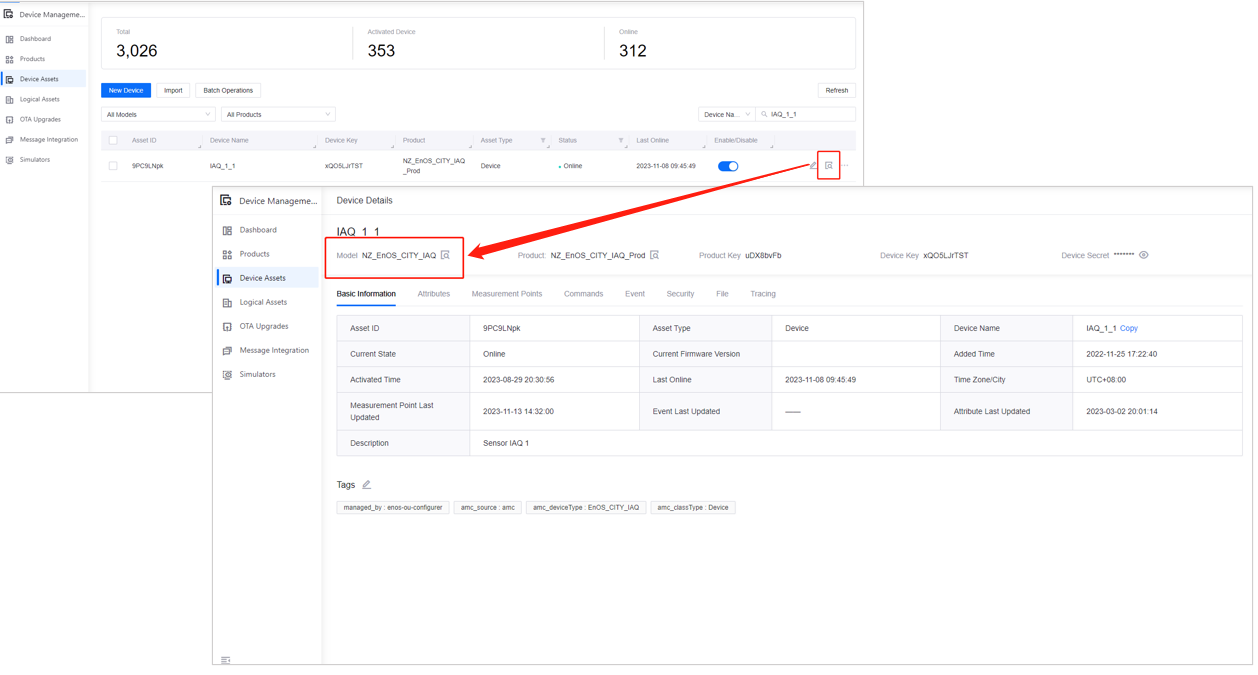
Model: Model of the required device, e.g., EnOS_CITY_IAQ. When configuring the data for the corresponding widgets later, you will need this model to be selected as the data source category.
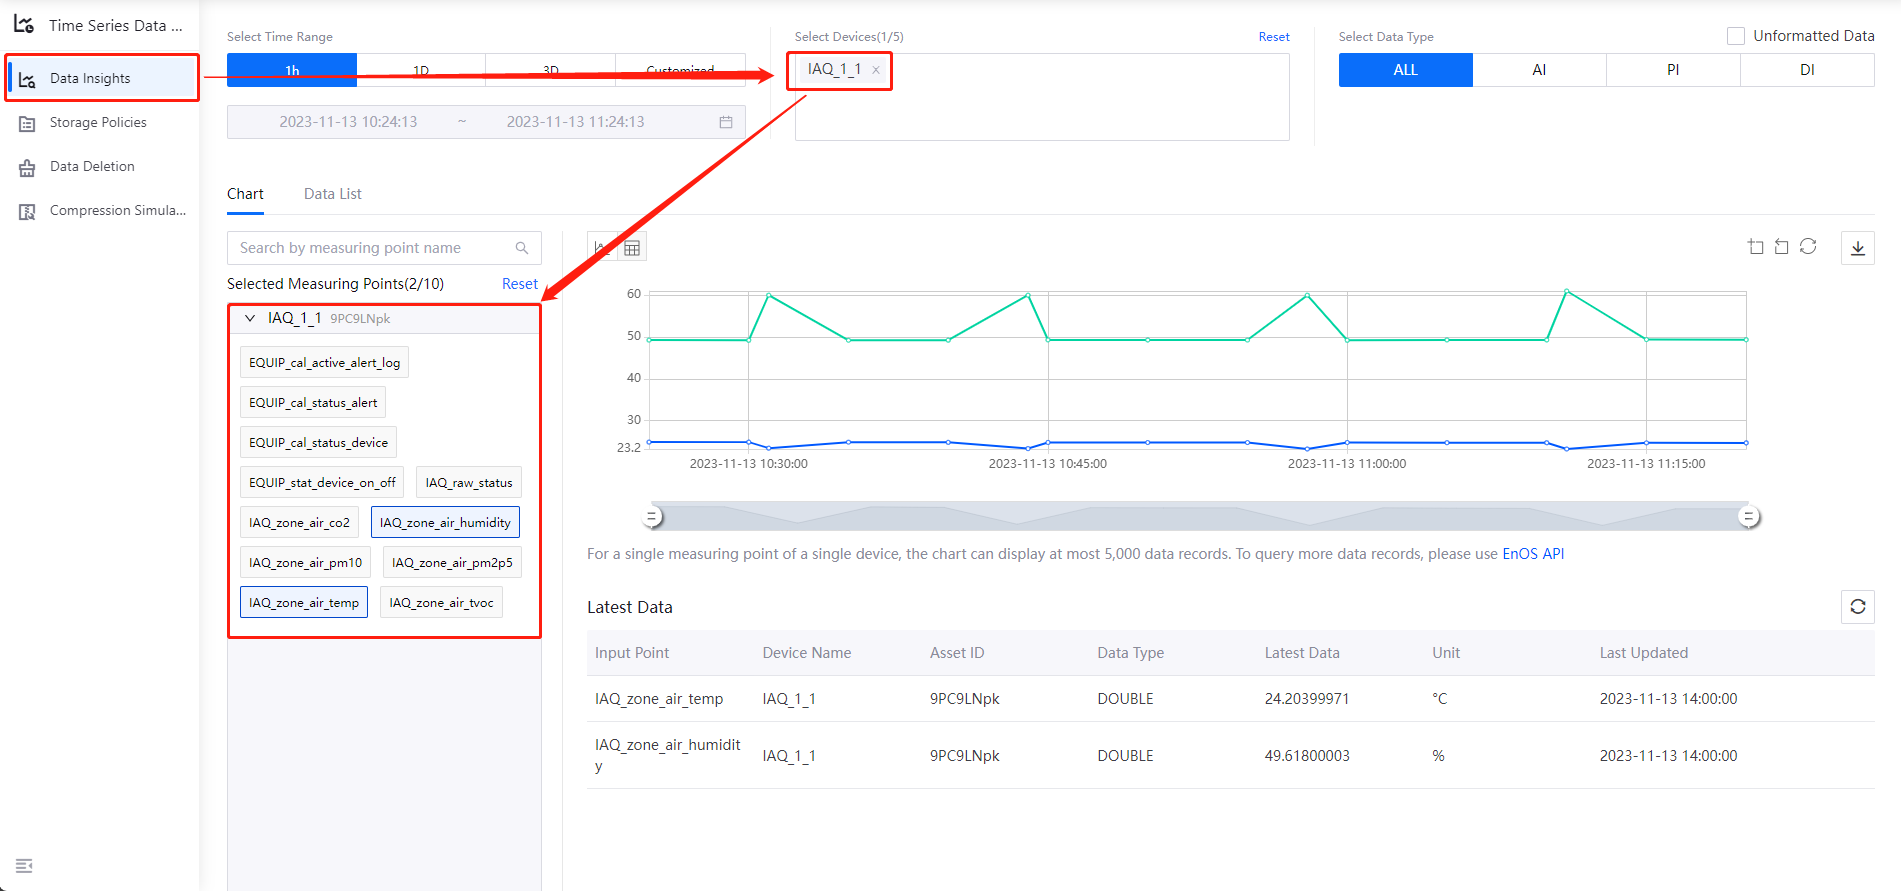
Go to Data > Data Insights in Application Portal > Developer Console, and configure the following information to view the required TSDB data items and the corresponding device data.
Configuration Item |
Sample Value |
Description |
|---|---|---|
Select Devices |
IAQ_1_1(9PC9LNpk) |
The sensor to get real-time air quality data. |
Select Measurement Points |
IAQ_zone_air_humidity |
Indoor humidity data. |
Select Measurement Points |
IAQ_zone_air_temp |
Indoor temperature data. |
Step 2: Enabling the TSDB Data Source
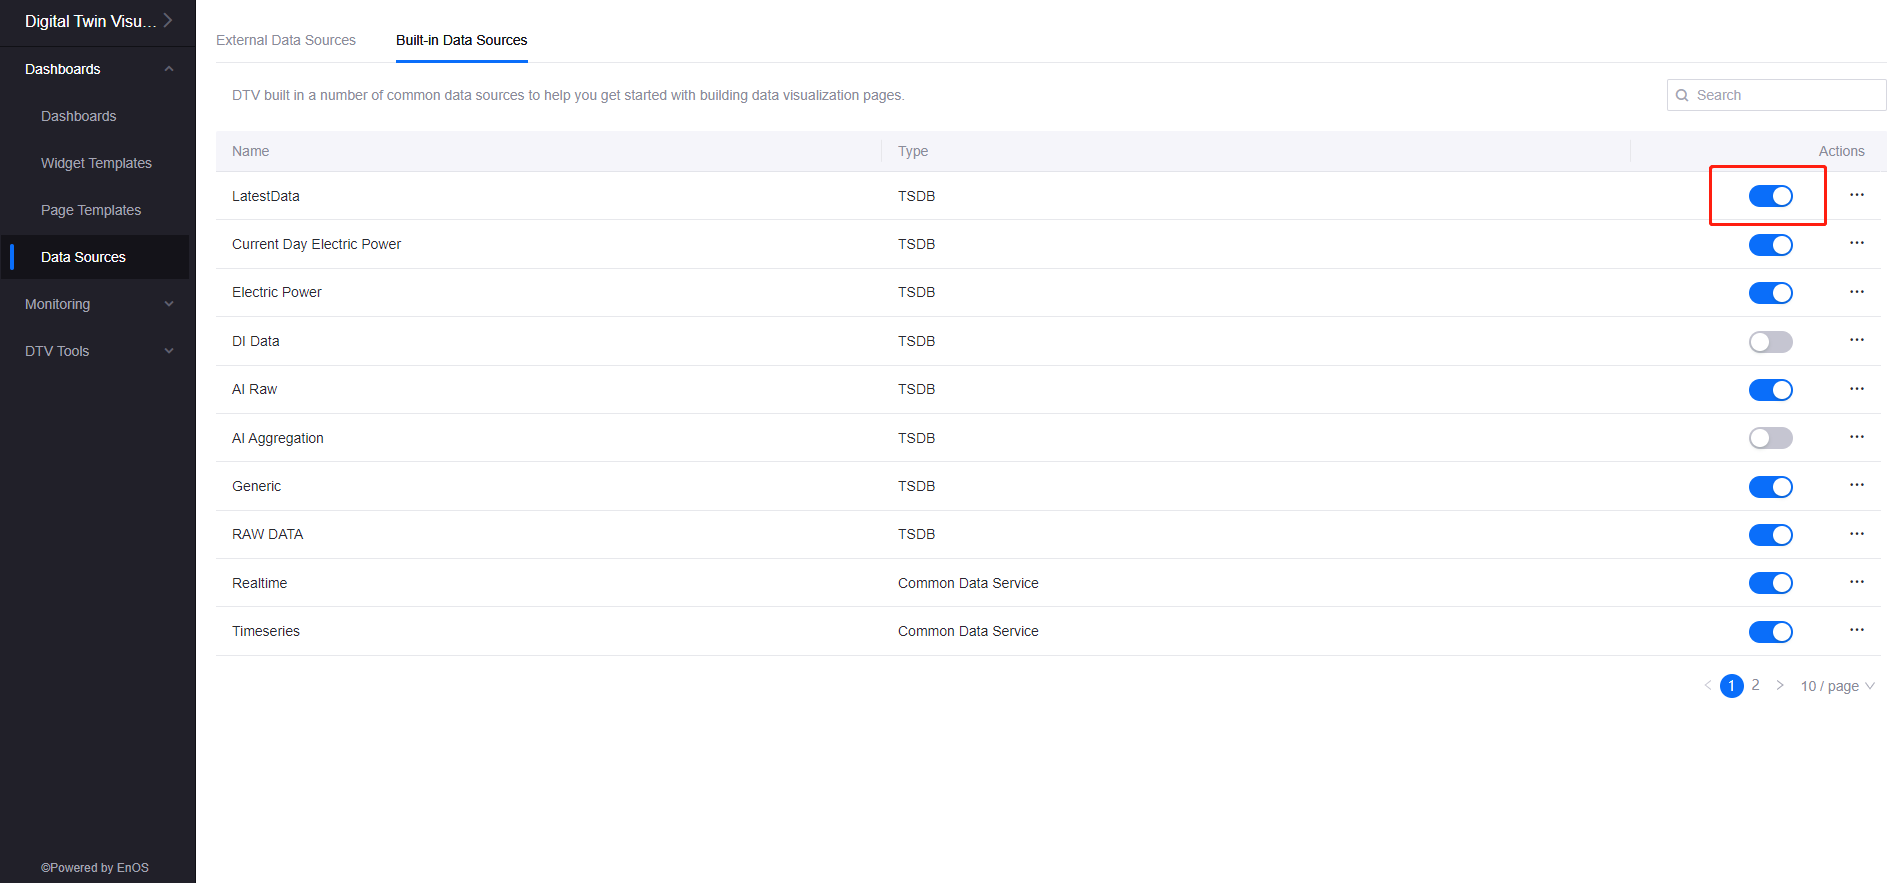
Go to Digital Twin Visualization > Data Sources > Built-in Data Sources in Application Portal, and enable the LatestData data source.
Step 3: Configuring a Dashboard Page
DTV organizes visualization widgets through dashboard pages. Create a dashboard to display visualization widgets and asset data with the following steps:
Select Digital Twin Visualization > Dashboards in Application Portal.
Select New and enter the page name, e.g., “Air Quality.”
Select Page Settings and configure as follows:
Configuration Item |
Mandatory/Optional |
Example |
Description |
|---|---|---|---|
Theme |
Optional |
dark |
The theme color of the dashboard. DTV currently supports three theme colors: light, green, and dark. |
After creating the dashboard, add the Indoor Temperature widget and Indoor Humidity widget to the dashboard page with the following steps:
Select Add > Widget/Container > Widget, and select the target widget type in the pop-up window. Add the following widgets to the page.
Name |
Type |
Description |
|---|---|---|
Indoor Temperature |
Meter Gauge |
Select Gauge > Meter Gauge in the pop-up window. |
Indoor Humidity |
Meter Gauge |
Select Gauge > Meter Gauge in the pop-up window. |
2. Hover over the upper right corner of the widgets, select Edit from the drop-down list, and configure the following widget information:
Indoor Temperature Widget
Category |
Configuration Item |
Example |
Description |
|---|---|---|---|
Basic |
Title |
Enter ‘Indoor Temperature’ |
Enter the title of the widget. |
Data |
Data Source |
Select ‘LatestData’ |
After the data source is selected, the following data source parameters need to be configured: 1.Category: Select the corresponding model as category to display the data from the model in the widget. 2.Aggregation: Select ‘false’ to not aggregate data when requesting data from the data source. 3.Asset ID: Specify the asset ID to query data of the specified device. |
Data |
Measurement |
Select ‘IAQ_zone_air_temp’ |
Select ‘Add Data Field’ and select ‘ IAQ_zone_air_temp’ in the pop-up window to display the temperature data. |
Style |
Measurement Style |
/ |
Measurement Style determines how the selected measurement data is displayed in the widget. Configure the following style information: 1.Unit Name: Specify the unit name as ℃. 2.Decimal Places: Specify the decimal places of the data displayed in the widgets are 1. 3.Axis Range: Specify the axis range displayed in the widget is -20 as the minimum value and 50 as the maximum value. 4.Show as Percentage: Uncheck the box to specify that the data is not displayed as a percentage. 5.Formatting Rules: Select ‘Add’ and configure the display color as gradient blue when data falls within the corresponding data range. |
Indoor Humidity Widget
Category |
Configuration Item |
Example |
Description |
|---|---|---|---|
Basic |
Title |
Enter ‘Indoor Humidity’ |
Enter the title of the widget. |
Data |
Data Source |
Select ‘LatestData’ |
After the data source is selected, the following data source parameters need to be configured: 1.Category: Select the corresponding model as category to display the data from the model in the widget. 2.Aggregation: Select ‘false’ to not aggregate data when requesting data from the data source. 3.Asset ID: Specify the asset ID to query data of the specified device. |
Data |
Measurement |
Select ‘IAQ_zone_air_humidity’ |
Select ‘Add Data Field’ and select ‘ IAQ_zone_air_humidity’ in the pop-up window to display the humidity data. |
Style |
Measurement Style |
/ |
Measurement Style determines how the selected measurement data is displayed in the widget. Configure the following style information: 1.Unit Name: Specify the unit name as %rh. 2.Decimal Places: Specify the decimal places of the data displayed in the widgets are 1. 3.Axis Range: Specify the axis range displayed in the widget is 0 as the minimum value and 100 as the maximum value. 4.Show as Percentage: Uncheck the box to specify that the data is not displayed as a percentage. 5.Formatting Rules: Select ‘Add’ and configure the display color as gradient pink when data falls within the corresponding data range. |
For more information on configuring meter gauge, see Meter Gauge.
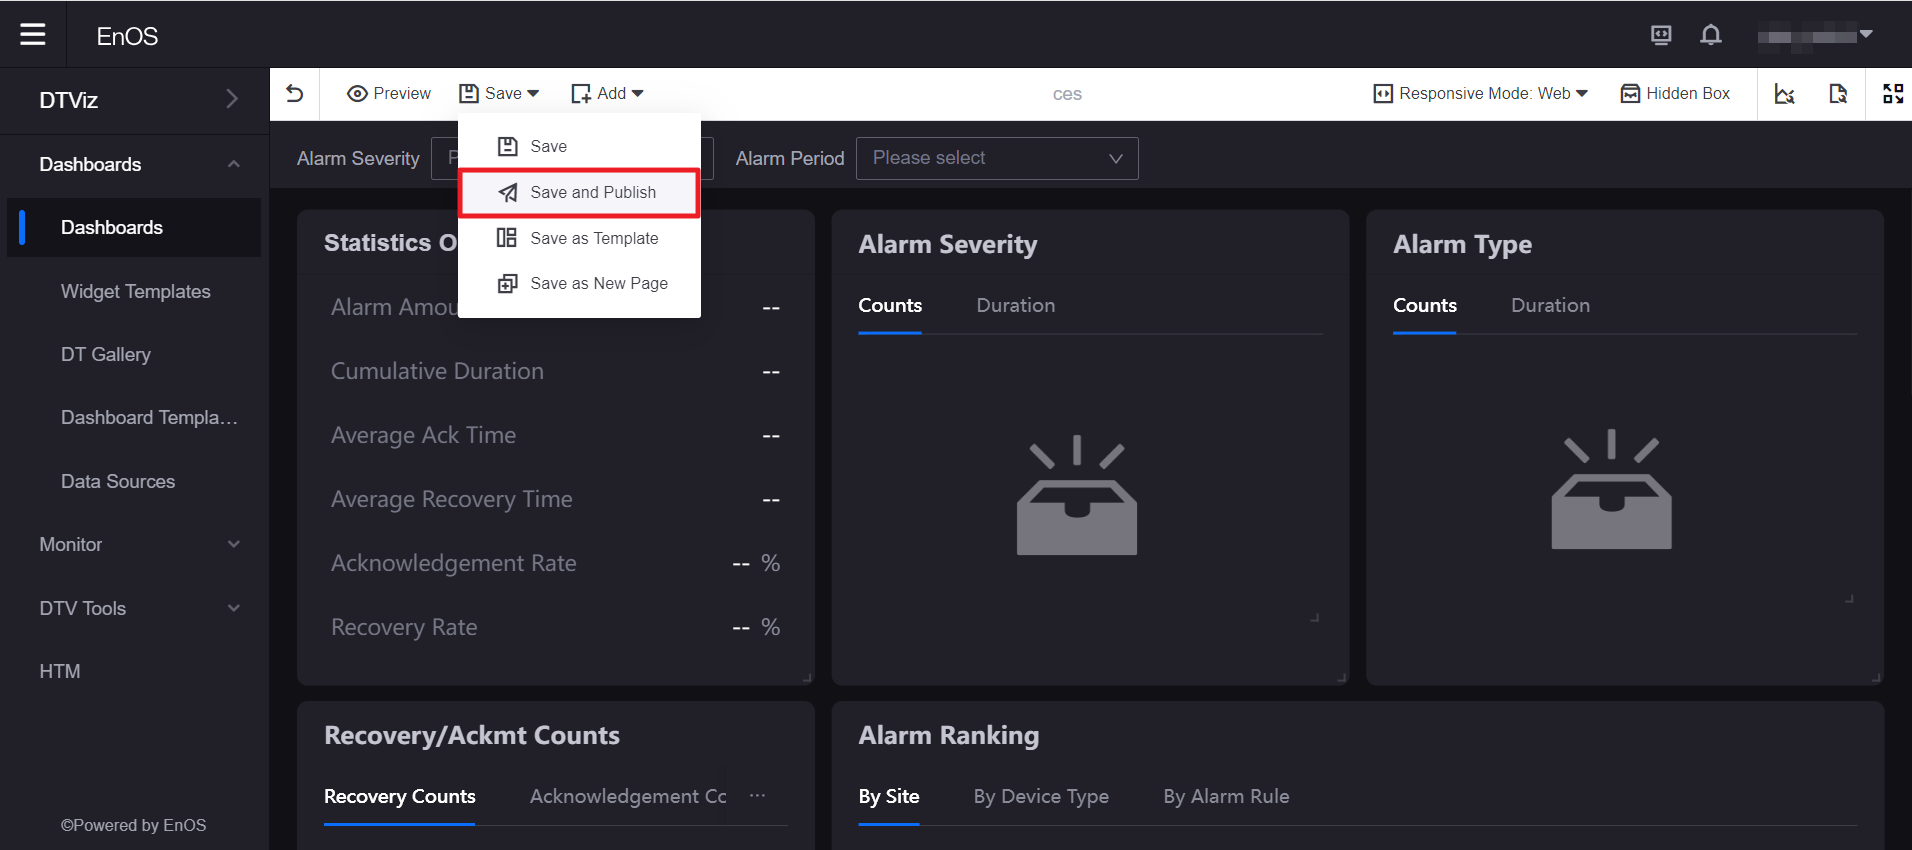
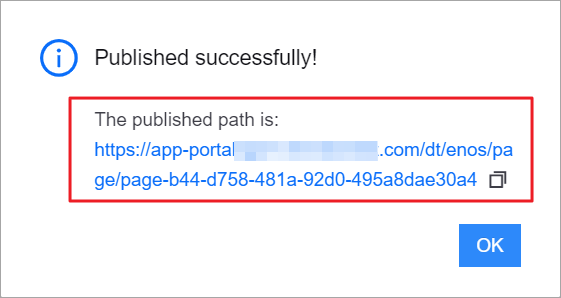
Step 4: Publishing the Dashboard Page
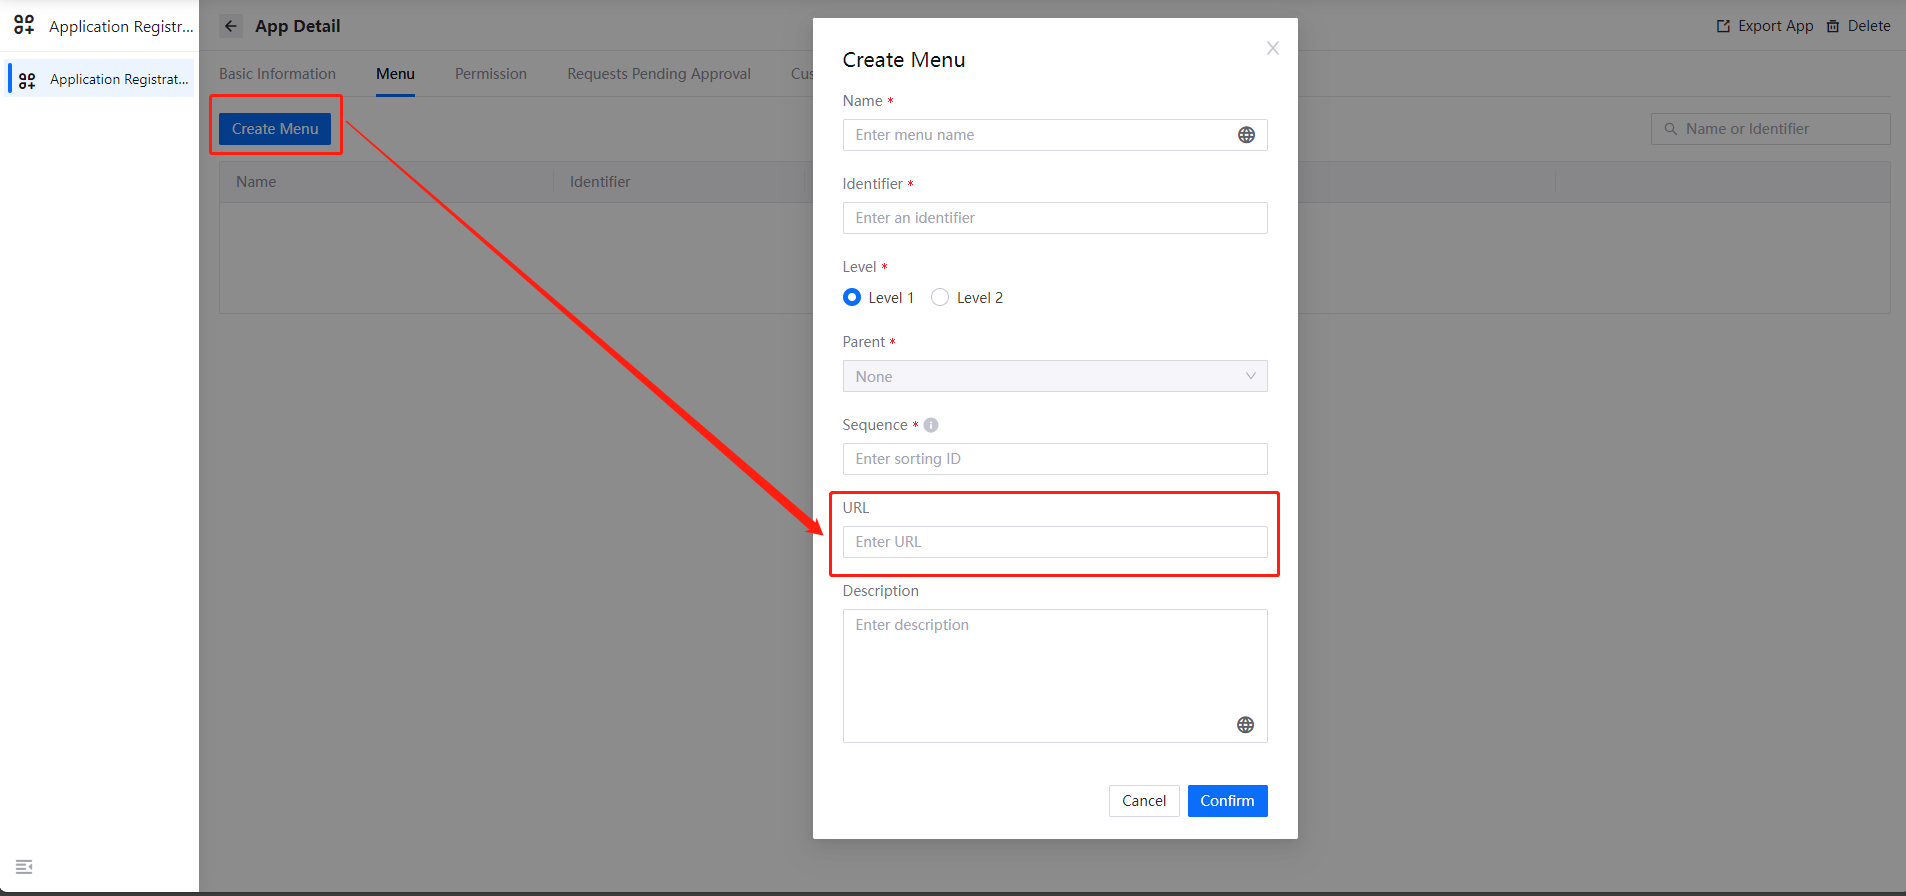
After configuring the dashboard page, you need to publish the page and obtain the page URL for future integration into an application menu.
Runtime Mode
Viewing the Visualization Page Built with TSDB Data
After the above configuration is completed, you can view the visualization page in the integrated application by the following steps:
Go to the application to which the dashboard page is added in Application Portal, and select Air Quality on the navigation pane to view the page.
In Application Portal > Developer Console, select Data > Data Insights in Application Portal > Developer Console, and configure the following information to view the TSDB data of the device. If the data matches the data presented in the visualization page, it means that the configuration is correct.
Configuration Item |
Sample Value |
Description |
|---|---|---|
Select Devices |
IAQ_1_1(9PC9LNpk) |
The sensor to get real-time air quality data. |
Select Measurement Points |
IAQ_zone_air_humidity |
Indoor humidity data. |
Select Measurement Points |
IAQ_zone_air_temp |
Indoor temperature data. |

FAQ
Q: Why can’t I select LatestData as a data source when configuring the widget?
A: It may be because the LatestData data source is not enabled in DTV. Select Digital Twin Visualization > Data Sources > Built-in Data Sources in the Application Portal, and simply turn on the switch for the LatestData data source.
Q: Why can’t I see the TSDB data in the runtime mode after configuring the widget?
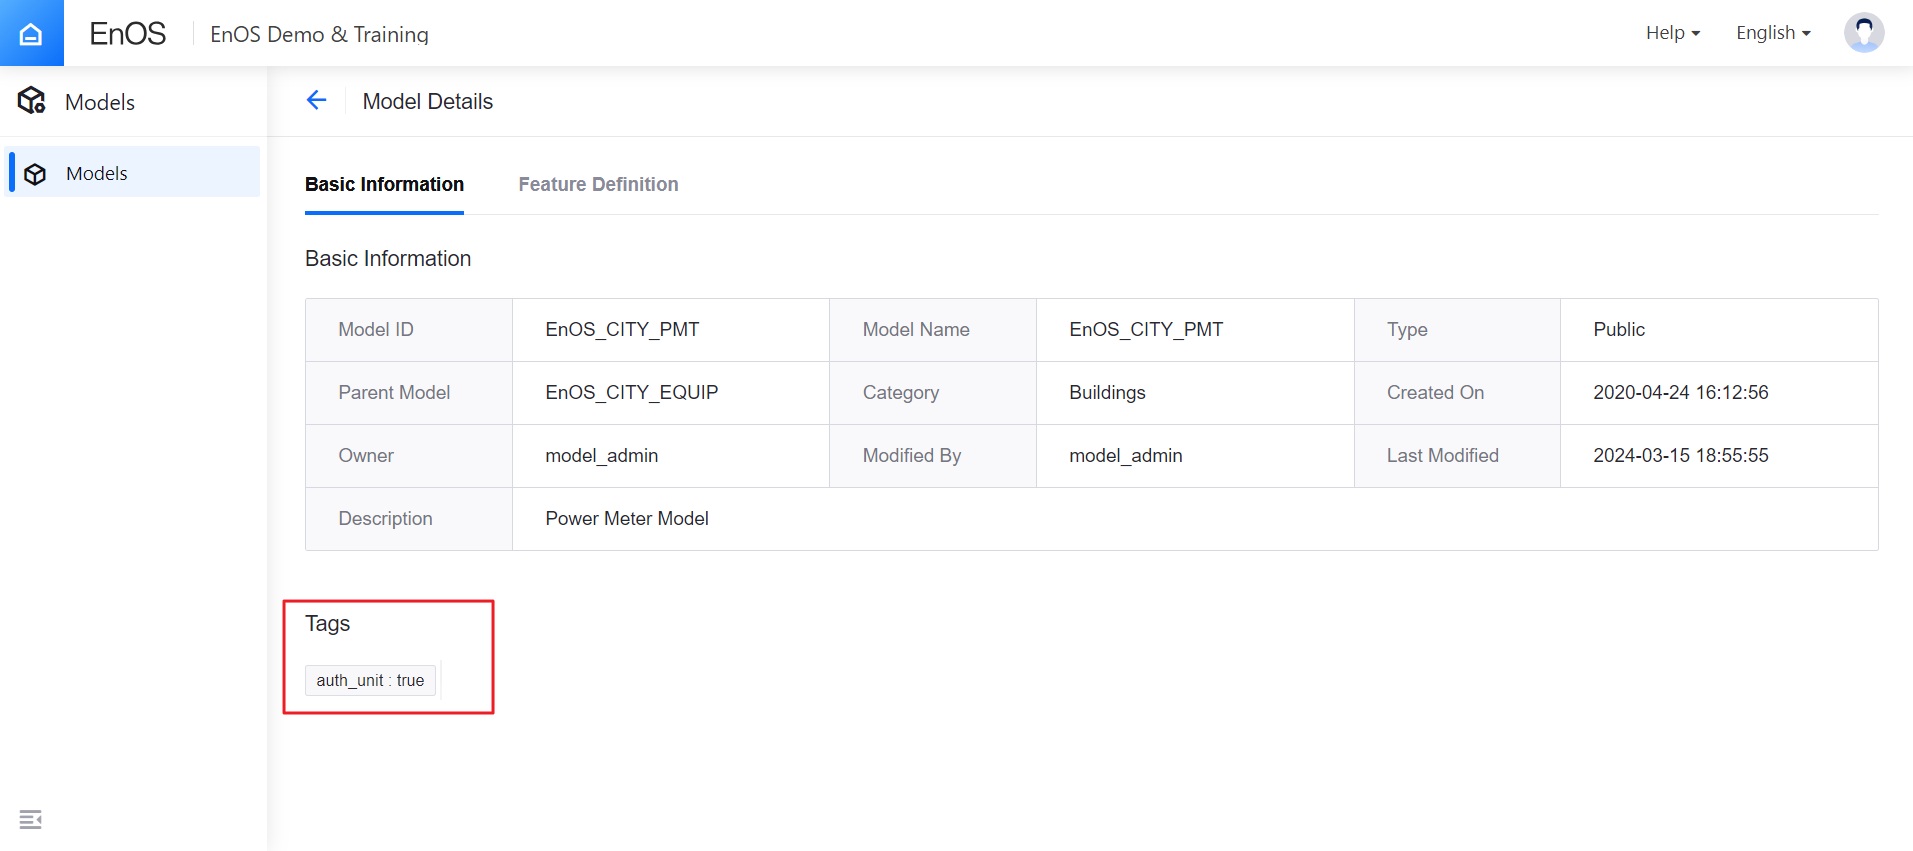
A: Possible Reason 1: The required model is not tagged. Go to Models > Model List in Application Portal > Developer Console, and tag on the asset model: auth_unit : true .
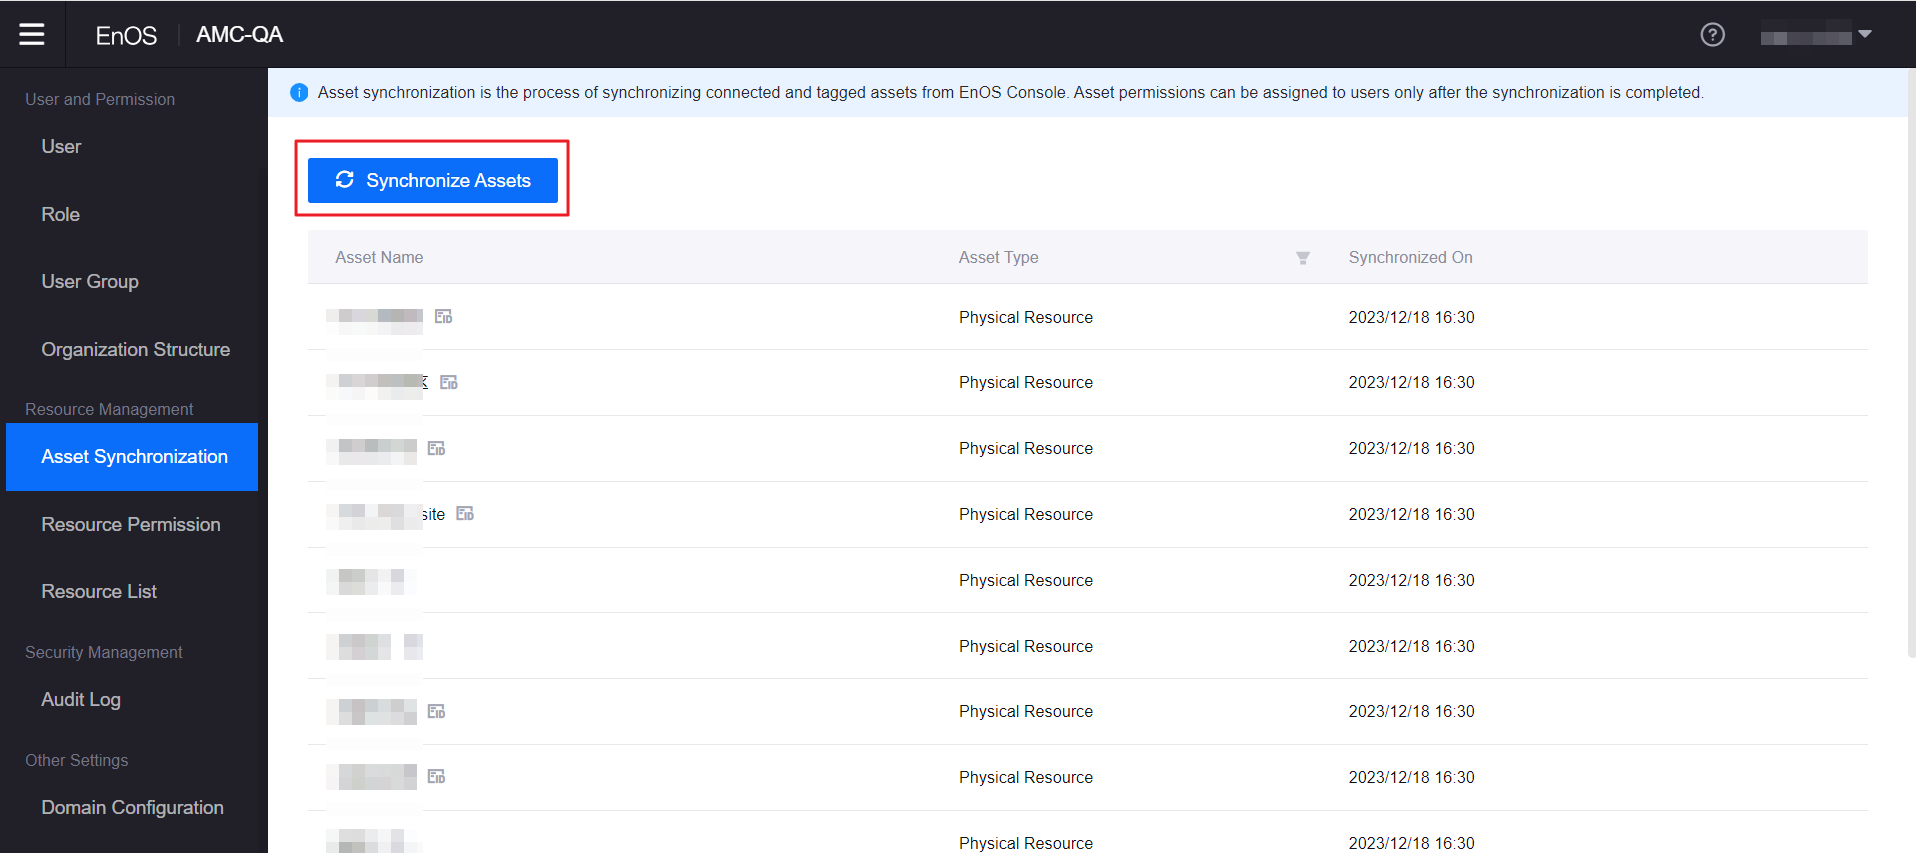
Possible Reason 2: The required asset is not synchronized. Go to Resource Management > Asset Synchronization in Admin Console of Application Portal, and check if you can see the required asset displayed in Data Insights. If not, click Synchronize Assets.
Possible Reason 3: Your account is not authorized to view the asset data. Go to Admin Console of Application Portal, check if the required asset is added to the organization structure assigned to your account, if the required menu is assigned to the role, and if that role is assigned to your account.
Q: Why can’t I see the configured page menu in Application Portal?
A: This may be because your account does not have access permissions to the relevant menu group. To obtain menu group access permissions, contact the OU administrator.
