Data Source Overview
The core of a visualization page is data, which can be obtained in various ways, such as uploading a file or calling an API interface. DTV obtains data by establishing integration channels with various data producers, which is called a data source.
What Is a Data Source
A data source is an integration channel in DTV used to connect to various data producers, providing the data support required by visualization pages. DTV encapsulates the logic of obtaining data from different sources, so that application developers can configure and use data in a unified way, without needing to deal with the complexity of the underlying data retrieval.
Depending on whether the data comes from EnOS, DTV data sources fall into two types:
Built-in data sources: Commonly used EnOS data sources preset by DTV, such as time series data stored in EnOS and registered metric data.
External data sources: Data sources manually configured by application developers, such as static data uploaded through a CSV file, or third-party data obtained through an API.
Types of Data Source
The data source types supported by DTV are as follows:
Data source type |
External/Built-in |
Description |
|---|---|---|
Common Data Service |
Built-in |
Data called through EnOS Common Data Service APIs. |
TSDB |
Built-in |
Data stored in EnOS Time Series Database. |
Static Data |
External |
Data from an imported CSV file. |
Rest API |
External |
Data called via Rest APIs. |
Categories of Data Source
Data in a data source can have different structures. The Category of a data source is used to further specify the structure of the data source, ensuring that widgets can correctly obtain and use the data.
In DTV, the categories of data sources can be divided into:
Default category: The predefined structure that comes with the data source, including:
Model category: For example, data in TSDB and Common Data Service is classified by model by default.
Table category: For example, dimension tables and fact tables.
Other categories: For example, specific data structures such as alarms and topology.
Dataset: When the default category cannot meet your needs, you can create a dataset to customize the data structure and range.
Structure of Data Source
The structure of a data source consists of the following two parts:
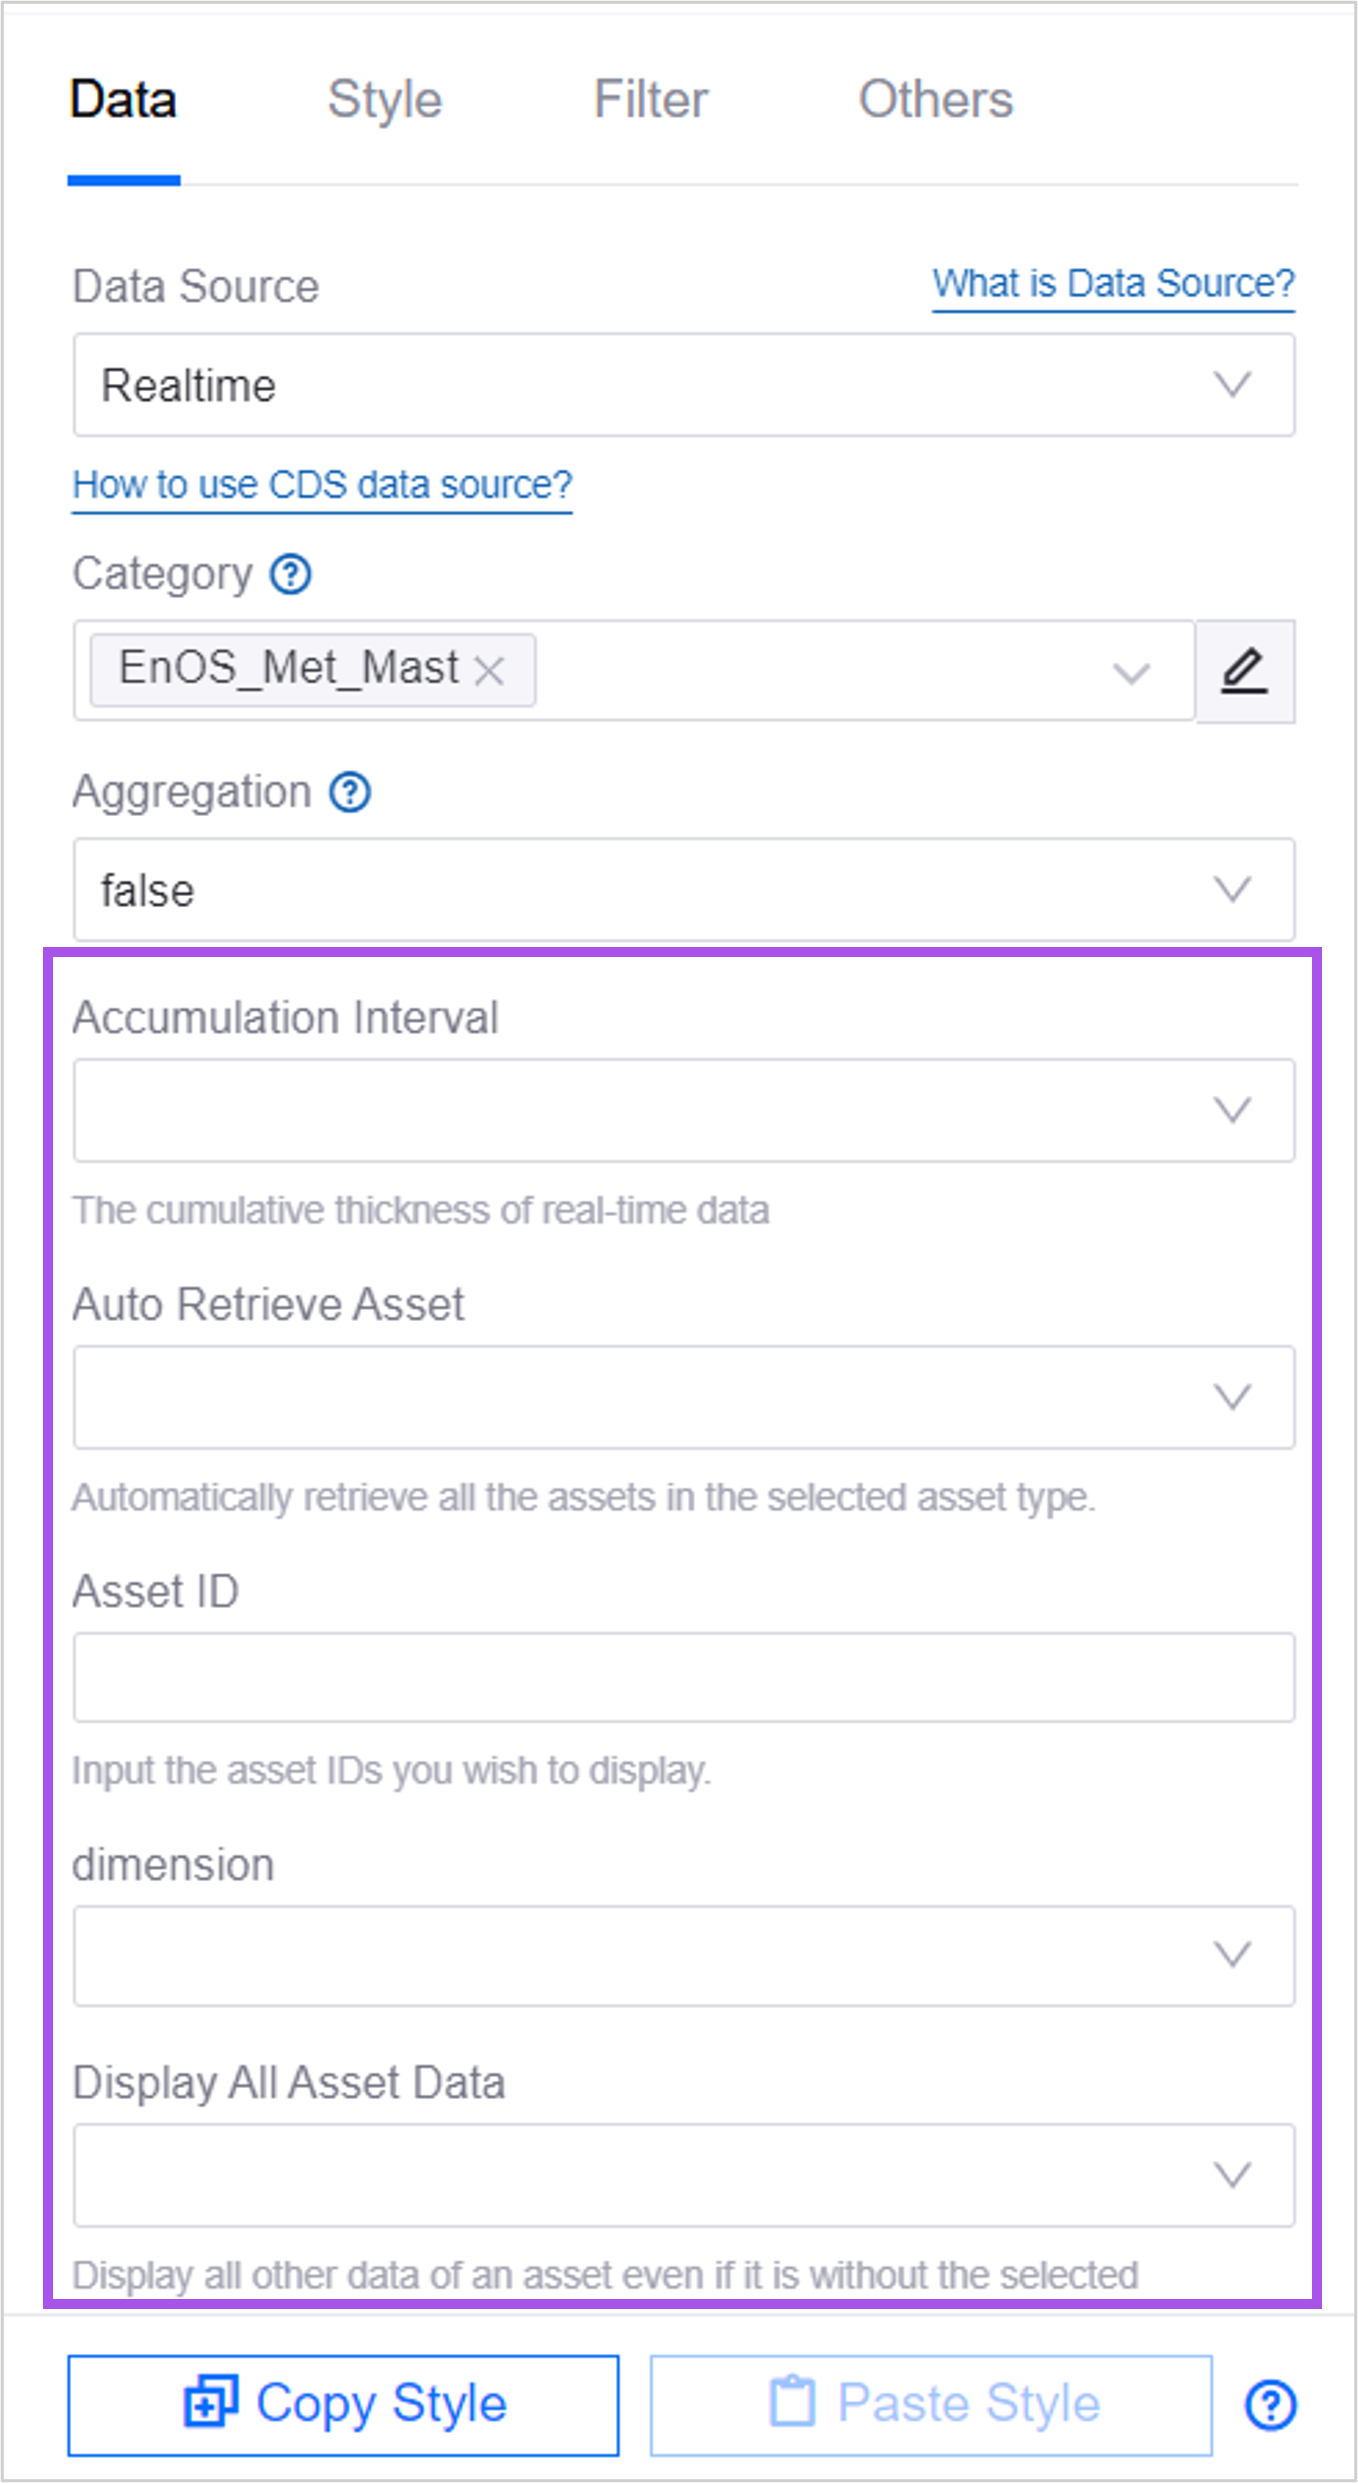
Request Parameters
The query conditions that a widget needs to specify when requesting data through a data source. Different data sources have different request parameter requirements, such as time range, asset ID, and model type.
Return Structure
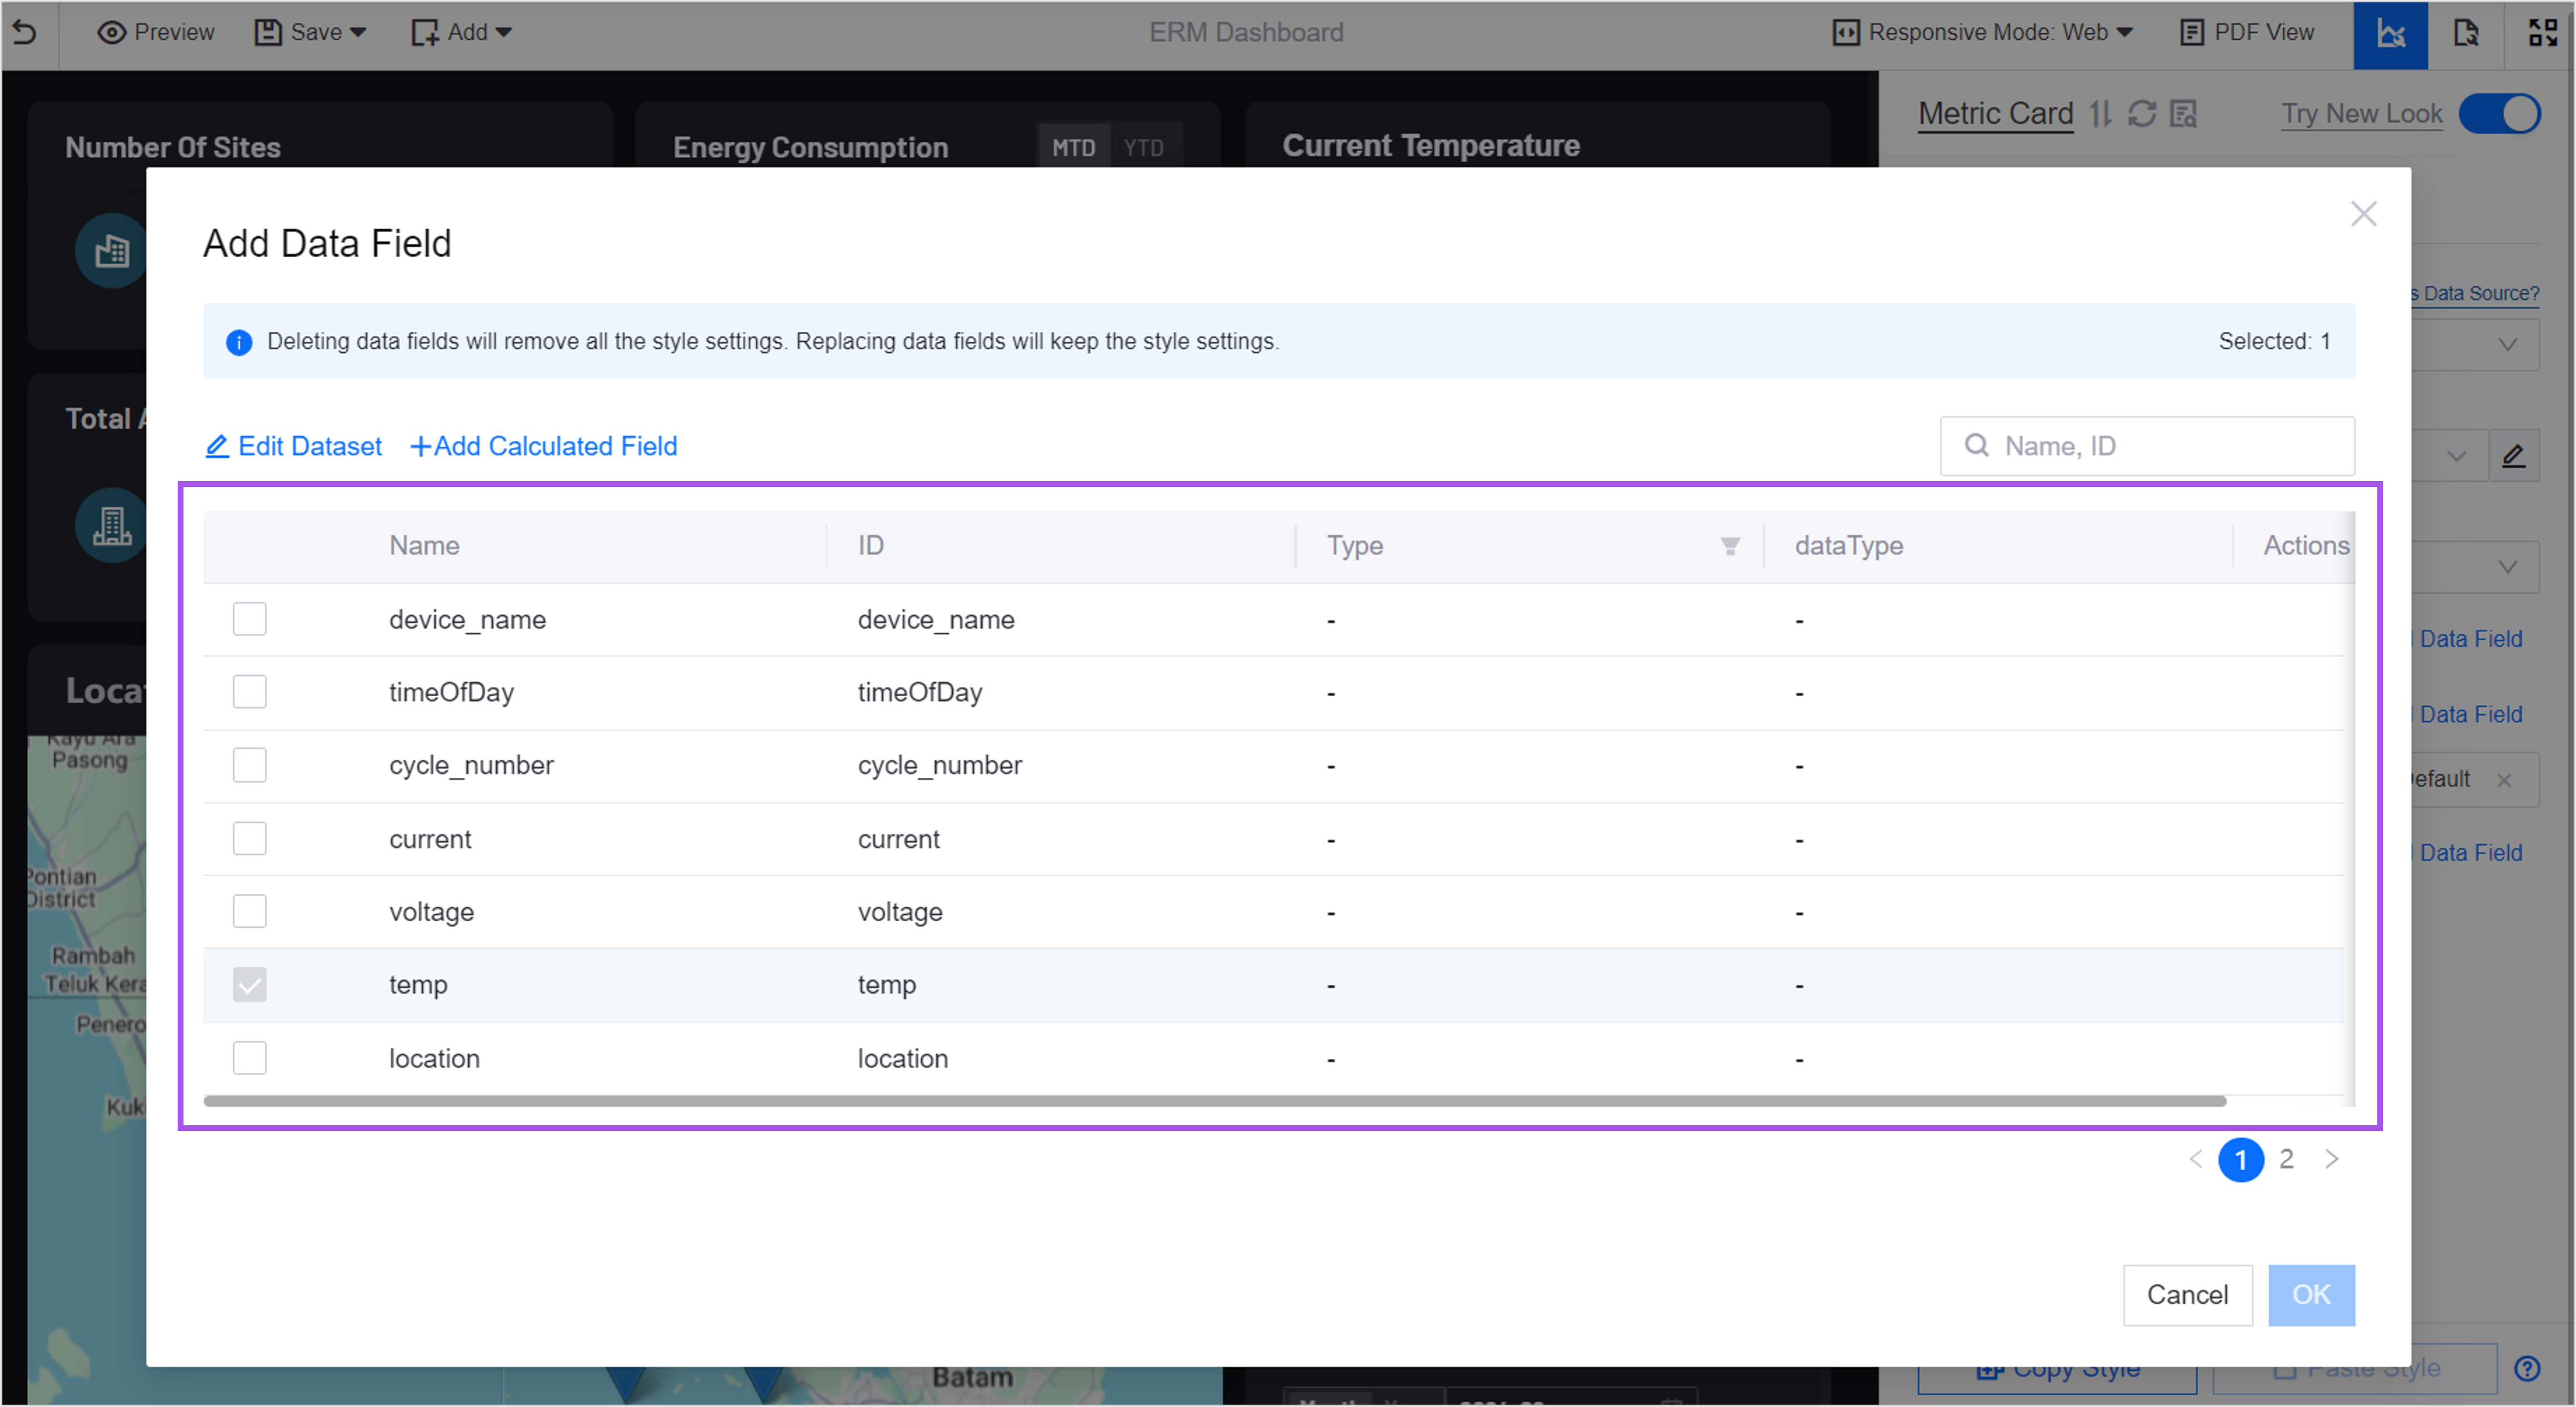
The structure of the data fields returned by the data source after it responds to a request. These fields constitute the dimensions, measures, and comparison items that can be selected when configuring a widget.
Supported Data Sources
The following table describes in detail the data sources and their default categories supported by DTV:
Data source type |
Data source name |
Default category |
Description |
|---|---|---|---|
Common Data Service |
Realtime |
Model |
EnOS model real-time data for associated assets. |
Common Data Service |
Timeseries |
Model |
Time series data of assets associated with the EnOS model over a period of time. |
Common Data Service |
Topology |
Model |
Hierarchical structure (topology) information of the assets associated with the EnOS model. |
Common Data Service |
Record |
Table |
Factual data of assets, such as alarms, control requests, etc. |
Common Data Service |
Alarm |
Alarm |
Alarm data of the current OU. |
TSDB |
LatestData |
Model |
EnOS model real-time data for associated assets. |
TSDB |
Current Day Electric Power |
Model |
The current day’s electricity data of the assets associated with the EnOS model. |
TSDB |
Electric Power |
Model |
The electricity data of the assets associated with the EnOS model over a period of time. |
TSDB |
DI Data |
Model |
The state change (DI) data of the assets associated with the EnOS model over a period of time. |
TSDB |
AI Raw |
Model |
The AI raw data of the measurement points of the assets associated with the EnOS model over a period of time. |
TSDB |
AI Aggregation |
Model |
The AI minute-level normalized data of the measurement points of the assets associated with the EnOS model over a period of time. |
TSDB |
Generic |
Model |
The generic type of data of the measurement points of the assets associated with the EnOS model over a period of time. |
TSDB |
RAW DATA |
Model |
The historical data of the measurement points of the assets associated with the EnOS model over a period of time. |
Static Data |
|
None |
No default structure, a dataset is required. |
Rest API |
|
Category |
Data categories obtained by Rest API, such as asset tree structure, device type information, etc. |
Relationship Between Data Sources and Pages
Data sources provide data support for visualization pages. In DTV:
A single data source can provide data for multiple pages.
The data displayed on a DTV page can come from one or more data sources.
Each widget on a DTV page is associated with a data source, which determines the data dimensions, measures, filter conditions, etc. displayed by the widget.
Widget Data Items
In a DTV page, the return parameters of a data source are displayed in widgets in the form of data items. When configuring widget data, data items need to be grouped, refined, and compared according to certain logic to present rich visualization effects. DTV uses the three concepts of Dimension, Measurement, and Comparison to logically organize data items.
Dimension
A dimension describes the categorical attributes of data. It can be used to group and refine data for analysis and provide contextual information for the data.
For example, when analyzing sales data, common dimensions include:
Product category: such as clothing, electronic products, household items, etc., can be used to display the sales of different types of products.
Brand: such as products of different brands, can be used to display the market share and performance of each brand.
Region: such as divisions by province and city, can be used to display sales and regional differences in different regions.
Time: such as divisions by year, quarter, and month, can be used to display the seasonal trend of sales.
Measurement (Metric)
A measure quantifies the numerical attributes of data. It provides specific numerical metrics of the data and is the basis for statistical analysis and comparison.
For example, when analyzing sales data, common measures include:
Sales: reflects the revenue of a product and is one of the most basic measures.
Order quantity: reflects the sales activity and market demand of the product.
Conversion rate: reflects the efficiency of website visitors’ transactions and is an important metric for evaluating marketing effectiveness.
Number of users: reflects the market size and growth of the product, and is the core metric for focusing on user growth.
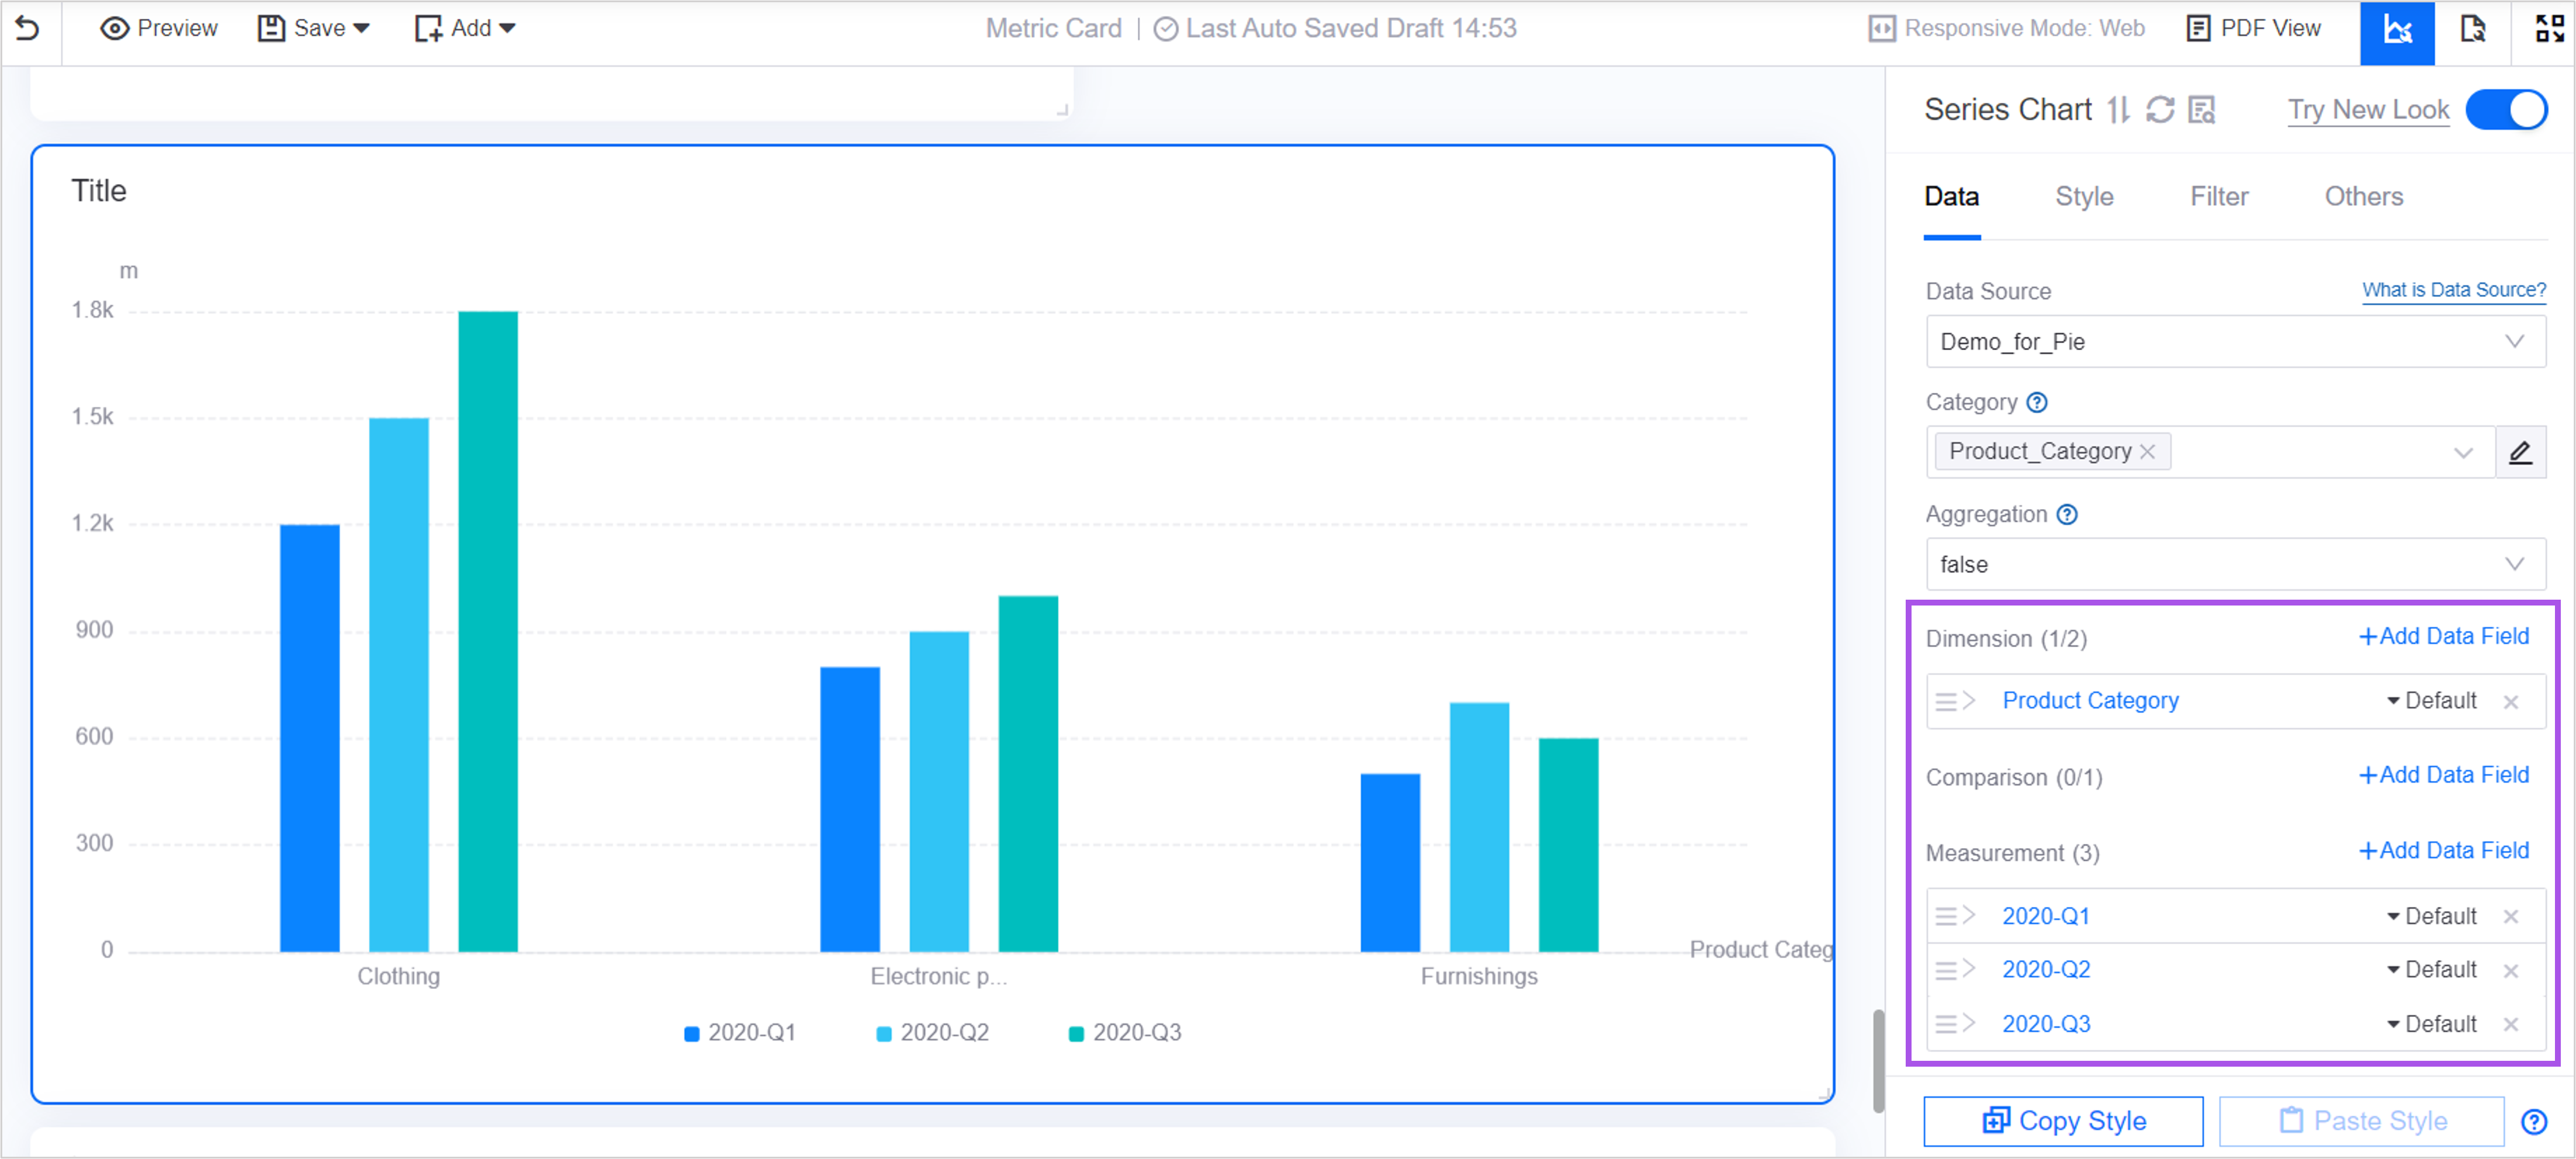
The following table shows the data using quarterly sales as the measure and product category as the dimension.
Product Category |
2020 Q1 |
2020 Q2 |
2020 Q3 |
|---|---|---|---|
Clothing |
$12 million |
$15 million |
$18 million |
Electronic products |
$8 million |
$9 million |
$10 million |
Household products |
$5 million |
$7 million |
$6 million |
Based on the above data, the following Series Chart can be configured:
Comparison
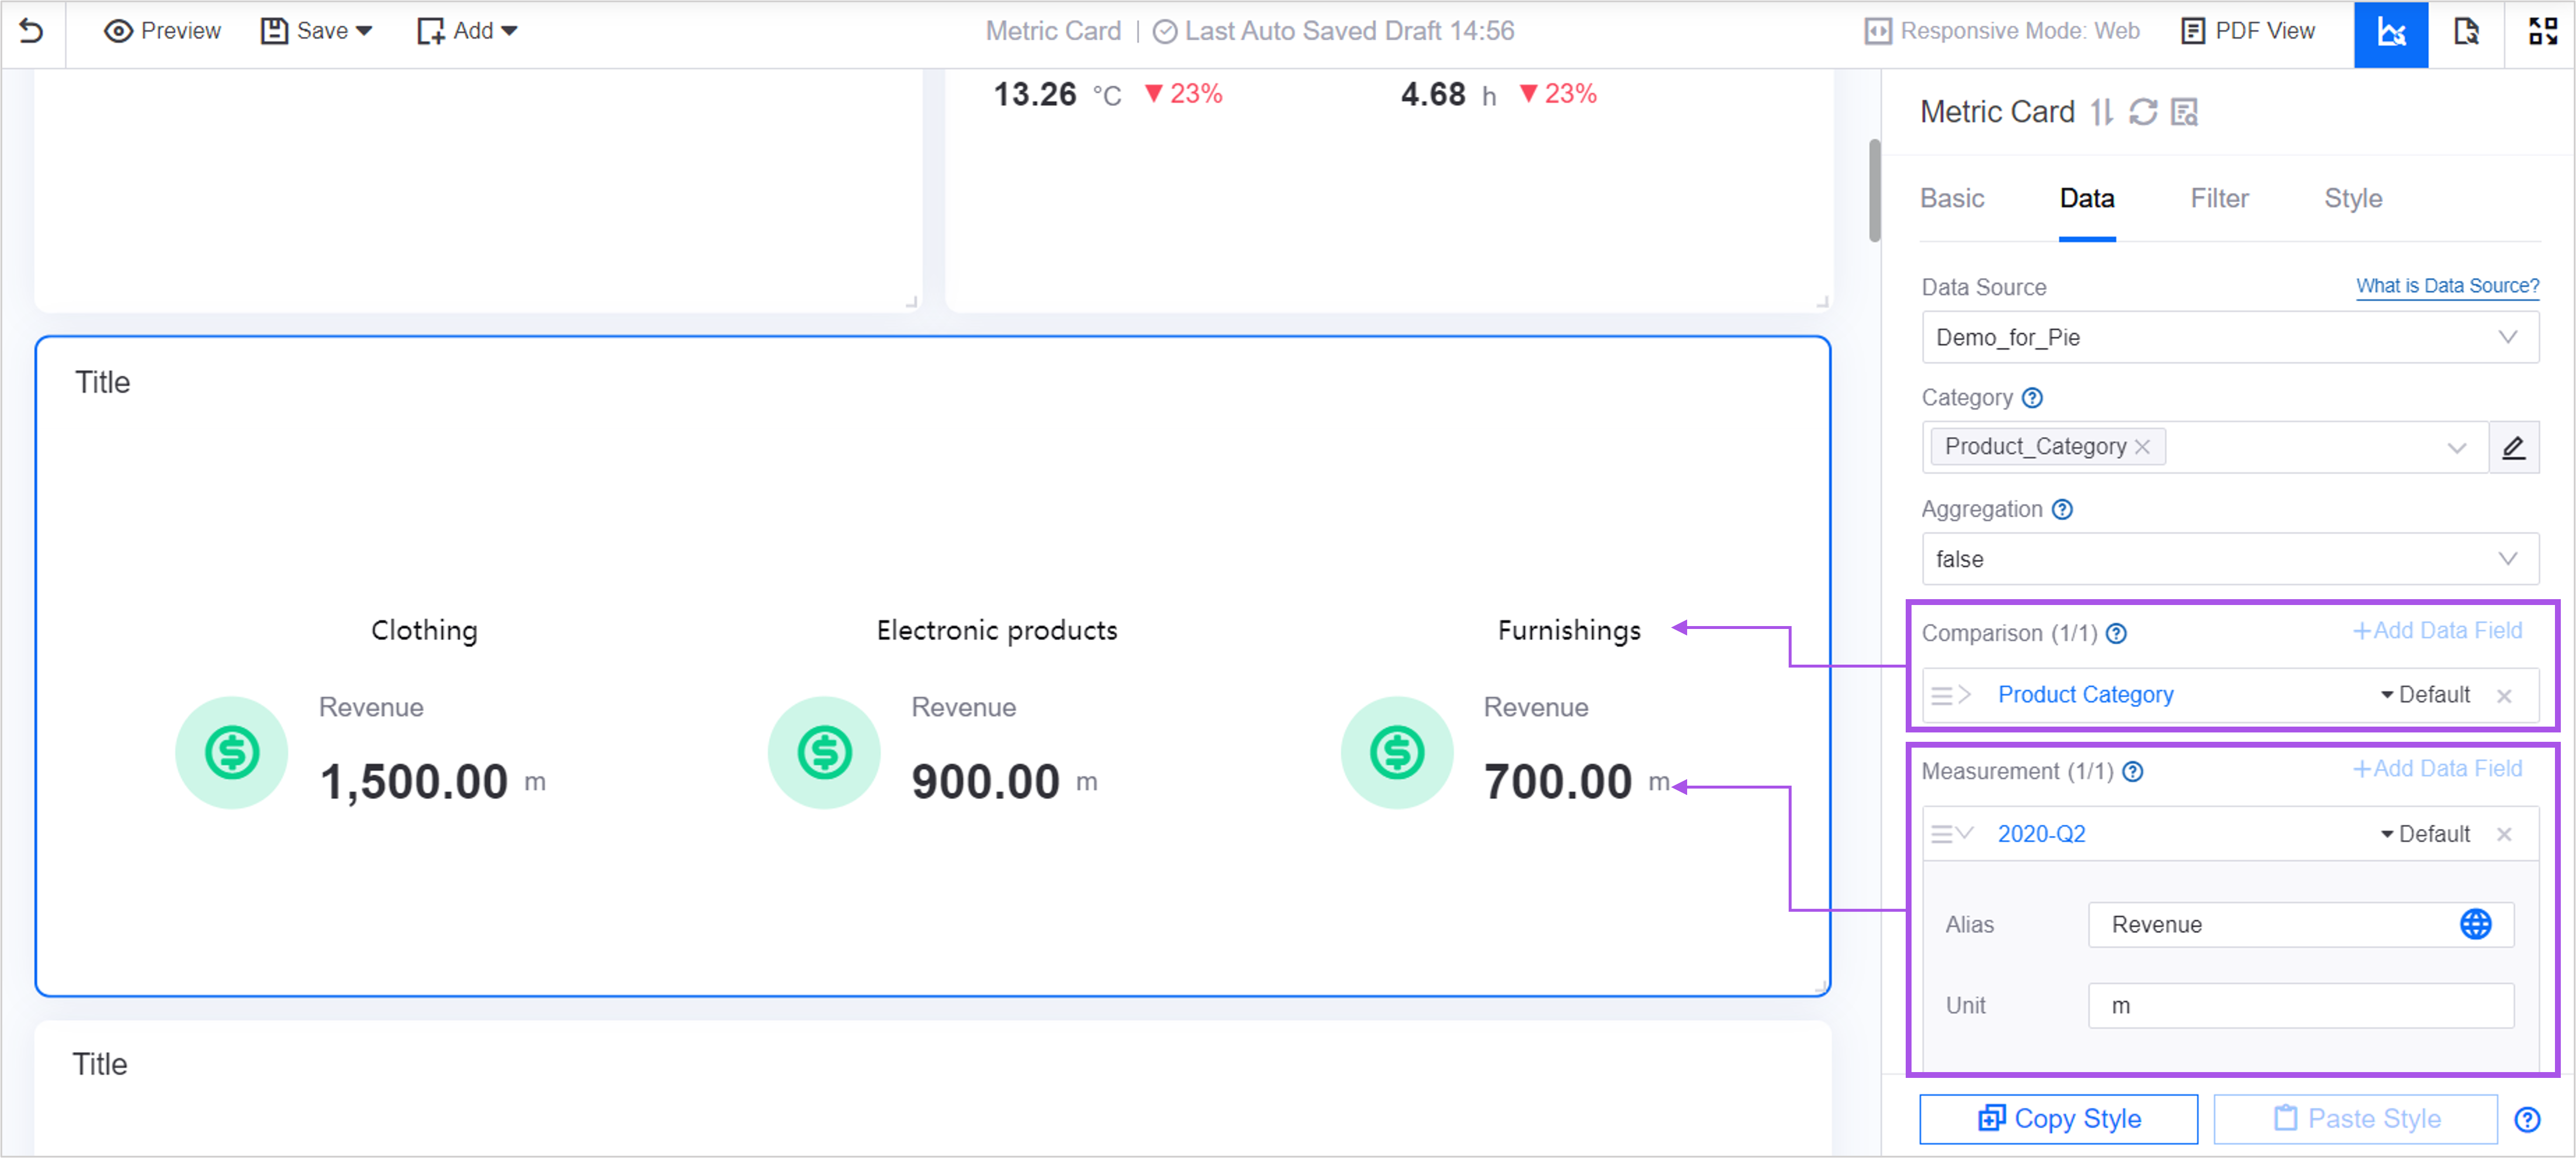
Comparison refers to comparing the measured data from a certain dimension to discover differences and trends between the data.
For example, when analyzing e-commerce data, you can compare the sales of products in different categories to analyze the sales performance of each type of product.
In the above data, with product category as the comparison item, multiple metric data can be generated in the Single-Metric Card widget to display the product sales under each category.
Dataset
A dataset is a collection of data of the same type of data structure in a data source, customized by application developers. By creating datasets, data can be classified and organized to meet the visualization needs of different scenarios.
When the data in the data source does not have a default structure, a dataset must be created to define the range and structure of the data, for example, the Static Data data source.
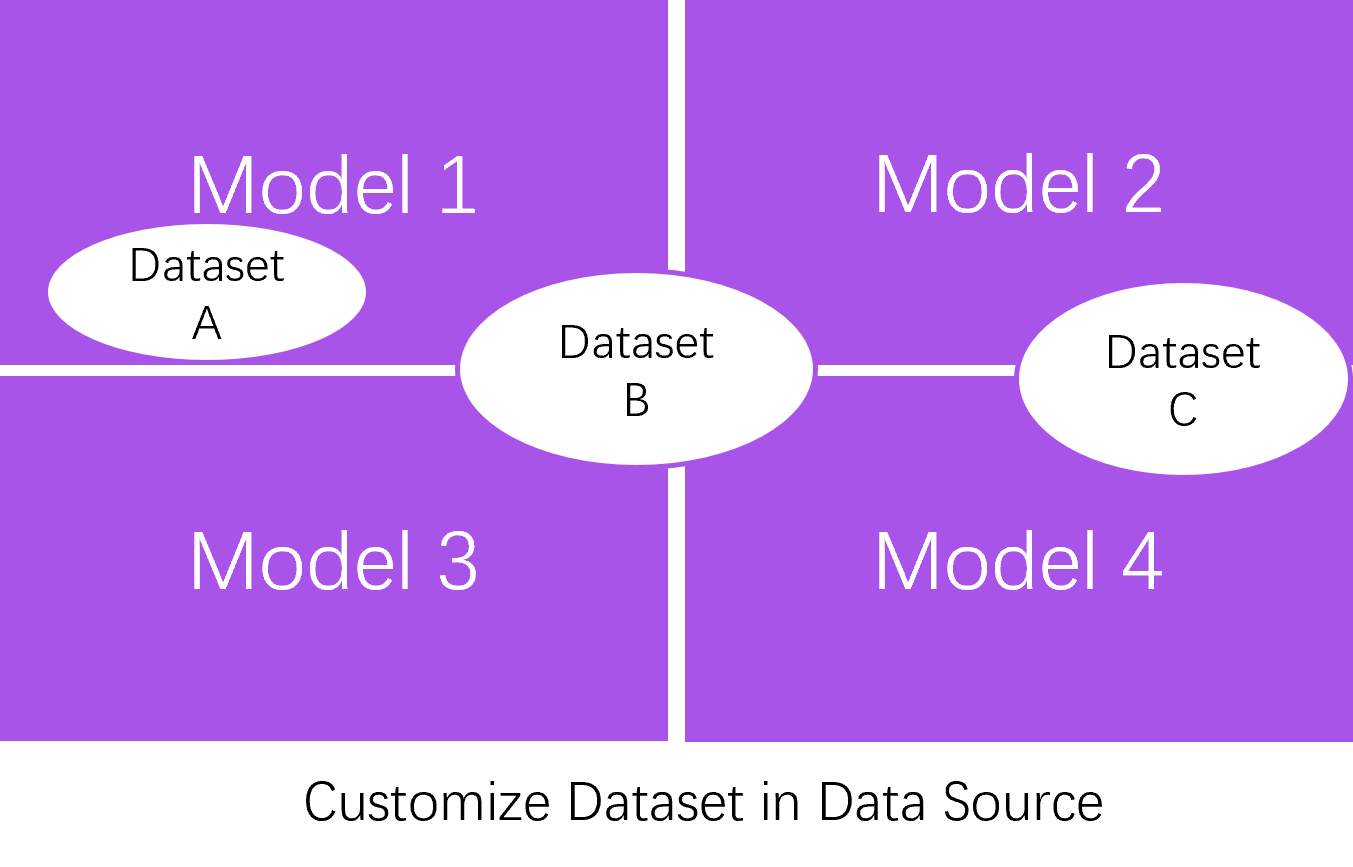
When the default structured data in the data source cannot meet your needs, you can create a dataset and customize the data range, request parameters, and return structure. For example, the figure below shows a data source with model as the default structure. When configuring the visualization page, you can select any model or dataset as the data range for the page widget.
A dataset consists of the following two parts:
Request Parameters
Request parameters are the parameters that the widgets of a page send to the data source when requesting data. After creating a dataset, you need to define the request parameters for the dataset. For example, after selecting a dataset for a dashboard widget, you need to configure the values of the selected request parameters for the widget.
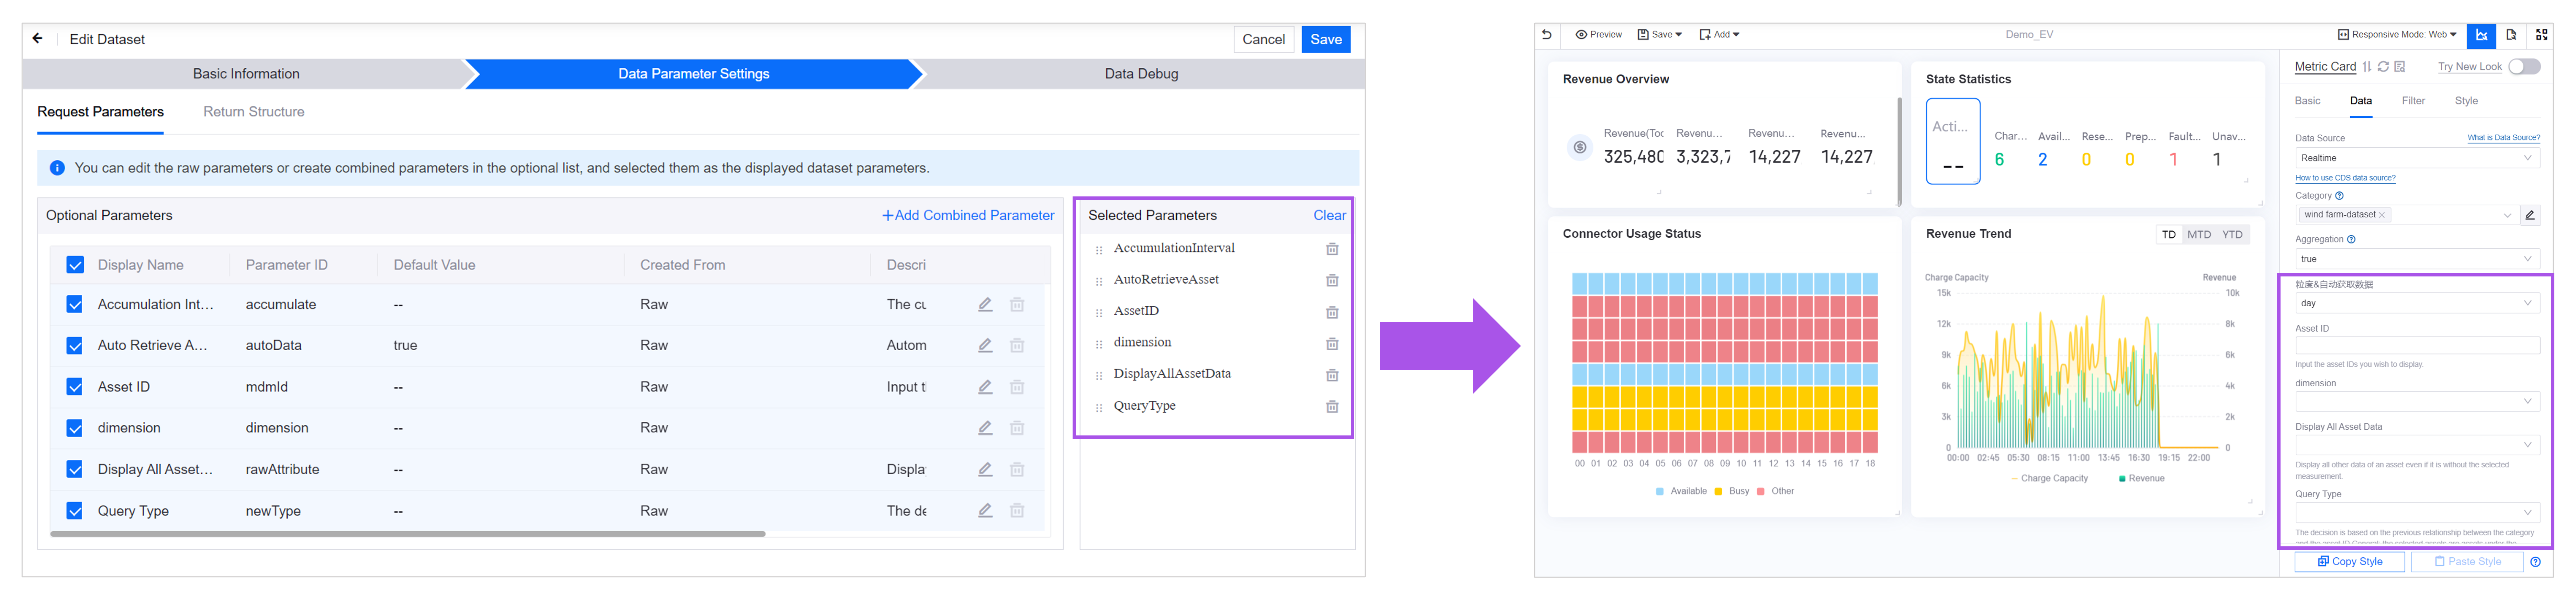
According to the source of the parameters, request parameters can be divided into:
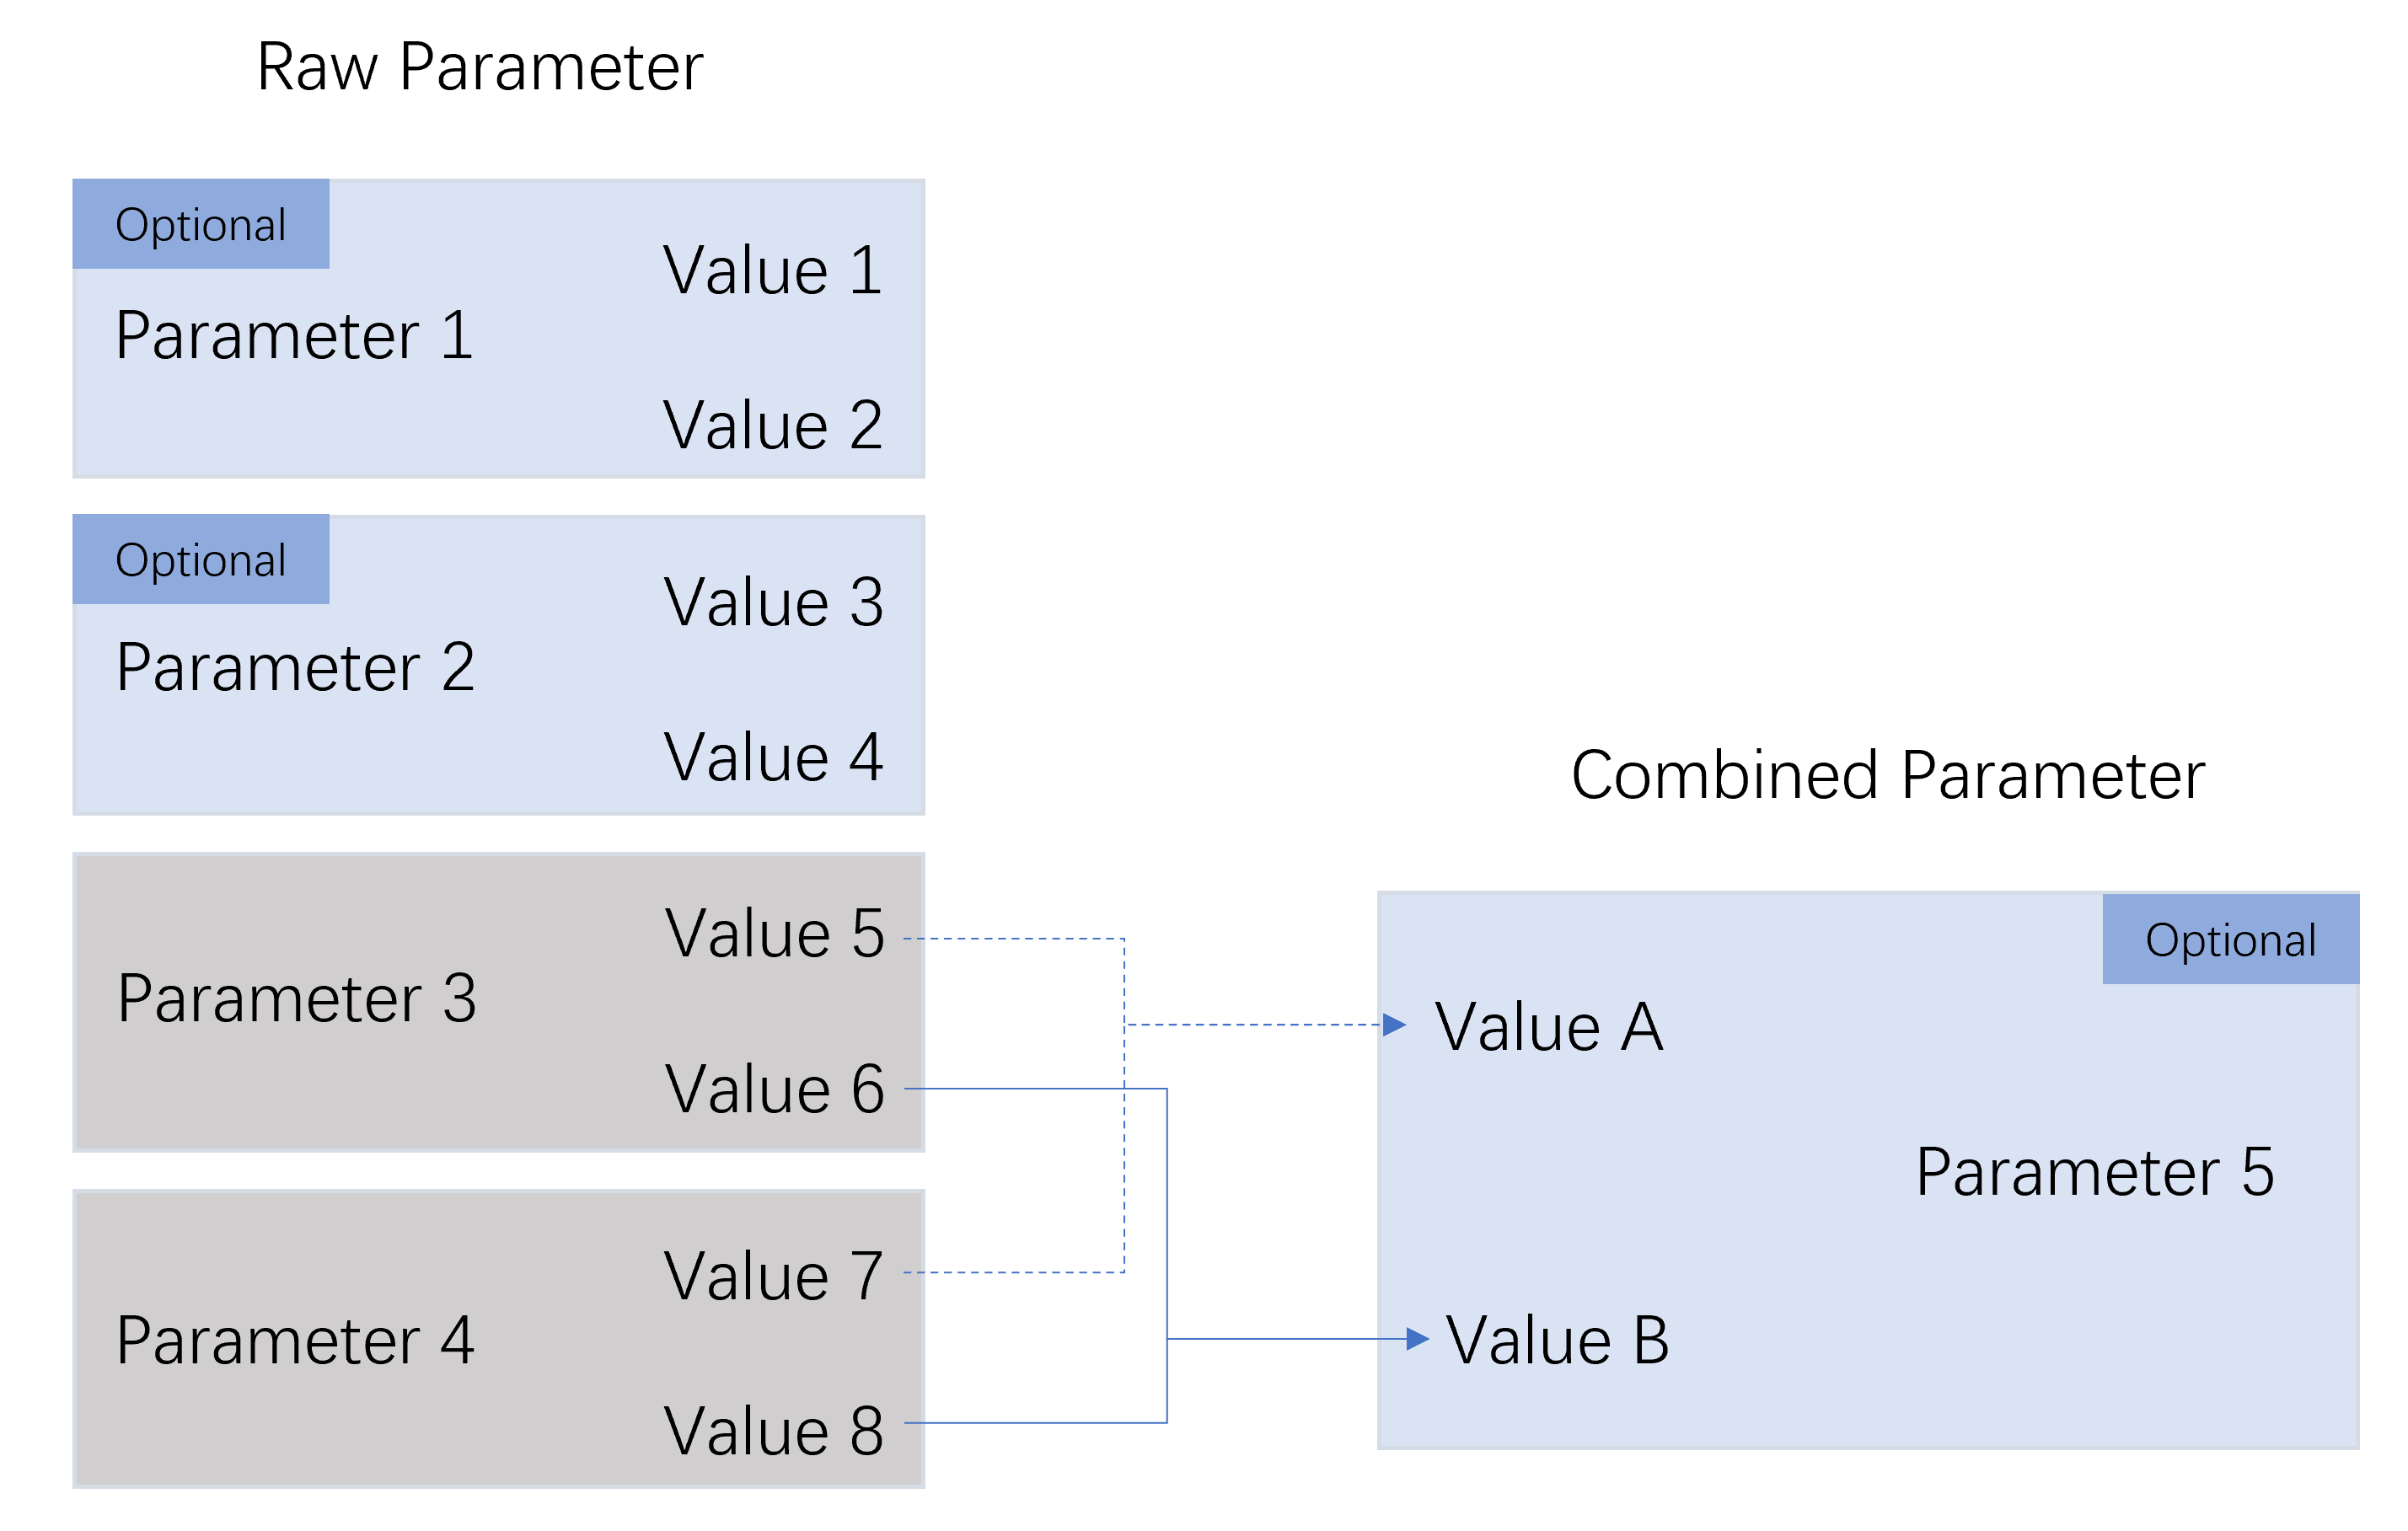
Original parameters: The request parameters that come with the data source, which can be directly selected and used, such as parameters 1 and 2.
Combined parameters: New parameters formed by recombining the values of the original parameters, such as parameter 5. When you create a value for a combined parameter, you can define the relationship between the combined parameter value and the original parameter values, for example, combined parameter A = original parameter 5 + original parameter 7. The original parameters that participate in forming the combined parameter cannot be used directly.
Return Structure
The return structure is the parameters returned by the data source after the widgets of a page request data. Defining the return structure will affect the data item selection range of dimension, comparison, measurement (metric), expansion, and other items in the widget.
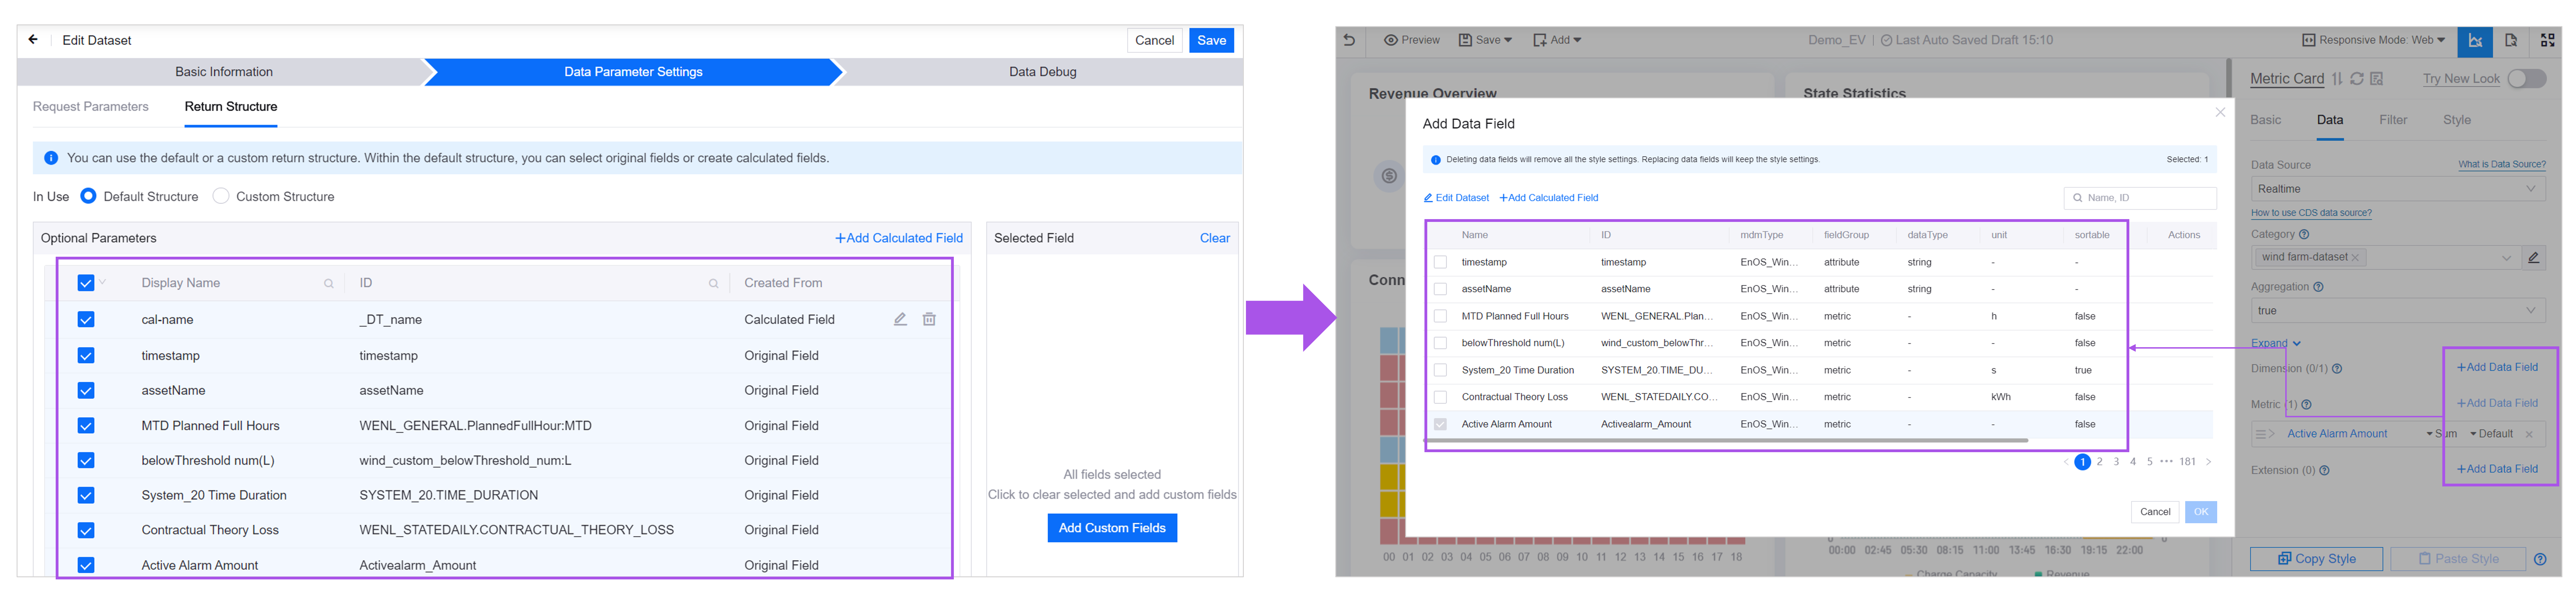
According to the source of the structure, the return structure can be divided into:
Default structure: The default return structure in the data source. The fields in the default structure can be divided into the following two types:
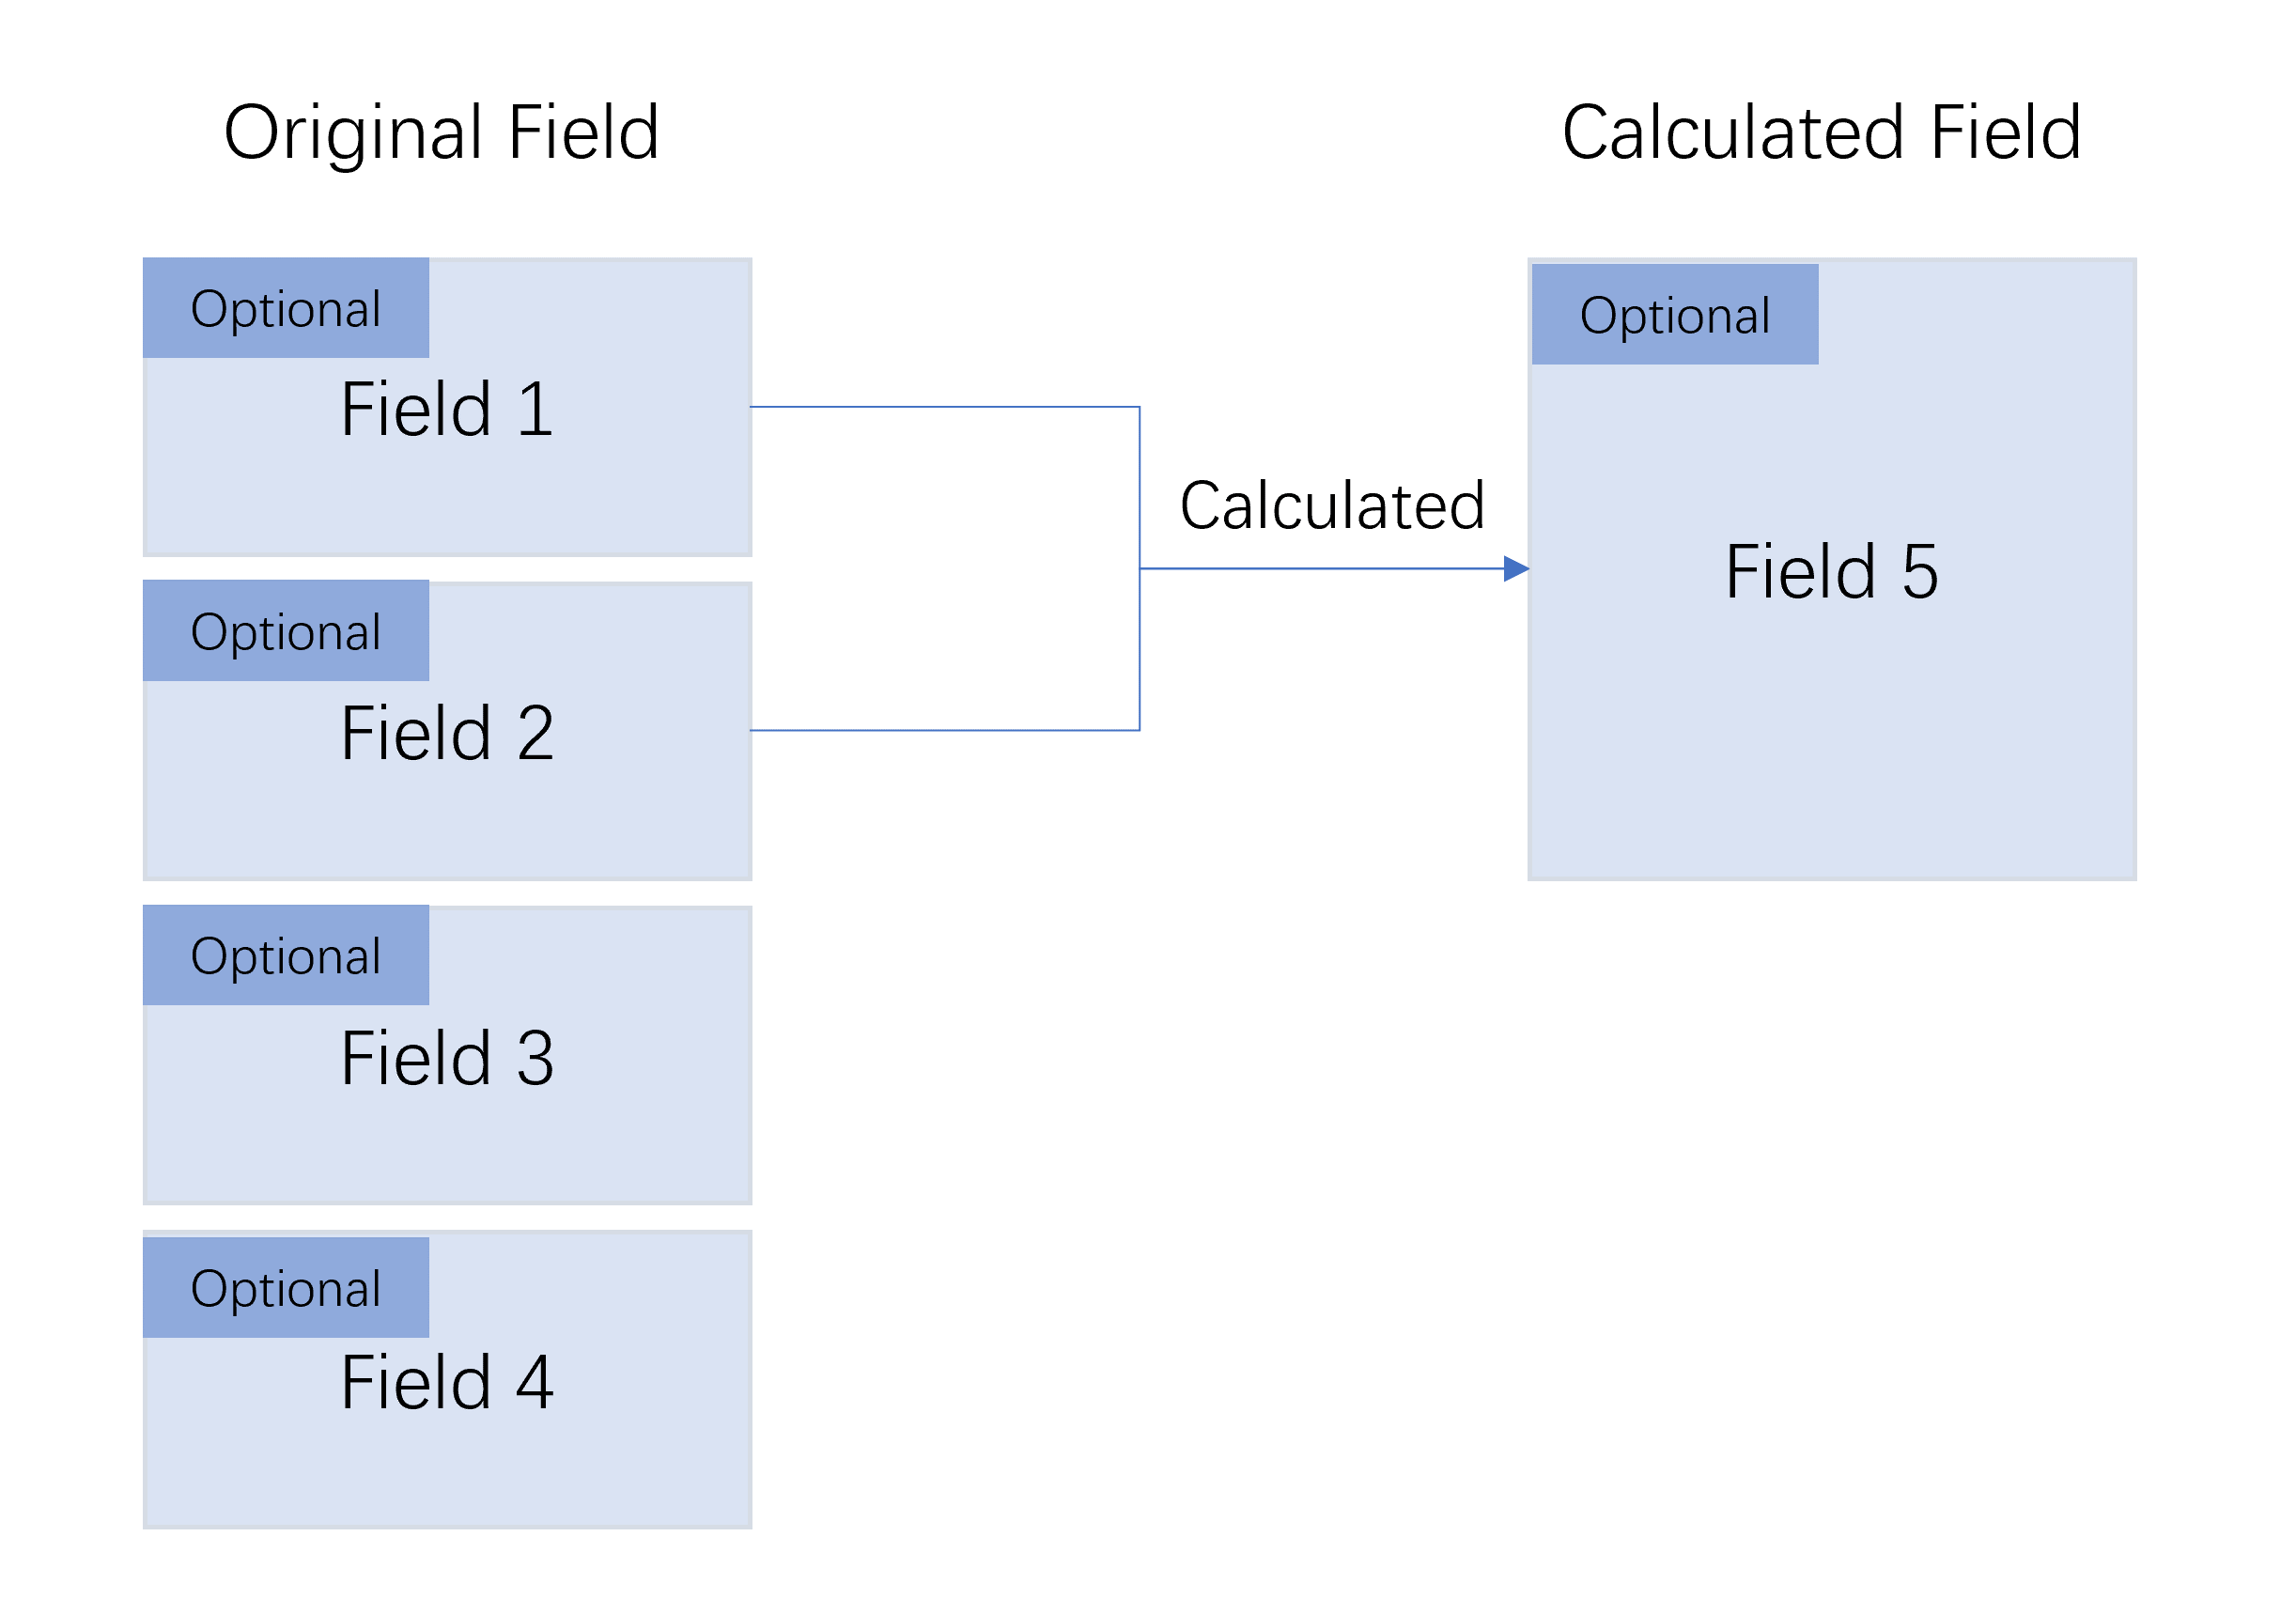
Original fields: The return fields that come with the data source, which can be directly selected and used, such as fields 1 - 4.
Calculated fields: New fields formed by writing JavaScript scripts to perform simple calculations such as sum and average on the original fields. For example, field 5 is calculated from field 1 and field 2. The original fields that participate in forming the calculated field can still be directly selected and used.
Custom structure: Select fields from the original fields or create new fields as parameters, and restructure the parameters by writing JavaScript scripts to form a custom structure.