3D Pie Chart
Note
The configuration panels of the two 3D pie chart types do not offer the new configuration panel, so this topic describes the current old panel.
A 3D pie chart shows the share each part takes in the total with a three-dimensional effect, giving a stronger visual impact than a flat pie chart. DTV provides two 3D pie chart types: 3D PieChart and Multi-Metric Pie Chart 3D.
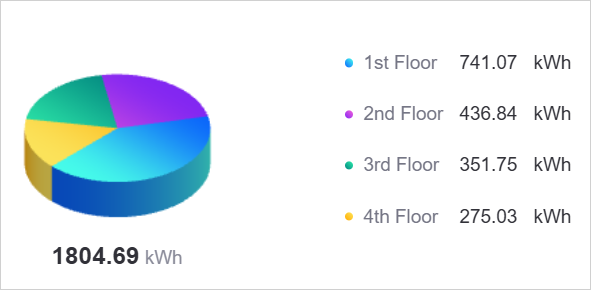
This topic describes the configuration items specific to the 3D pie chart. For the items common to all charts, such as the Basic tab and the Filter tab, see Common Configurations for Charts.
For the items shared with the ordinary pie chart (pie fill, chart format, ring to cutout ratio, data display format, chart to legend ratio, number of display data, legend, and so on), see Pie Chart.
Data of 3D Pie Chart
The data of a 3D pie chart is largely the same as that of an ordinary pie chart. The field constraints of the two 3D types are as follows.
For general information about data sources and data fields, see Common Configurations for Charts > Configuring Data.
3D PieChart
The 3D pie chart requires 1 dimension and 1 measurement; comparison fields are not supported. Dimension values determine the slice categories and measurement values determine the value and proportion of each slice.
Unlike the ordinary pie chart, the 3D pie chart accepts at most 1 measurement, so it does not produce several pie charts from several measurements and provides no Layout item. To compare several measurements, use the Multi-Metric Pie Chart 3D.
Multi-Metric Pie Chart 3D
The multi-metric 3D pie chart needs no dimension field and suits data that has no dimension for splitting slices but several measurements to compare. Once several measurements are added, the chart generates the slices from their values.
Unit
The units of a 3D pie chart are configured per data field on the Data tab. The meaning of each item matches the ordinary pie chart. See Pie Chart > Unit.
There are two differences from the ordinary pie chart:
Neither 3D type provides Set as Global Unit; that item is only provided by the Multi-Metric Pie Chart and the Stacked Progress Bar.
The Style tab of the two 3D types has never provided a unit name or dynamic unit item, and the unit always comes from the data field settings, so there is no legacy configuration to migrate.
Style of 3D Pie Chart
The Style tab organizes the configuration items in the order Title, Widget, Pie Chart, and Legend.
For common styles such as the title, widget padding, and background color, see Common Configurations for Charts > Configuring Style.
For the items in each section that are shared with the ordinary pie chart (pie fill, data display format, number of display data, legend name length, chart format, ring to cutout ratio, legend, and so on), see Style of Pie Chart.
Pie Radius
Pie Radius expresses the relative size of the pie chart within the widget as a percentage, from 0 to 100, with a default of 65 when empty. Adjusting the radius changes the drawing area of the chart.
Pie Radius is specific to the 3D pie chart; the ordinary pie chart does not provide it.
Pie Height
Pie Height controls the three-dimensional depth of the chart in pixels, with a default of 25 when empty. A larger height produces a stronger 3D effect.
Color JSON
Note
Color JSON is supported only by the 3D PieChart, not by the multi-metric 3D pie chart. The Multi-Metric Pie Chart 3D sets a Color per measurement in Metric Style instead.
When Pie Fill is Solid, only the first color of each inner array takes effect; for a gradient, set Pie Fill to Gradient. For a detailed description, see Common Configurations for Charts > Color JSON.
Pie Chart Background Image
Pie Chart Background Image selects a background image for the area holding the pie chart, from the asset library, which strengthens the visual effect on large screens. This item is specific to the 3D pie chart; the ordinary pie chart does not provide it.
Summary Area
Summary Area is the data display area at the center of the 3D pie chart. Unlike the ordinary pie chart, its options are Show Value and None (the ordinary pie chart offers Show Value and Show Icon), so a 3D pie chart cannot place an icon at the center.
With Show Value selected, you can configure Value Font, Unit Font, and Show Unit in New Line. See Pie Chart > Summary Area.
With None selected, the center area is empty and those three items are hidden.
The default is Show Value.
Metric Style
Metric Style is provided only by the Multi-Metric Pie Chart 3D. Once measurements are added, it produces one configuration card per measurement, and you can set a Color per card with solid and gradient colors supported. With no measurements, the section is hidden.
The Multi-Metric Pie Chart 3D uses Metric Style in place of the Color JSON of the 3D pie chart.
Legend Value-Unit Spacing
Legend Value-Unit Spacing controls the spacing between the value and the unit in the legend, in pixels. This item is hidden when Data Display Format is No Data. It is specific to the 3D pie chart; the ordinary pie chart provides only Legend Name-Value Spacing.
Interactions at Runtime
The two 3D pie chart types have far fewer runtime interactions than the ordinary pie chart, with just two:
Tooltip: Requires Show Tooltip to be selected. Hovering over a slice shows its category name, measurement name, value with unit, and share.
Legend paging: When the number of legend items exceeds the available space, previous and next page buttons appear in the legend area for browsing the rest. The corresponding button is disabled on the first or last page.
Note
The viewpoint of a 3D pie chart is fixed, and end users cannot rotate, zoom, or drag the solid figure. Selecting a legend item does not hide a slice either, so the percentages in the legend and the center summary value are always calculated from all the data. To filter data through the legend, use the Pie Chart instead.
Neither 3D type can act as a linkage source, and the slices are not clickable.