Application Enablement Platform
Note
Features marked with “(Preview)” are selective opt-in features that are ready for you to test and evaluate but not recommended for production use. Contact your sales representative if you are interested in a Preview feature.
In EnOS 2.3, we added new features and functions for Single Sign-on, Digital Twin Visualization, Business Process Management and Developer Studio services. See the following for more details.
Single Sign-on
The Single Sign-on service added support for displaying CAPTCHA images on client login pages. For more information, see Customize Client Login Page.
Business Process Management
BPM added a new form element, Time Range Picker, for users to select start and end date and time. For more information, see Time Range Picker.
Digital Twin Visualization
Data Sources
Added the following types of data sources:
Static Data: A fixed set of data tables that do not change over time. You can define the datasets that you want to use by uploading CSV files.
Data Federation: The EnOS Data Federation service, which provides a unified data access layer for distributed data sources. You can define the dataset that you want to use in DTV through SQL queries, and even define custom variables to use in the SQL queries. This enables you to perform similar queries without the need to create repeating datasets and SQL queries.
Common Data Service: The EnOS Common Data Service, which provides access to EnOS data such as cross-domain KPIs, metrics, measurements, alarm data, and more. As this is a built-in data source, you can enable and use it immediately without additional configuration.
Added metadata cache and data cache settings to determine how frequent DTV should clear the cache.
For more information, see Configuring Data Sources.
Workspace Authentication
DTV management console added Workspace authentication function, users with access token can configure and manage their own workspaces. This includes uploading, downloading, and deleting of custom widgets in the workspace. For more information, see Creating Workspaces。
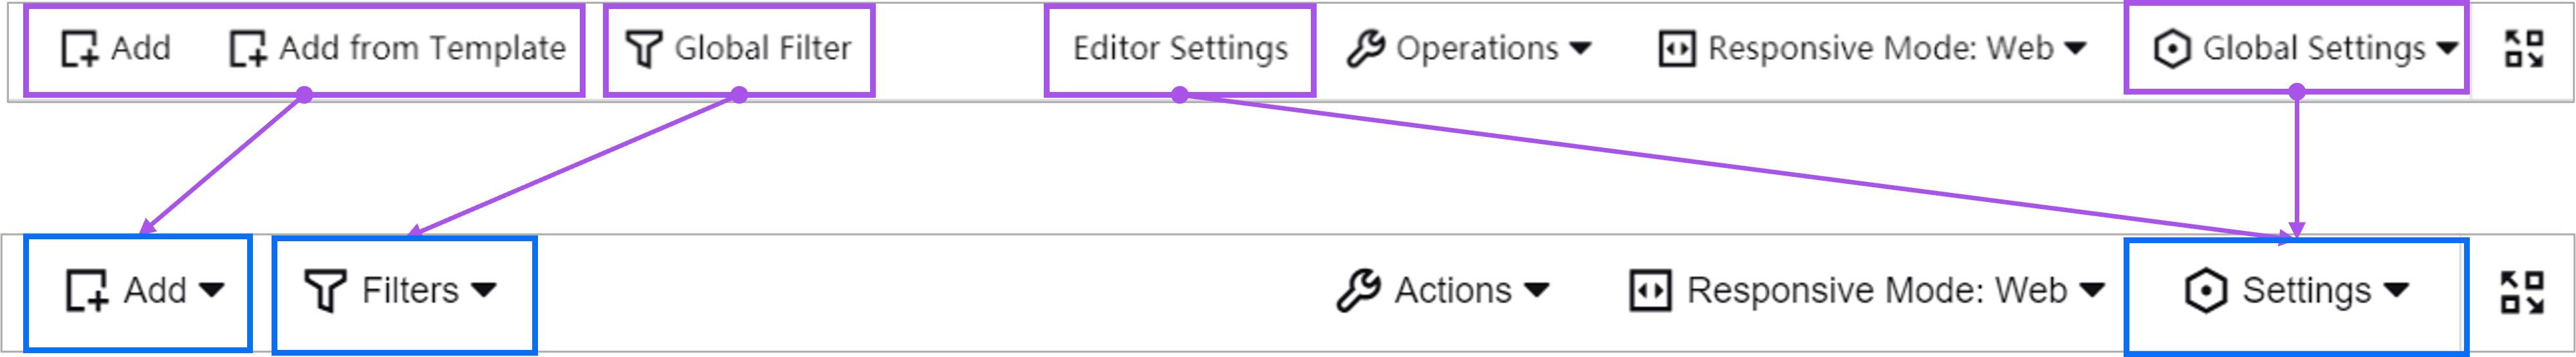
Page Editor
Reorganized the toolbar for better usability and to house more functions.
Added Background Fill in Page Settings to determine how a background image is displayed.
For more information, see Exploring the Dashboard Editor.
Chart Editor
Added new features to improve user experience.
Maximize Widget,a new function in the published dashboard to view widgets in full screen size.
Export CSV Data,a new function in the published dashboard for users to download widget data in CSV format.
Refresh Data,a new function in the toolbar to display the updated calculated fields.
For more information, see Exploring the Dashboard Editor and Configuring Widgets.
Filters
DTV now offers three variants of filters, operating in different scopes.
Enhanced the Global Filter as follows:
Added more filter types: Multi-Select Dropdown, Single-Select Dropdown, Tag, Time, Textbox
Enabled linking of data sources
Enabled inclusion or exclusion of widgets
Enabled creation of page parameters that you can append to a dashboard URL, or use in widget titles, rich text, or calculated fields to display dynamic data.
Added the following filters:
Widget Filter, to enable users to filter data in multiple linked widgets on the same page
Internal Filter, to enable users to filter data within a single widget based on specified criteria
For more information, see Adding Filters.
Published Pages
After you have published your dashboard, you can now specify the following page properties by using URL parameters:
Display mode: Specify whether to display the page in Big Panel, Web, or Mobile mode by default.
Page parameter: Specify a specific value for page parameters defined in the Global Filter.
Time zone: Convert time data from one time zone to another
For more information, see Publishing Dashboard Pages.
New Widgets
Added a new selection of widgets to cater to more visualization needs.
Widget |
Description |
|---|---|
Used to display progress towards a goal in the form of bars. |
|
Used to display a single measurement data on multiple cards. |
|
Used to display progress towards a goal in the form of liquid levels. |
|
Used to display multiple measurement data on a multiple cards. |
|
Used to display progress towards a goal and multiple measurement data in a chart. |
|
Used to display external content, such as a webpage. |
|
Used to display different data values in different colored cells. |
|
Used to display alarm messages in a compact format. |
|
Used to display information in a hierarchical structure. It is generally used to monitor connected assets of a site. |
|
Used to group widgets and organize widgets into tabs. |
Existing Widgets
Enhanced existing widgets for better usability.
Widget |
Enhancements |
|---|---|
|
|
|
|
Added formatting rules to enable dynamic changing of text color depending on its measurement data. |
Developer Studio
DevOps
Homepage
Add Developer Homepage, including announcements, recent visits, my apps, easy for developers to quickly find target features.
For more information, see Developer Studio - Homepage.
Project
Provides ephemeral-storage quotas and supports configuration of cluster environment properties.
Provide network policy management, default network access isolation between projects, configure network policy to increase access whitelist open cross-project network access.
For more information, see Managing Projects.
Product
Support product hierarchy management to facilitate the management of products composed of multiple applications.
For more information, see Managing Products.
Application Management
Optimize developer app list view interaction, optimize app downlink logic.
For more information, see Management Applications.
Pipeline
Provide statistical reports on the operation of the pipelines.
Supports Chart generation pipeline tasks to package Kubernetes resources from multiple applications under the same product into Chart packages for Helm deployments.
Support tag creation, after the application image verification, you can directly tag the image and source code in the pipeline.
For more information, see Managing Pipeline.
Toolkit
Github integration is supported.
Helm Chart Publishing
Support Chart version display and download function, support dry run operation, support Chart deployment failure to rollback.
For more information, see Publishing Applications with Helm Chart.
Log Service
Support for creating log metrics and monitoring and alerting can be set based on log metrics.
For more information, see Creating Log Indicator.
Monitoring
Graphical presentation of application monitoring metrics in different environments,Adding Event Monitoring Dashboard and Log Monitoring Dashboard.
Support creating different types of alert rules.
Support users to receive alarm event notifications and view generated alarm events and history.
For more information, see Enabling Application Monitoring.
App Hub
Template
Show application template developer information, support Chinese name application.
Multiple clusters can be specified cluster shelves, providing audit function.
Supports direct submission to the shelf after Chart generation via pipeline.
For more information, see Managing Application Templates.
Publish
Provide application instance lifecycle management function for application store deployment, support instance upgrade and uninstallation.
For more information, see Deployment Application Instance.
Canary Deployment
Provide Canary Deployment function to deploy old and new versions of application templates at the same time, and manage access traffic of different versions through different ways such as random traffic and request Header matching. Switch in time when there is a problem with the version to reduce upgrade and release risks
For more information, see Deploying Application Instances through Canary Deployment.