Common Widget Settings
All widgets have the same fields for Basic Information and Data Fields sections.
Basic Information
Basic Options
Field |
Description |
|---|---|
Title |
Specify the default title for the widget. Supports Internationalization. |
Hide Title |
Select this to hide the title |
Title Font [1] |
Style the title label |
Link Type |
Select where to redirect the user when the title is clicked. Read more in Title Link. |
Description |
Write a short description about the widget |
Title Link
You can set the title of the widget to be a hyperlink. A title link is indicated by the right arrow  next to the title.
You can set a title link by selecting from the Link Type list:
No Link: The title is a normal text label.
Link URL: Redirects the user to a specified URL. You can specify the URL in the Title URL box.
Application Portal: Redirects the user to the menu of an application by specifying the App Identifier, Menu Identifier, and App Status fields.
Note
If no URL is specified when the link type selected is Link URL or Application Portal, the user is redirected back to the dashboard.
Other Options
Field |
Description |
|---|---|
Refresh Frequency |
Select how frequent the widget should refresh and retrieve data from data sources |
Allow Data Export |
Select this to enable users to download the displayed data in CSV format |
Chart Padding |
Specify the respective spacing within the widget |
Background Color [2] |
Select a background color for the widget |
Title Decoration [2] |
Select how you want to decorate the title |
Top Decorative Line [2] |
Add a decorative line for the top boundary of the container |
Bottom Decorative Line [2] |
Add a decorative line for the bottom boundary of the container |
Data Fields
Field |
Description |
|---|---|
Data Source |
Select the data source. |
Category |
Select the data category that you want to display. |
Aggregation |
Select if you want to use the raw data, or the aggregated data. See Aggregation. |
Dimension, Comparison, Measurement |
Select the data fields according to the chosen widget. Required quantities of data fields for each widget can differ. For more information, see the reference page of the respective widgets |
Alias |
Add an alternative display text for dimension, comparison and measurement fields in the chart. |
Depending on how the data source was configured in the backend, there may be additional optional parameters that you can configure.
Note
If you change the data source or the category, the current data fields will become irrelevant. You can replace them to retain the chart style, or remove them completely to reconfigure the chart style from scratch.
If you change an existing chart to a new chart type that is incompatible with the existing data fields, then all the data fields will be reset. You will need to configure them again. For example, if dimension fields were selected and you changed the chart type to the Donut Gauge type (which does not use dimension fields), all the data fields will be reset.
Data Source Specific Configuration
Common Data Service
For a data source under Common Data Service, you can select multiple categories and specify the asset ID. DTV will obtain data that matches both the selected categories and the asset ID.
If the asset ID is a parent asset, the selected categories represent the child assets.
DTV will obtain data of the selected child assets under the specified asset ID.If the asset ID is not a parent asset, it simply acts as a filter.
DTV will obtain data that matches both the selected categories and the asset ID. For example, if you select categoriesWind Farm AandWind Farm B, and specify the ID ofWind Farm Ain the asset ID, DTV will only obtain data ofWind Farm A.
Sorting Data Fields
For the dimension and comparison data fields that you have selected, you can choose the order they are displayed on the chart.
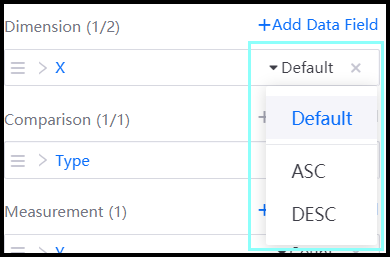
The available options are:
Default: Display in the same order as the original data
ASC: Display in ascending order
DESC: Display in descending order
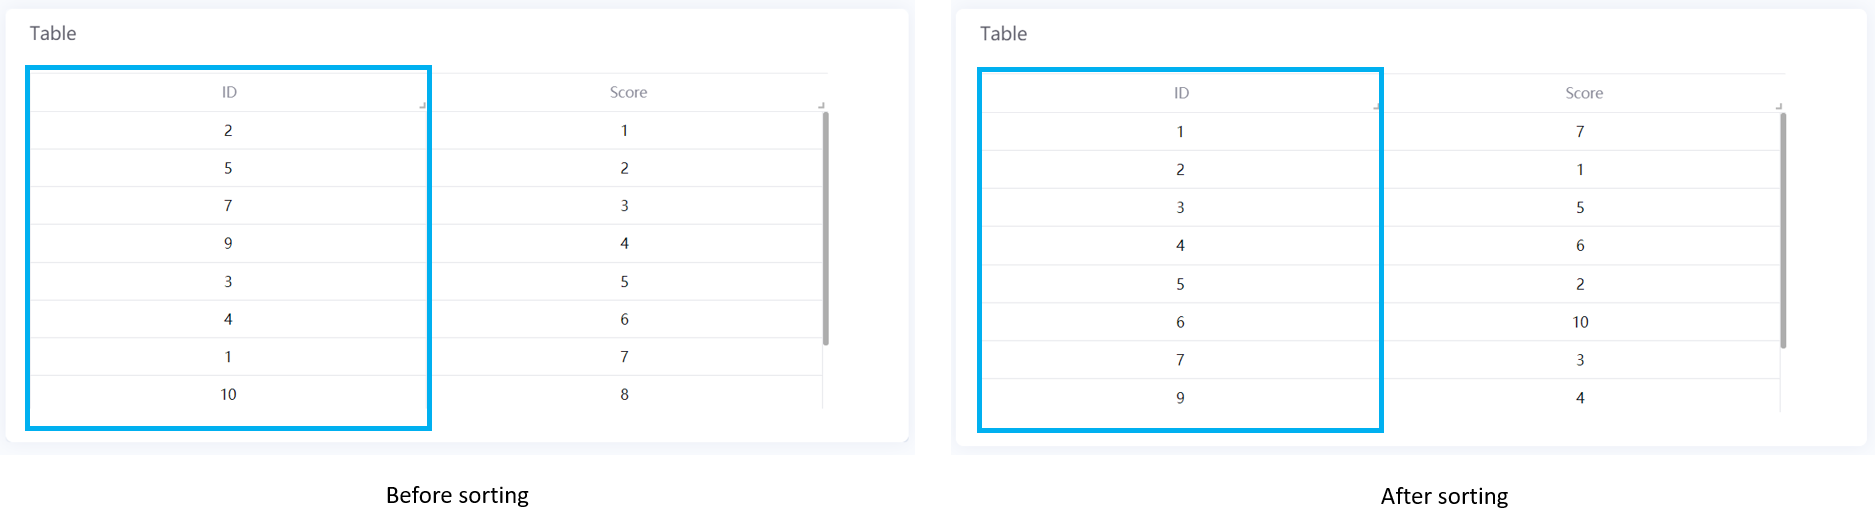
In the example below, we have selected ID as the Dimension field. Selecting ASC for the ID field displays its data values in the ascending order.
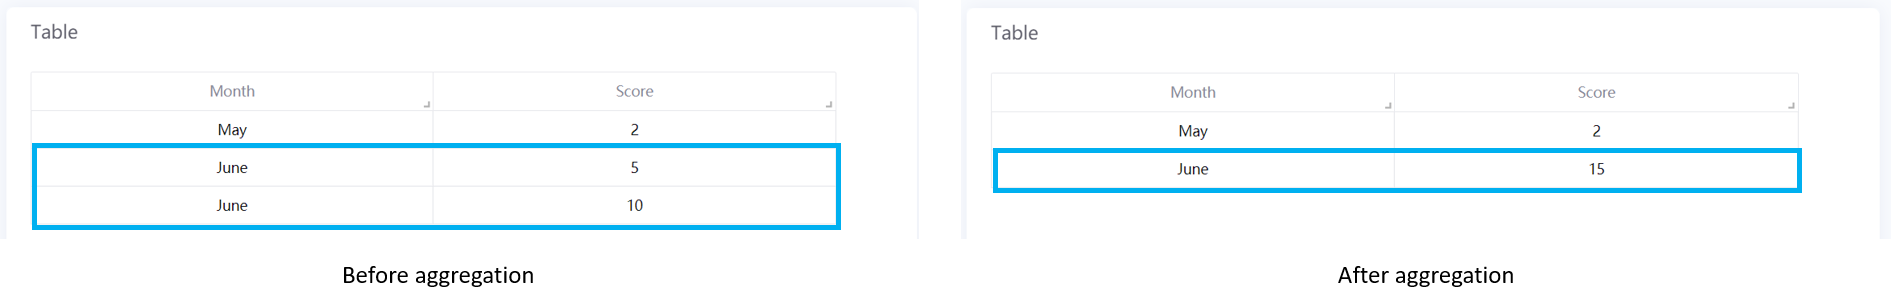
Aggregation
You can aggregate measurement data values that have the same dimension and comparison data values. If no dimension and comparison data fields are selected, then measurement values of the same field are simply aggregated and returned as a single value.
For example, the Month June has two records, 5 and 10. After selecting Aggregation with the function Sum, the two values are added together and displayed as 15.
DTV supports the following functions for aggregation:
Function |
Description |
|---|---|
Sum |
Returns the unweighted sum of measurement values |
Average |
Returns the average of measurement values |
Effective Average |
Returns the average of non-empty measurement values. For example, if there are 10 values, of which 6 are non-empty, the effective average returns the average value of the 6 non-empty values (whereas the average function would return average of all 10 values). |
Max |
Returns the largest measurement value |
Min |
Returns the smallest measurement value |
First |
Returns the first measurement value |
Last |
Returns the last measurement value |
Count |
Returns the number of measurement values |
Distinct Count |
Returns the number of unique measurement values |