Pie Chart
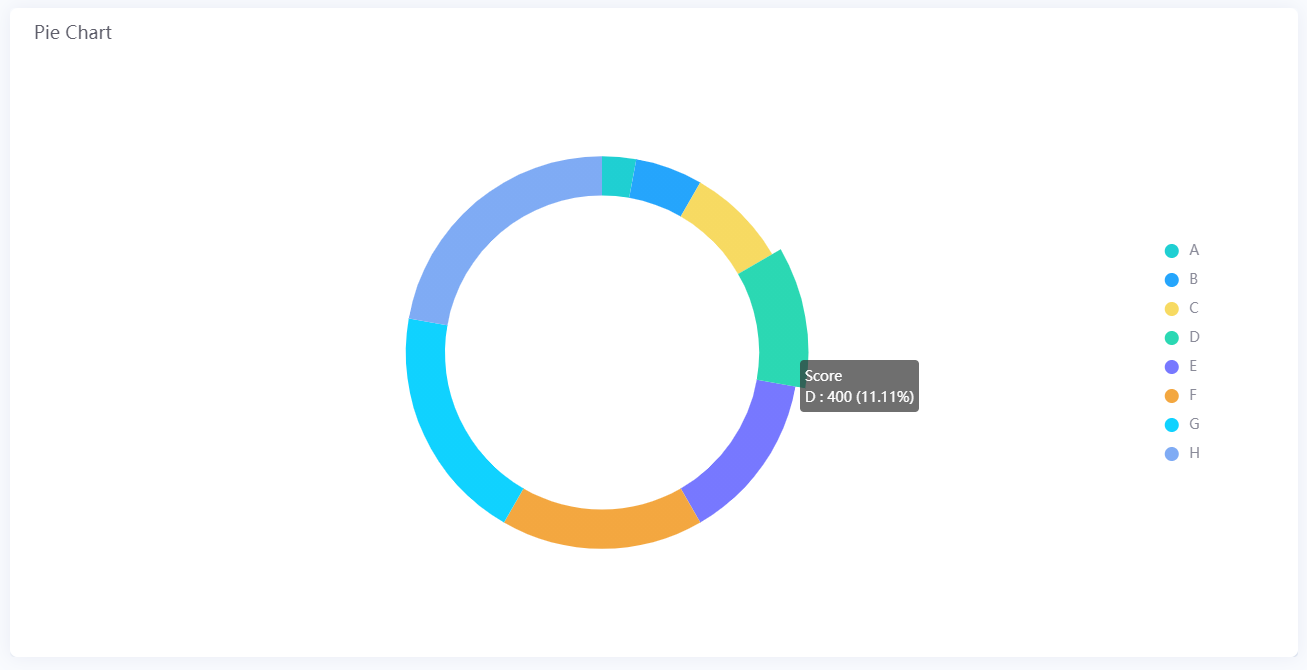
The pie chart widget is used to compare data between a single data series, showing the proportion of each value to the total, and the total proportion can only be 100%.
Data Fields
The data fields required are:
Field |
Quantity |
|---|---|
Dimension |
1 |
Measurement |
1 |
Chart Style
Pie Chart Style
Pie Settings
Field |
Description |
|---|---|
Use Gradient [1] |
Select this to fill the pie chart with a gradient |
Use Donut |
Select this to display the pie chart as a donut |
Weight |
Specify the thickness of the pie chart when it is displayed as a donut |
Value Font [1] |
Style the value labels |
Decimal Places |
Round up the displayed chart data to the specified decimal places |
Unit Name |
Specify the unit for chart data. |
Dynamic Unit |
Select this to automatically use the unit that suits your data values. |
Unit Font [1] |
Style the unit labels |
Line Break |
Select this to display the unit below the value |
Legend
Field |
Description |
|---|---|
Position |
Select the position of the legend |
Size [2] |
Specify the radii of the legend dots and the vertical spacing between them |
Legend Font [2] |
Style the text labels in the legend |
Show Legend Value |
Select this to show the values on the legend |
Value Font [2] |
Style the value labels |
Unit Font [2] |
Style the unit labels |
Value Margin |
Specify the spacing between the value and the text labels in the legend |
Data Label
Field |
Description |
|---|---|
Font [3] |
Style the Dimension labels |
Position |
Select where the Dimension labels are positioned relative to the pie chart |