Key Concepts
Container
Containers enable you to group widgets and even organize widgets into tabs.
You can use containers when you want to:
Keep widgets that display related information together
Display different types of widget in the same page area by using tabs
Structure your page
As such, using containers is a great way to keep the dashboard clean and easy to use.
For information, see Grouping Widgets Using Containers.
Dashboard
The dashboard is a data visualization page that is formed by arranging multiple charts in accordance with certain business logic. It can be used for information display, data analysis, and monitoring and early warning.
Data Aggregation
Data aggregation enables you to aggregate your measurement data quickly without the need to write SQL queries. The aggregation is performed according to the selected Dimension field and the selected aggregation function. If no Dimension field is selected, then all measurement data will simply be aggregated into a single value.
Data Fields
In DTV, you can assign your data fields to a particular data type, which will affect how your data is displayed on widgets.
Measurements are quantitative data fields that you can measure, usually containing numeric values that could be aggregated.
Dimensions are data fields that produce corresponding measurement values. Dimensions can be discrete (such as country and name), or continuous (such as time) values.
Comparisons enable you to further differentiate the data into multiple layers, so that you can compare many sets of data with the same dimension data values.
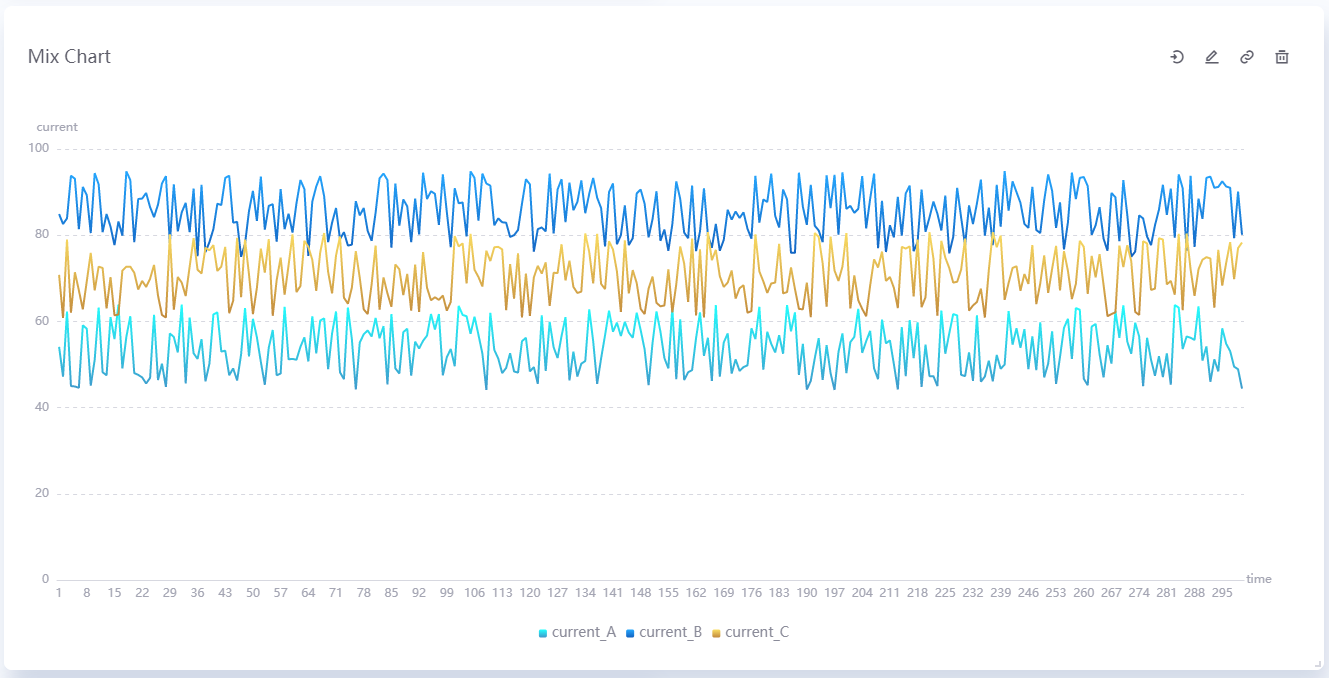
A typical scenario is plotting a trendline. Often, the Dimension field is time. As time passes, one or more variables could be measured. As such, the Measurement fields could be current, voltage, or capacity. If you have multiple devices, you can plot multiple charts on the same widget by setting device_name as the Comparison field, for example.
The graph below plots electrical current data (Measurement) against time (Dimension), with the type of device as comparison.
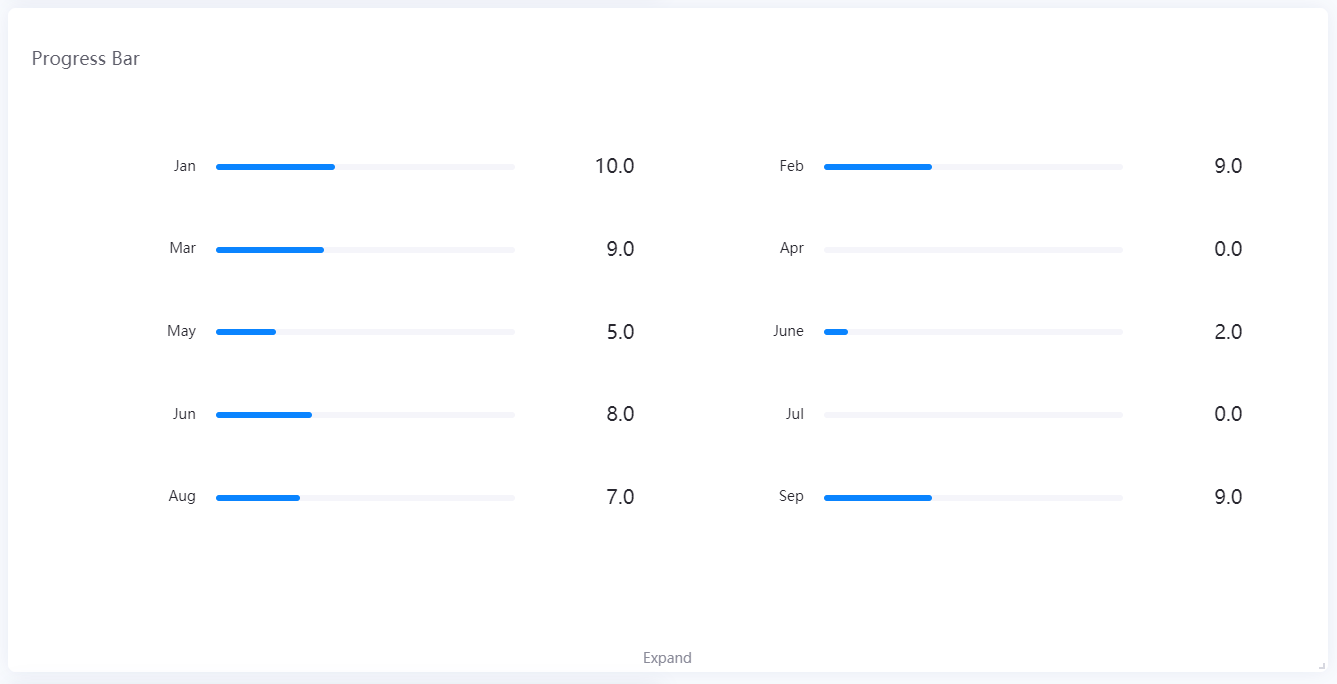
Another scenario is displaying indicator or progress values. The Measurement fields could be score, progress percentage, and remaining time. Similarly, if you have multiple processes, you can plot their charts by setting process_name as the Comparison field, for example.
A simple rule of thumb is that DTV displays Dimensions as rows/X-axis, Measurements as columns/Y-axis, and Comparisons as multiple charts on the same widget.
Data Source
A data source connects your dashboard to a data collection such as database, an uploaded CSV file, measurement point data from physical devices, or time series data from stream processing engines.
EnOS DTV supports displaying of visualization pages from multiple data sources. You can display data from EnOS Cloud through TSDB, Common Data Service, Data Federation, or display any sources of data through APIs or MySQL.
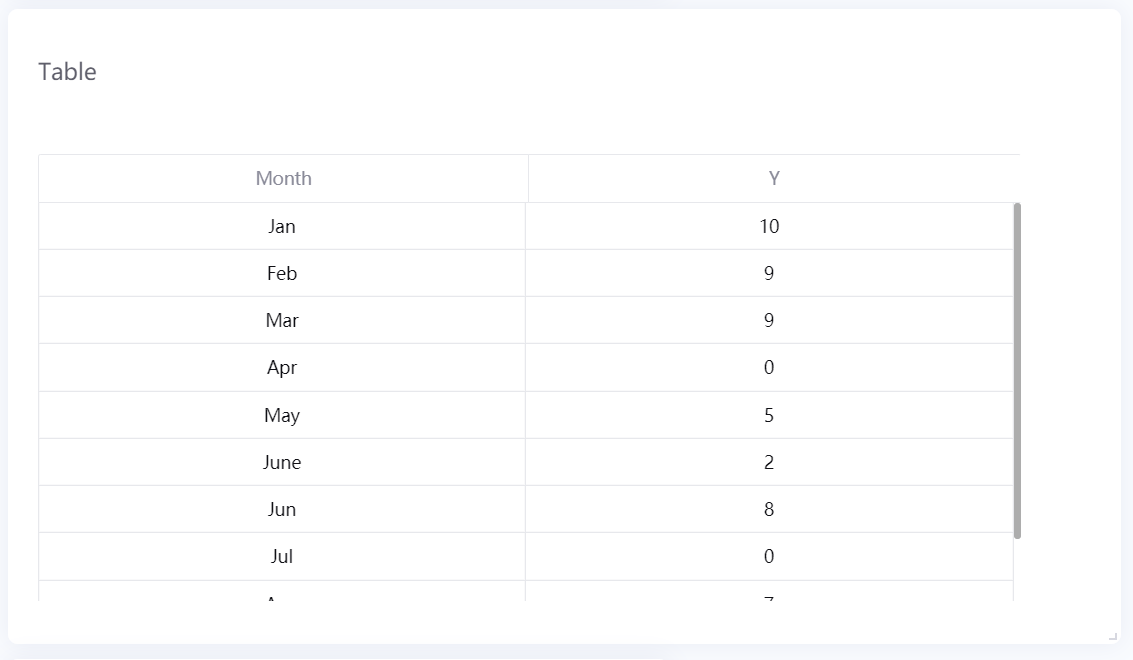
A typical representation of the data obtained from the data source is a table containing many rows of data.
For more information, see Data Sources.
Dynamic Unit
Dynamic units shorten long data values by using the most appropriate unit. For example, if the value is 1,000,000 W, it will be converted to 1 MW.
Filter
Filters are powerful tools that enable users to filter numerical and time data in their widgets.
There are three types of filters, operating in different scopes:
Global filter: Filters data in all the widgets on the same page
Widget filter: Filters data in multiple linked widgets on the same page
Internal filter: Filters data within a single widget
Formatting Rules
With formatting rules, you can configure the widget to change the color of its value or widget, depending on the value of the measurement data. For example, you can configure the widget to display blue when the measurement value is between 10 and 30, and red when it is between 30 and 50.
For more information, see Setting Formatting Rules.
Internationalization
You can display titles in the different languages supported by Application Portal. The default value is displayed if DTV cannot find a title that corresponds to the language selected in Application Portal.
For more information, see Supported Languages.
Workspace
Workspaces enable you to create well encapsulated DTV environments.
This means that workspaces are isolated from one another to ensure information security. Users assigned to one workspace cannot use resources from other workspaces. Similarly, data information in one workspace cannot be used in another workspace. Moreover, you can specify different authentication methods in different workspaces based on your business requirements.
For more information, see Creating Workspaces.
Page
Page is a short name for the dashboard page.
Page Parameters
Page parameters are self-defined parameters that you can append to a dashboard URL to display dynamic data. For more information, see Configuring Page Parameters
Project
A project is a workspace that holds all the pages you have created.
Static Data
Static data is data that do not change over time. Charts that display static data will remain unchanged, providing a consistent visualization of data.
Time Zone Conversion
You can convert time data in the dashboard from one time zone to another by specifying the _tz_ page parameter in the dashboard URL. It enables users to convert the data to their browser time zone, ignore the time zone, or convert to their specified time zone.
For more information, see Time Zone.
Widget
The content shown in the dashboard is displayed through one or more widgets, which contain charts. You can define the number of widgets and the content to be displayed in the dashboard according to your business requirements. DTV provides a set of rich and artistic widgets to help you display and analyze data in the most appropriate way.
Widget Link
Widget links enable users to dynamically change the data displayed in multiple widgets based on the Dimension field of a source widget. For example, you can link a table to a mix chart to show only data corresponding to the Dimension field selected in the mix chart.
For more information, see Configuring Widget Links.
Widget Template
The widget template is formed by the determined widget types, selected data items, and determined widget configurations, which can be used to quickly create data monitoring and analysis pages.
For more information, see Widget Template.