Configuring Widgets
Other than displaying measured data in various charts with different styles, you can configure charts to:
Use calculated fields
Change color depending on data values
Export data as CSV
Maximize and minimize widgets
Configuring Calculated Fields
Adding Calculated Fields
You can add a new calculated field by following these steps:
In the Edit Chart window, navigate to Data Fields.
Click Add Data Field.
Click Add Calculated Field.
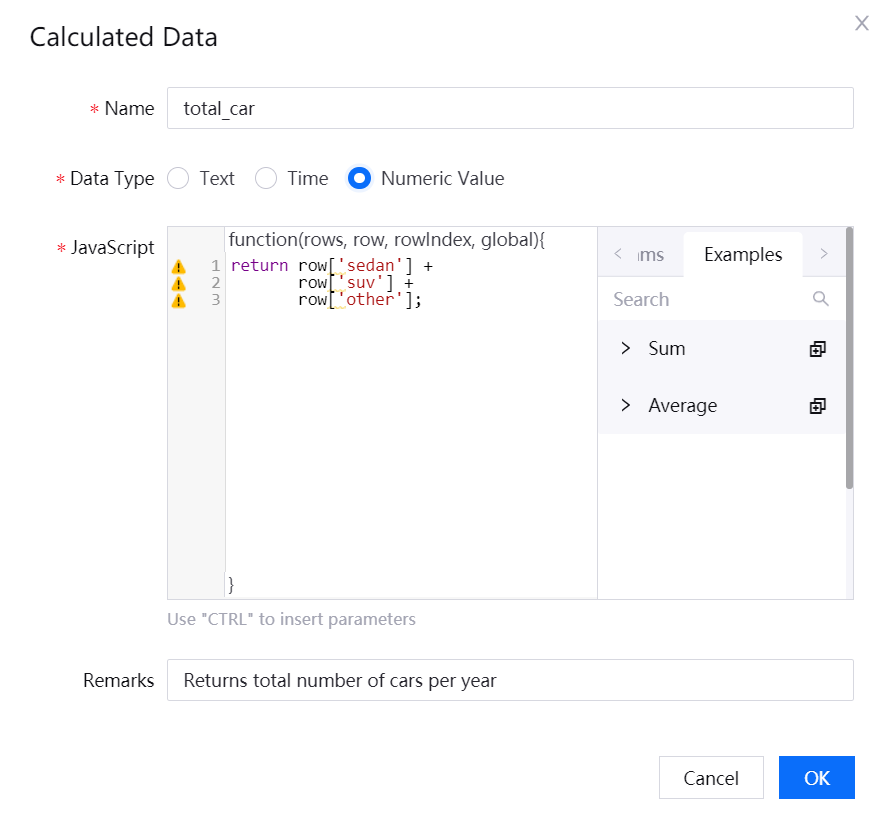
The Calculated Data dialog appears.In the Name box, specify a name for your new calculated field.
From the Data Type list, select the data type for the calculated field so that Javascript knows how to return its value.
In the Javascript field, write your Javascript function body.
Some examples and all the names of the fields and parameters are provided in the right panel.
In the Remarks box, you can write some comments or a description for your new calculated field.
Click OK.
Editing a Calculated Field
You can make changes to an existing calculated field by following these steps:
In the Edit Chart window, navigate to Data Fields.
Click Add Data Field or the name of an existing data field.
Locate the calculated field to be modified.
In the Actions column of the calculated field, select Edit
 .
.Click Save.
Note
To reflect the changes on the chart, click Refresh Data on the toolbar.
Setting Formatting Rules
In some widgets, you can configure it to change color depending on its measurement data. This enables users to quickly notice anomalies or critical values.
Only these widgets support formatting rules:
Donut Gauge
Meter Gauge
Progress Bar
Indicator Card
Liquid Fill
Metric Card
Mix Gauge
Table
Rich Text
You can set formatting rules by following these steps:
Navigate to Chart Style > Measurement Style > Formatting Rules.
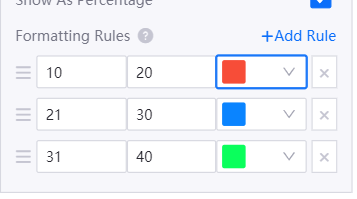
Click Add to add a formatting rule. A row of empty fields appear.
The first and second box define the minimum and maximum values that satisfy the formatting rule respectively.
In the third box, pick the color you want to display when the formatting rule is satisfied.
The changes made will be reflected on the chart automatically.
Note
When you have multiple conflicting formatting rules, the topmost rule will take precedence. You can change their order by dragging them up/down through the hamburger icon.
Configuring Widget Links
Widget links enable you to filter data in multiple widgets, using the Dimension field of a source widget.
Widget links are only supported for these widgets:
Pie Chart
Horizontal Bar Chart
Mix Chart
Heat Map
The following steps shows how to configure a widget link with a Mix Chart and Table as an example:
Add and configure a Mix Chart widget.
Add and configure a Table widget.
Move the cursor to the Mix Chart and click the Link icon in the upper right corner of the widget.
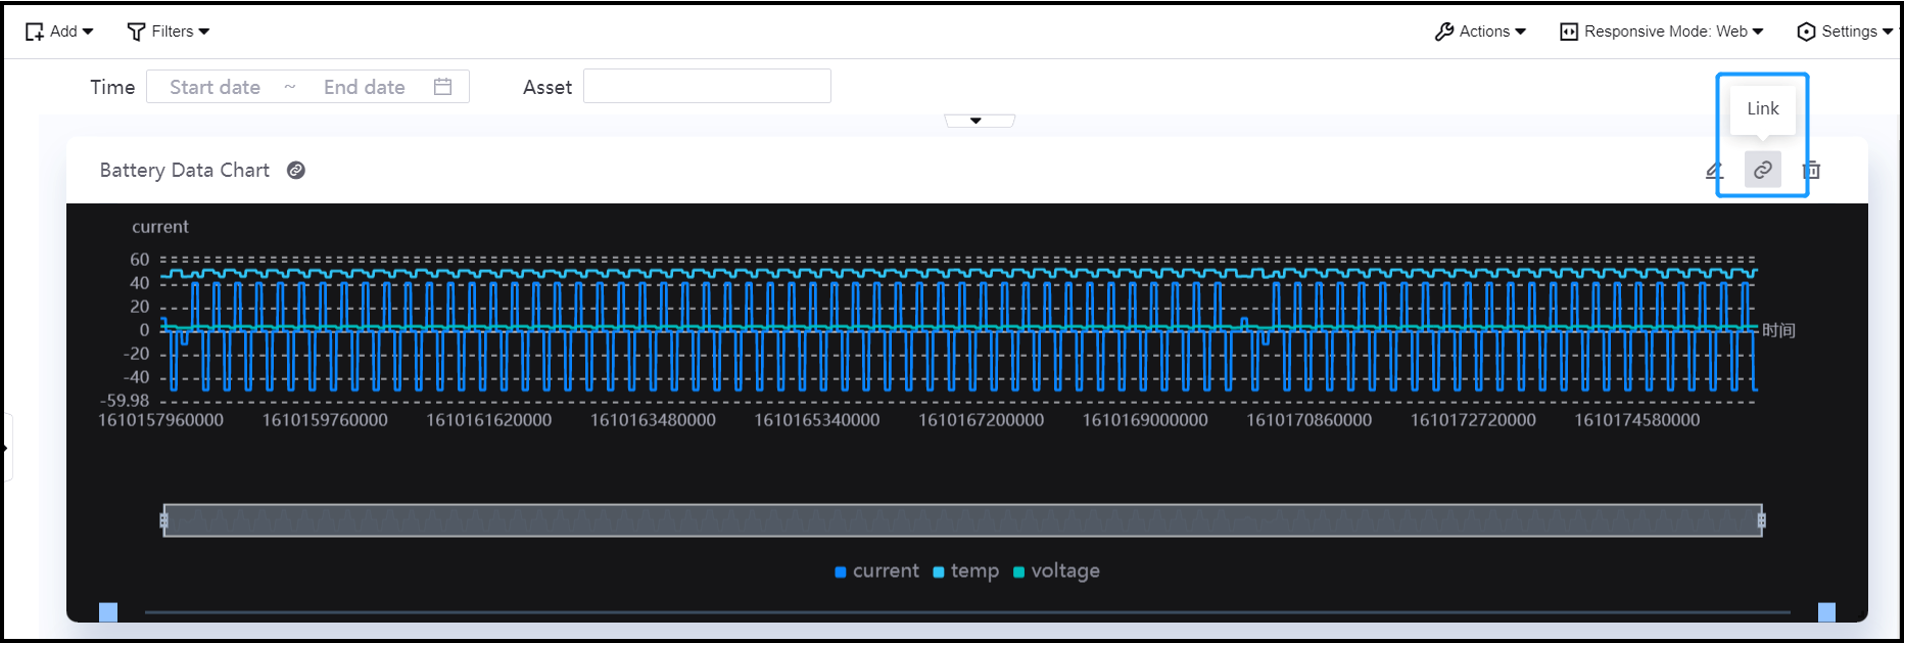
In the Link Widget pop-up window, select a dimension field as the driver dimension (in this case Time is selected) and select the data field of the target widget (Table widget) that you want to filter (in this case Time is the data to be filtered).
Note
The driver dimension is the data field that you can select on the chart. The value of the driver dimension will be used to filter the selected data fields of the target widget.
Click OK.
After configuring the widget link, click a time point in the Mix Chart. You will see that this time point will be used as the filtering condition for the table widget, where only data with the same time point will be shown.
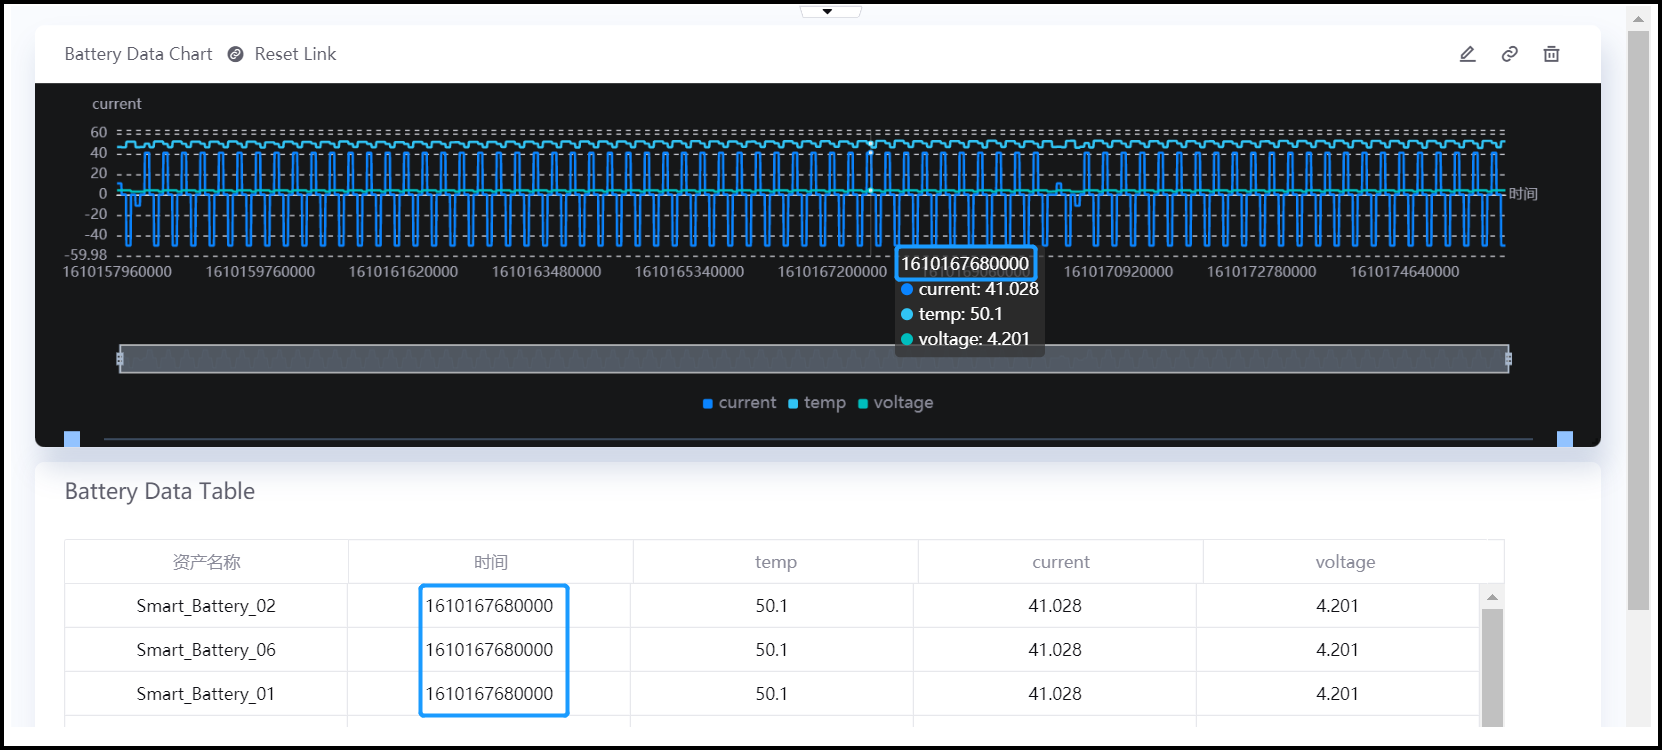
Click the Reset Link button in the header of the Mix Chart to reset the data filtering.
Exporting Widget Data
You can enable your users to export data from widgets for further analysis on their local machine. The data is exported to a CSV file.
Note
Exporting data is not supported for Picture and Rich Text widgets.
First, make sure you have enabled your widget to export data:
In the Chart Editor of the widget, navigate to Basic Information > Other Options.
Select the Allow Data Export checkbox.
Click Save.
Now on the published dashboard, users can export data by clicking the Export CSV ![]() button at the bottom right of the widget.
button at the bottom right of the widget.
The CSV file is saved in your default download directory.
Maximizing Widgets
To enable a clearer view of widgets, you can configure widgets to display in a full page maximized view.
Note
Maximized view is not supported for filter widgets. It is only available for chart widgets and widgets in containers.
First, make sure you have enabled your widget to expand in maximized view:
Edit your widget by performing one of the following actions:
For charts, click the Edit
icon on the selected widget and navigate to Basic Information > Other Options.For containers, click the Edit
icon on the selected container and navigate to Other Options.
Select the Allow Maximize checkbox.
Click Save.
Now, users can expand widgets in full page view. On the published dashboard, hover over the maximize ![]() button at the bottom right of the widget and click maximize.
button at the bottom right of the widget and click maximize.
To return to normal viewing, hover over the minimize ![]() button at the bottom right corner of the widget and click minimize.
button at the bottom right corner of the widget and click minimize.
Widget Grouping
You can group widgets to enable interactive data display across different widget types. This means that you can link the dimension data of charts within a group, thereby enabling cursor display on the charts to be synchronized.
Group widgets by following these steps:
On the dashboard editor toolbar, hover over the
 button and click
  Widget Grouping in the dropdown menu.
All existing widgets from the dashboard are displayed in a tab on the pop up window.
Drag and drop widgets into groups.
Drag and drop widget back into the tab to remove it from a group.
Click OK to save widget grouping.
You can now hover your cursor over a data point in a grouped widget and matching data values from other widgets in the same group will be displayed simultaneously.
Note
Only widgets with matching dimension, measurement or comparison data values can trigger the interactive display function.