Adding Widgets
After creating a page, you can add and edit widgets in the page by following these steps:
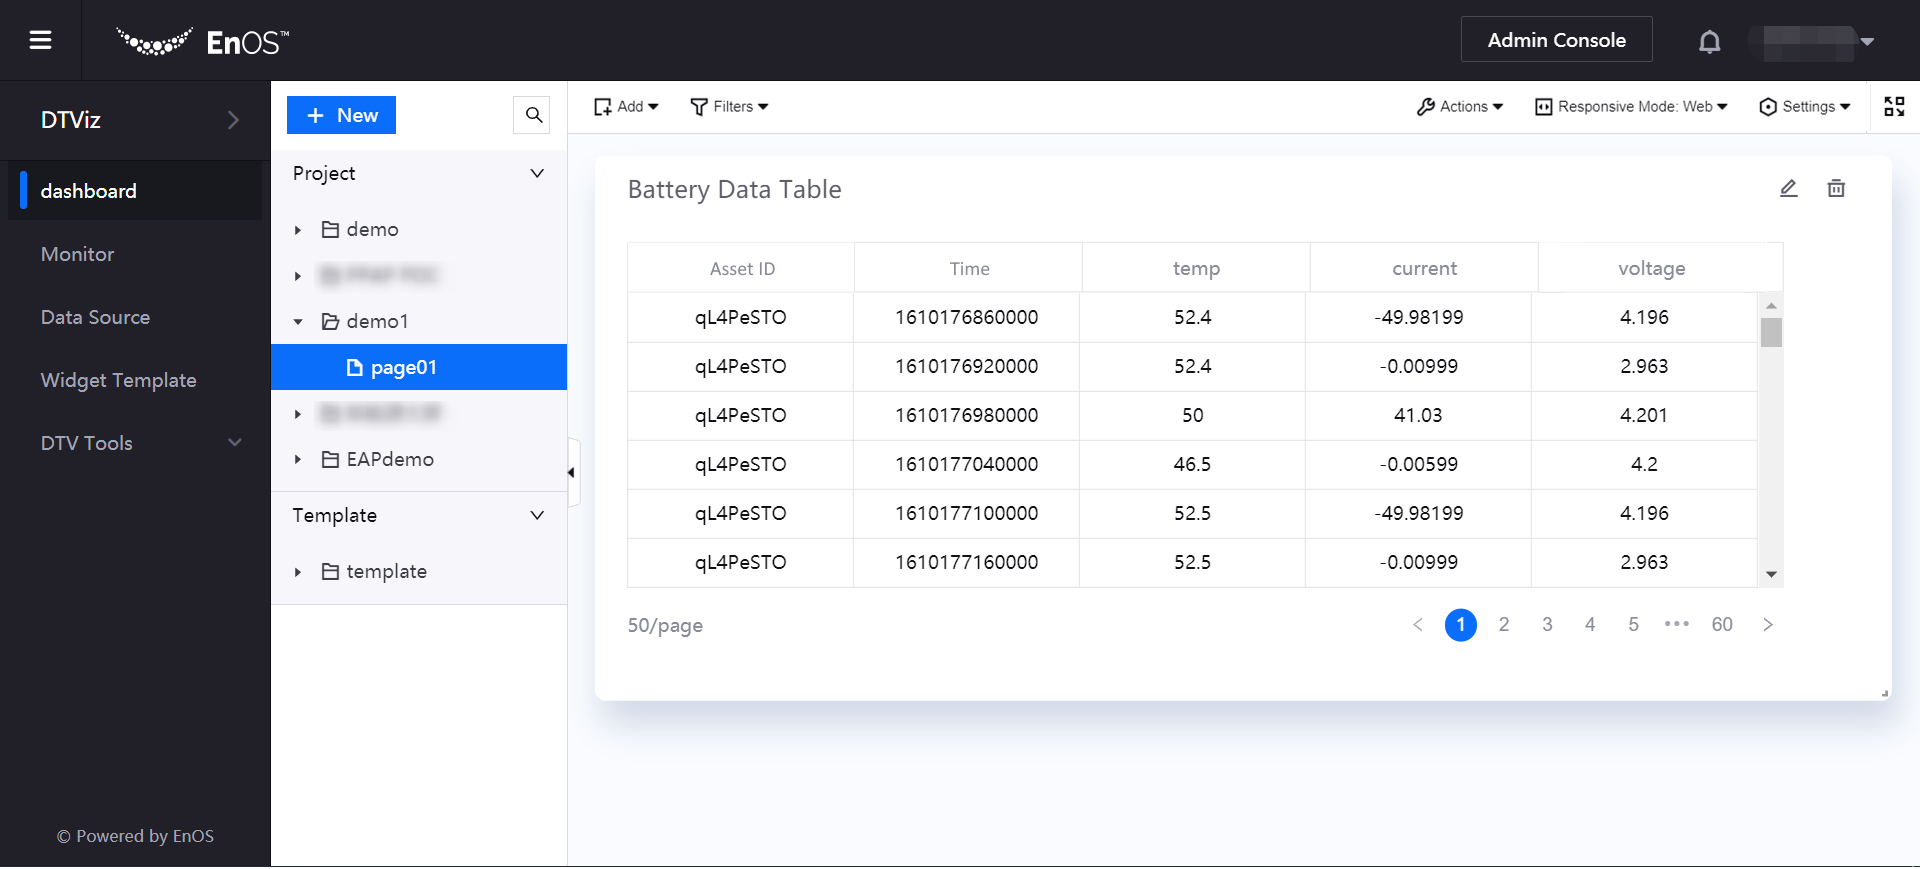
On the Dashboard page, select the created page. Click Add in the toolbar to open the dropdown menu, and click Widget (New) to start creating a new widget. If you wish to add a chart using an existing widget template, click Widget (From Template).
From the Chart Type section, select the chart type you want to use.
In the Basic Information section, provide the following basic information of the chart:
Basic Options: Enter the title and description of the chart.
Other Options: Select data refresh frequency.
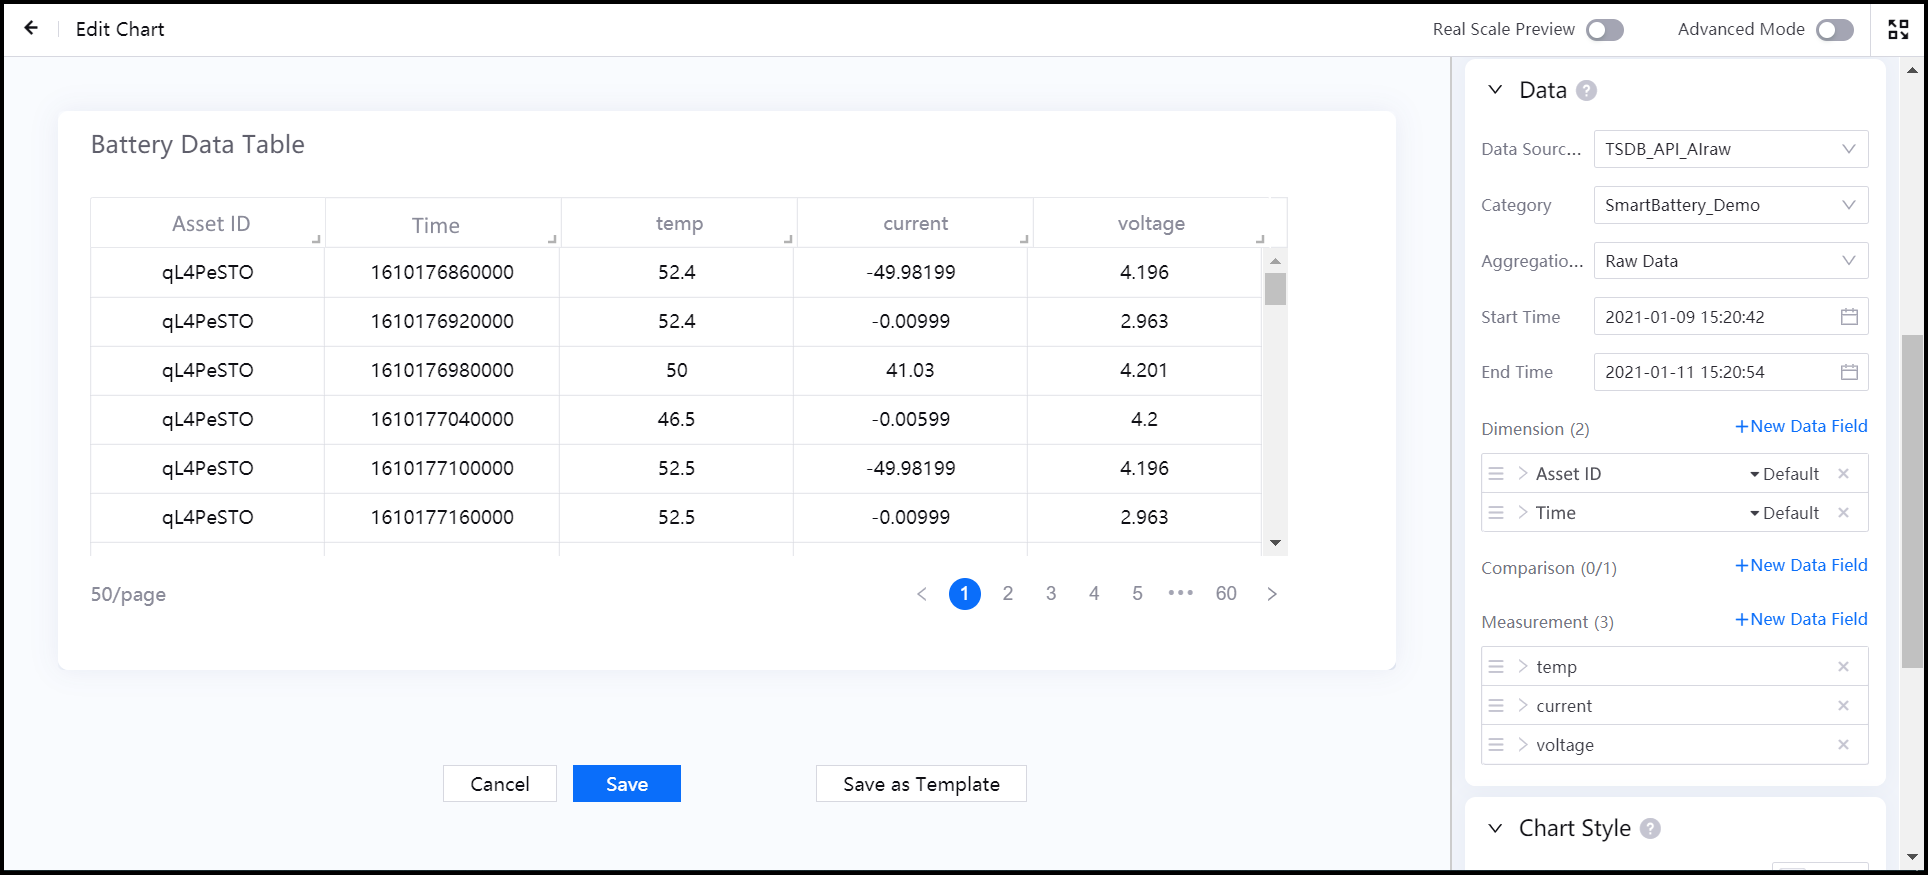
In the Data Fields section, add the data source to be used in the widget:
Data Source: Select the added data source.
Category: Select the category of the data item according to the selected data source.
Aggregation: Select whether to aggregate the data.
Dimension, Comparison, Measurement: Select a combination of dimensions, comparisons, and measurements in the data set. The chart will dynamically display the acquired data according to the selected combination. For more information, see Data Fields.
Note
Sometimes, depending on your selected data source and category, you may need to configure parameters in the Data Fields section. Parameters are additional fields that you can specify to narrow the range of your data. They are configured through DTV Custom Variables, or by your backend developer.
In the Chart Style column, configure the font, sorting and other properties of the chart.
Click Save to save the chart configuration.
Return to the Dashboard page to view the chart display effect.
You can adjust the widget position by dragging it, or adjust the widget size by dragging its edges.
After you have completed the adjustments, select Actions > Save Layout in the toolbar to save the page layout.