Multi-measurement Single Pie Chart
When you have data with only multiple measurements and there is no one dimension to aggregate the data, a multi-dimensional single pie chart can help you generate a pie chart showing the distribution of multiple measurements as a percentage.
DTV has provided a pie chart widget that supports the following data scenarios when your data has both dimensions and measurements.
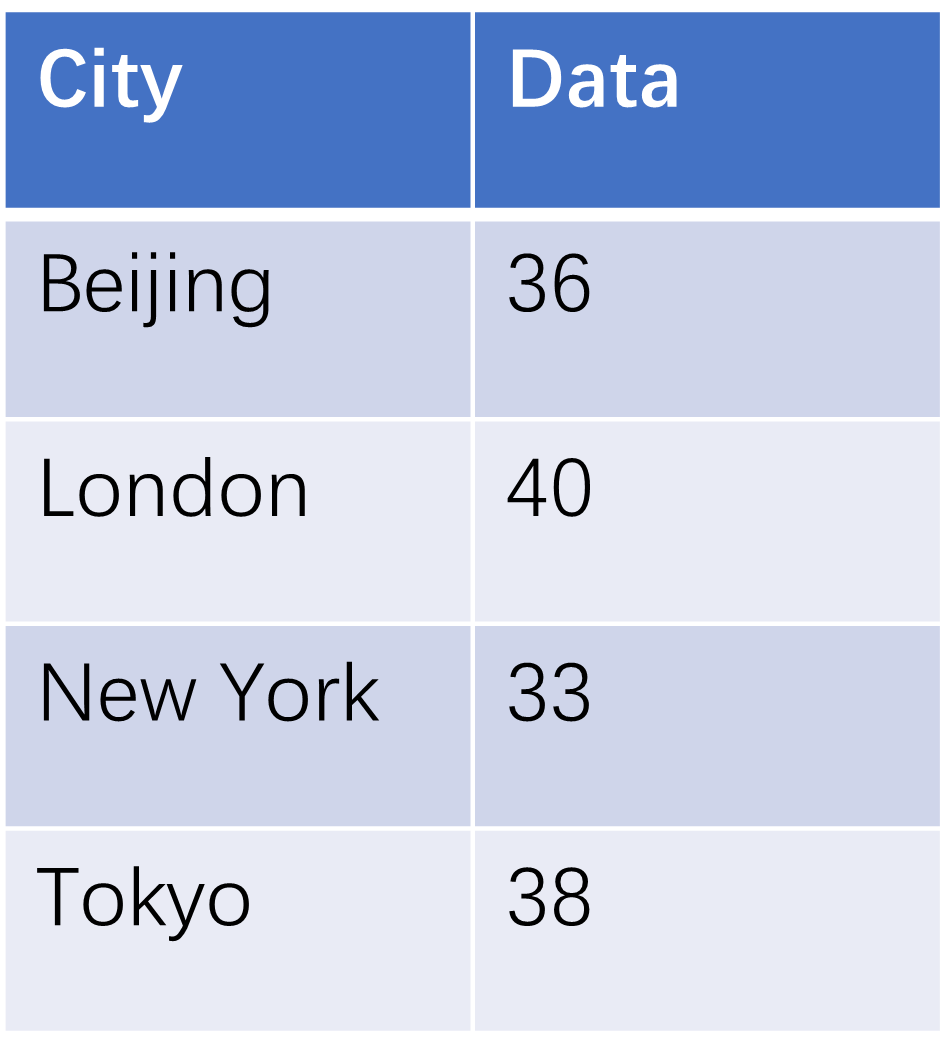
In this data, the city is the dimension and the data is the measurement. The pie chart will automatically form a diagram by city dimension. For more information about the configuration of the pie chart, see Pie Chart.
In some cases, your data does not have dimensions to aggregate the data, such as the data in the following table.
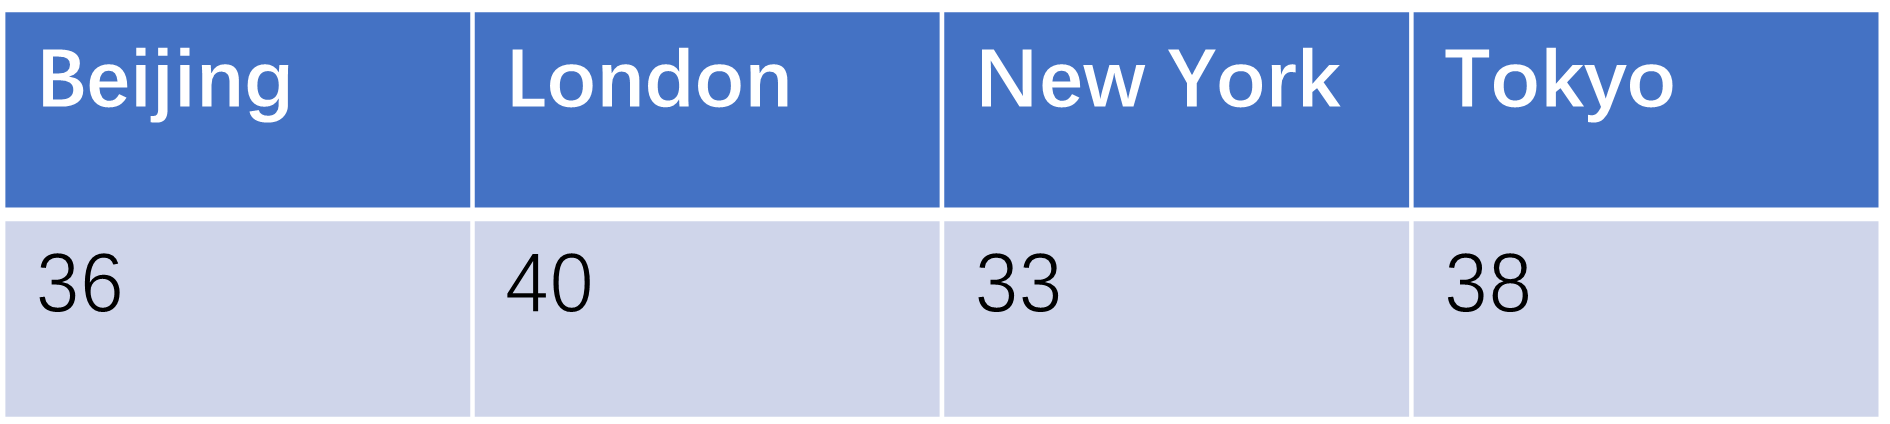
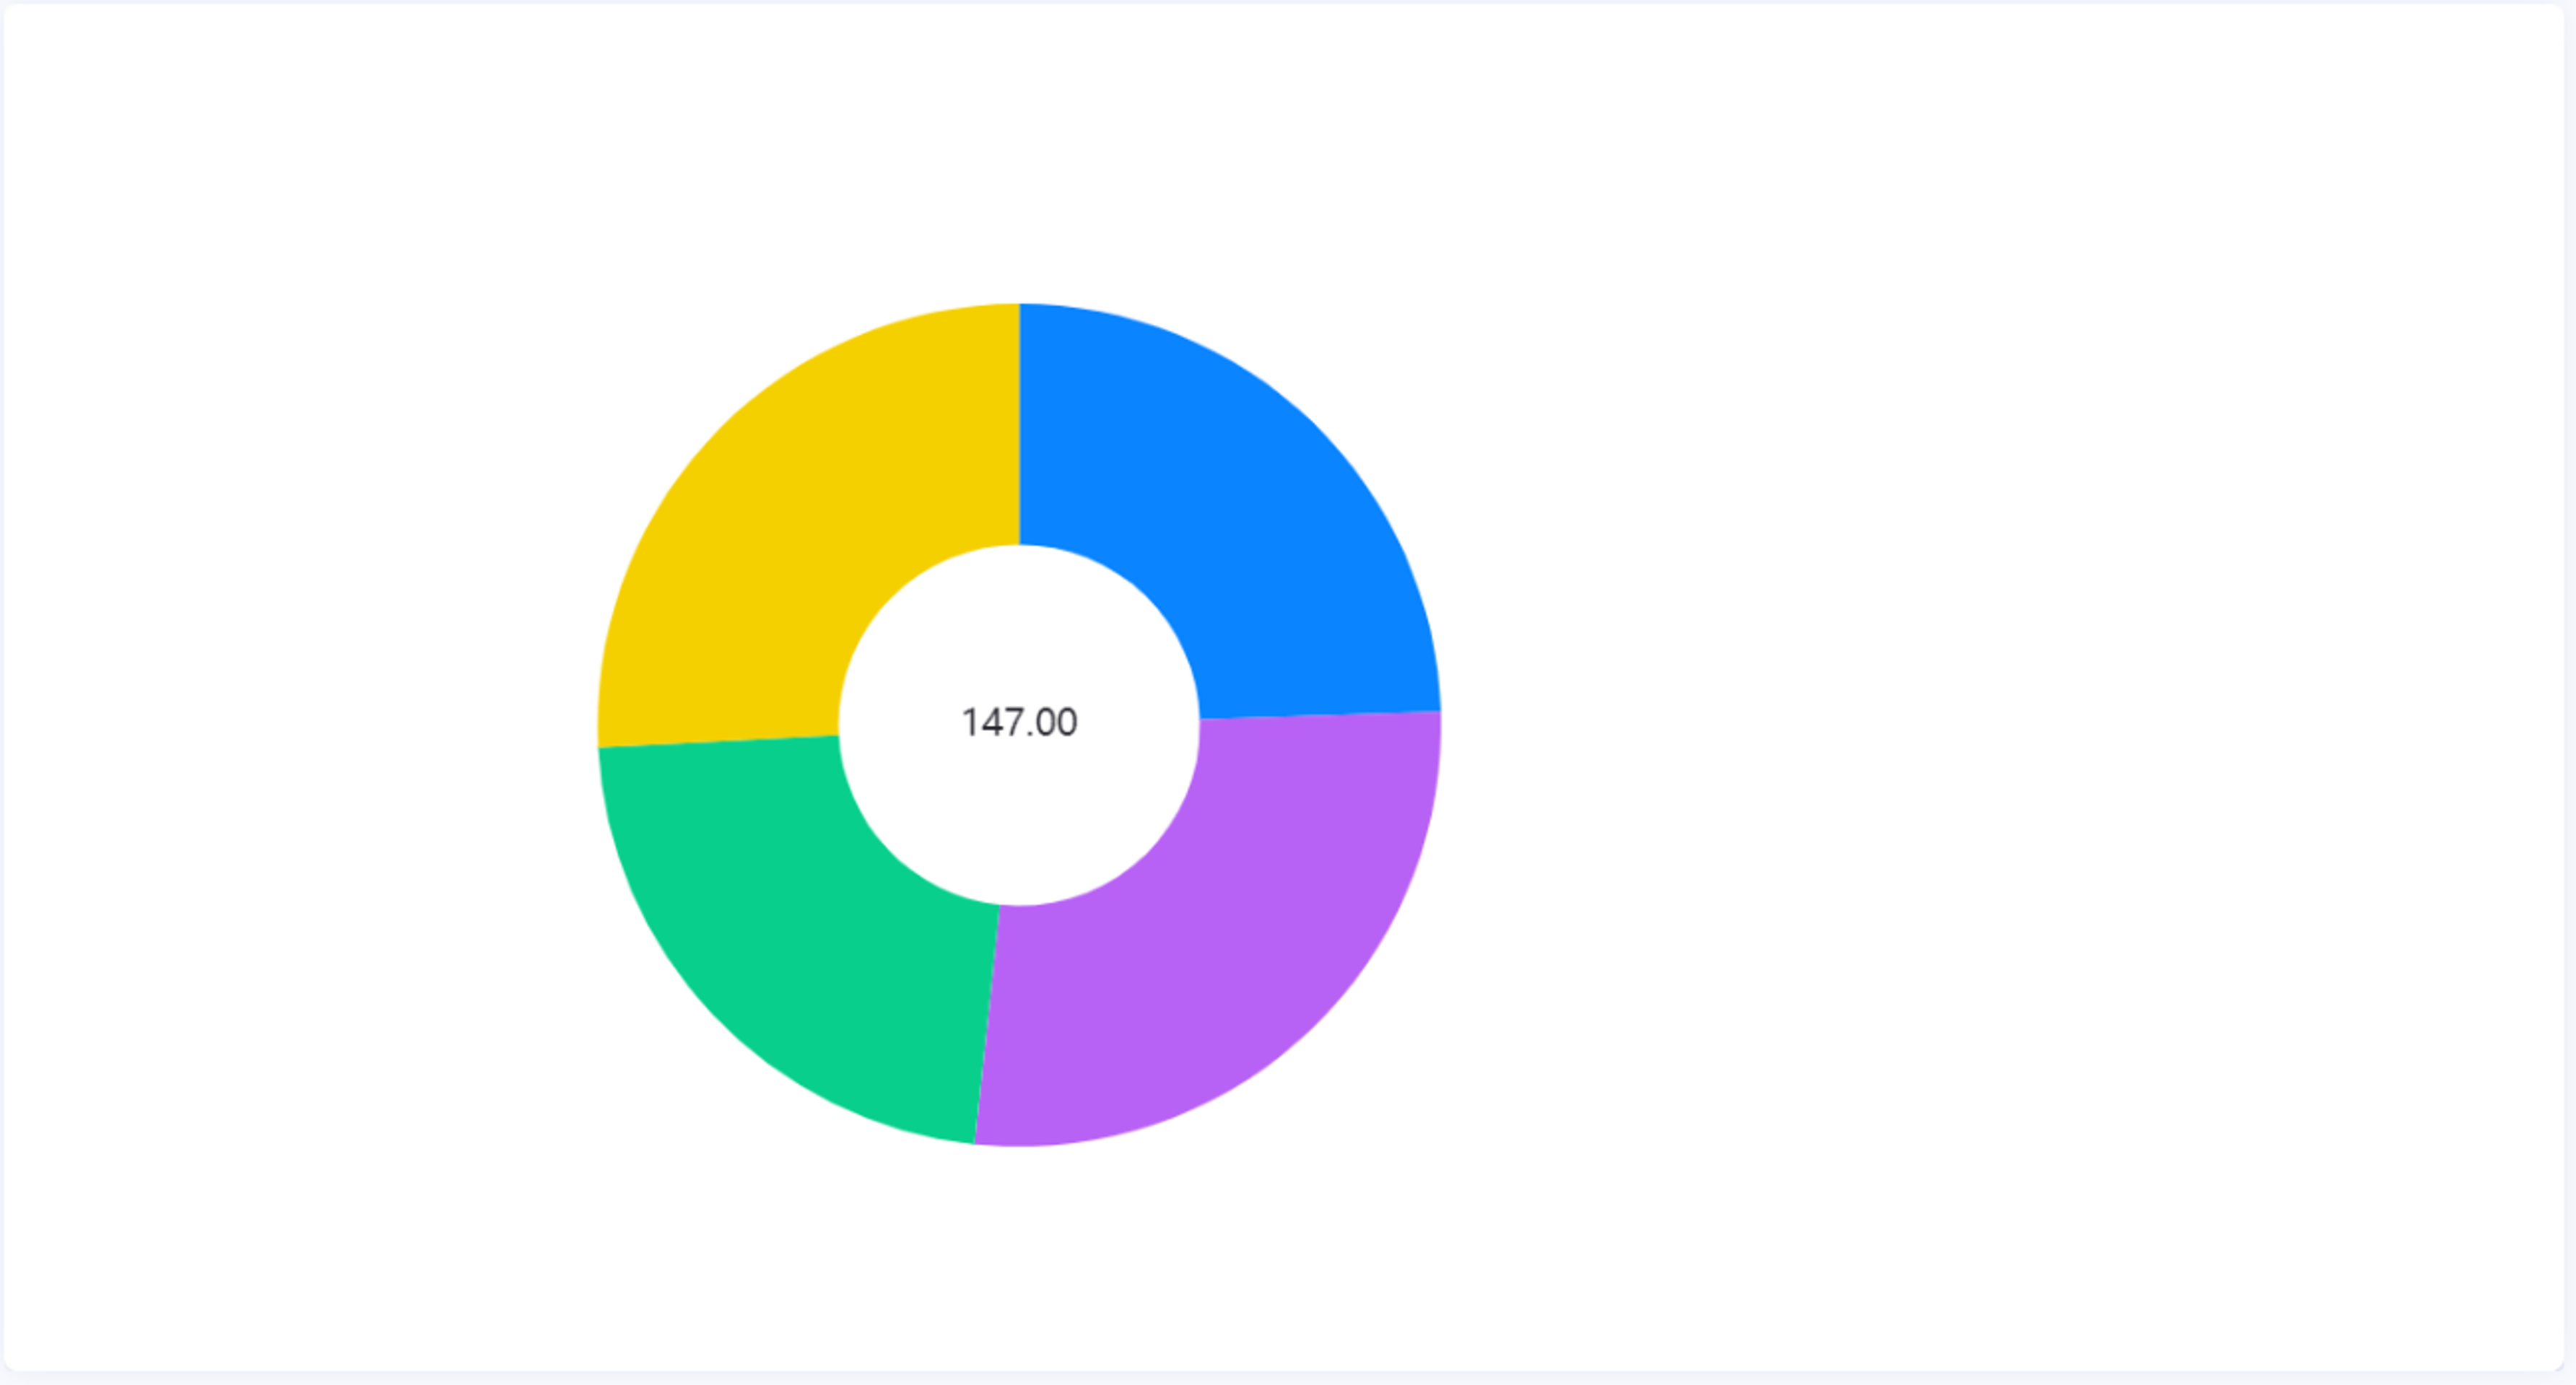
There are only multiple metrics in this data, and the normal pie chart widget does not support this type of data. In this case, you can use a multi-dimensional single pie chart to generate the chart.
Chart Style
Measurement Style
You can style the pie chart for each part of Measurement field.
| Field | Description |
|---|---|
| Color | Select the color for this measurement part. |
Pie Chart Style
Pie Settings
| Field | Description |
|---|---|
| Use Default Gradient Color | Select this to fill the pie chart with a gradient. This gradient color does not affect the measurement style that has been configured for individual colors. |
| Use Donut | Select this to display the pie chart as a donut. |
| Inner Diameter & Outer Diameter | Specify the thickness of the pie chart when it is displayed as a donut. |
| Value Font | Style the value labels. |
| Decimal Places | Round up the displayed chart data to the specified decimal places. |
| Unit Name | Specify the unit for chart data. |
| Dynamic Unit | Select this to automatically use the unit that suits your data values. |
| Unit Font | Style the unit labels. |
| Line Break | Select this to display the unit below the value. |
| Show As Percentage | Select this to display the chart data as percentage values. |
Legend
| Field | Description |
|---|---|
| Position | Select the position of the legend with respect to the pie chart(s). |
| Size | Specify the radii of the legend dots and the vertical spacing between them. |
| Legend Font | Style the text labels in the legend. |
| Legend Length | Specify the maximum length of the legend. |
| Show Legend Value | Select this to show the values on the legend. |
| Value Font | Style the value labels. |
| Unit Font | Style the unit labels. |
| Value Margin | Specify the spacing between the value and the text labels in the legend. |
Data Label
| Field | Description |
|---|---|
| Font | Style the Dimension labels. |
| Position | Select where the Dimension labels are positioned relative to the pie chart. |