Mix Gauge
The Mix Gauge widget is used to display progress towards a goal, and any additional information. Additional information is presented as a list.
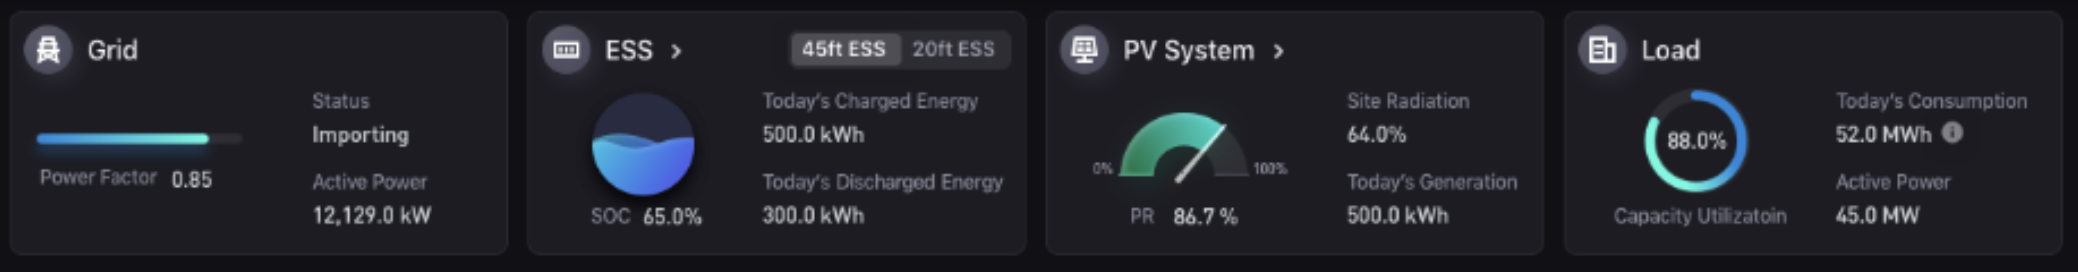
Currently, Mix Gauge supports presenting data in the following charts:
- Donut Gauge
- Meter Gauge
- Progress Bar
- Liquid Fill
Data Fields
The data fields required are:
| Field | Quantity |
|---|---|
| Measurement | 1 - 3 |
The first Measurement data field is used to display a chart of your choice, while subsequent data fields are presented as a list.
Chart Style
Measurement Style
For each Measurement field, you can set different styles, for example the indicator name, and fonts of different labels.
| Field | Description |
|---|---|
| Show Name * | Show the indicator name. It is located below each chart. |
| Name Font | Style the indicator name labels. |
| Unit Name | Specify the unit for chart data. The unit name will not be displayed if you chose to show data as percentage values. |
| Dynamic Unit | Select this to automatically use the unit that suits your data values. |
| Unit Font | Style the unit labels. |
| Value Font | Style the value labels. |
| Axis Range* | Specify the data range. |
| Decimal Places | Round up the displayed chart data to the specified decimal places. |
| Show As Percentage [1] | Select this to display the chart data as percentage values. |
| Formatting Rules | Set rules to color text for different measurement values. |
[1] Only available for first Measurement field
Mix Gauge Style
Gauge
| Chart Type | Field | Description |
|---|---|---|
| All | Type | Select the type of gauge. |
| Donut Gauge, Meter Gauge | Gauge Thickness | Specify the thickness of the gauge |
| Meter Gauge | Data Font | Style the axis labels |
| Progress Bar | Progress Bar Height | Specify the thickness of the progress bar |
Layout
| Field | Description |
|---|---|
| Line Break | Select this to display indicator names and values on separate lines |
| Position | Select where the additional information is positioned on the widget |
| Spacing | Specify the spacing between the gauge and the additional information |
| Line Spacing | Specify the spacing between each additional information |