Map
The Map widget is used for visualization analysis capabilities based on geographic location, and allows you to use latitude and longitude data to analyze and view data in different regions. In the Map widget, the data that needs to be displayed can be filtered by configuring a global filter.
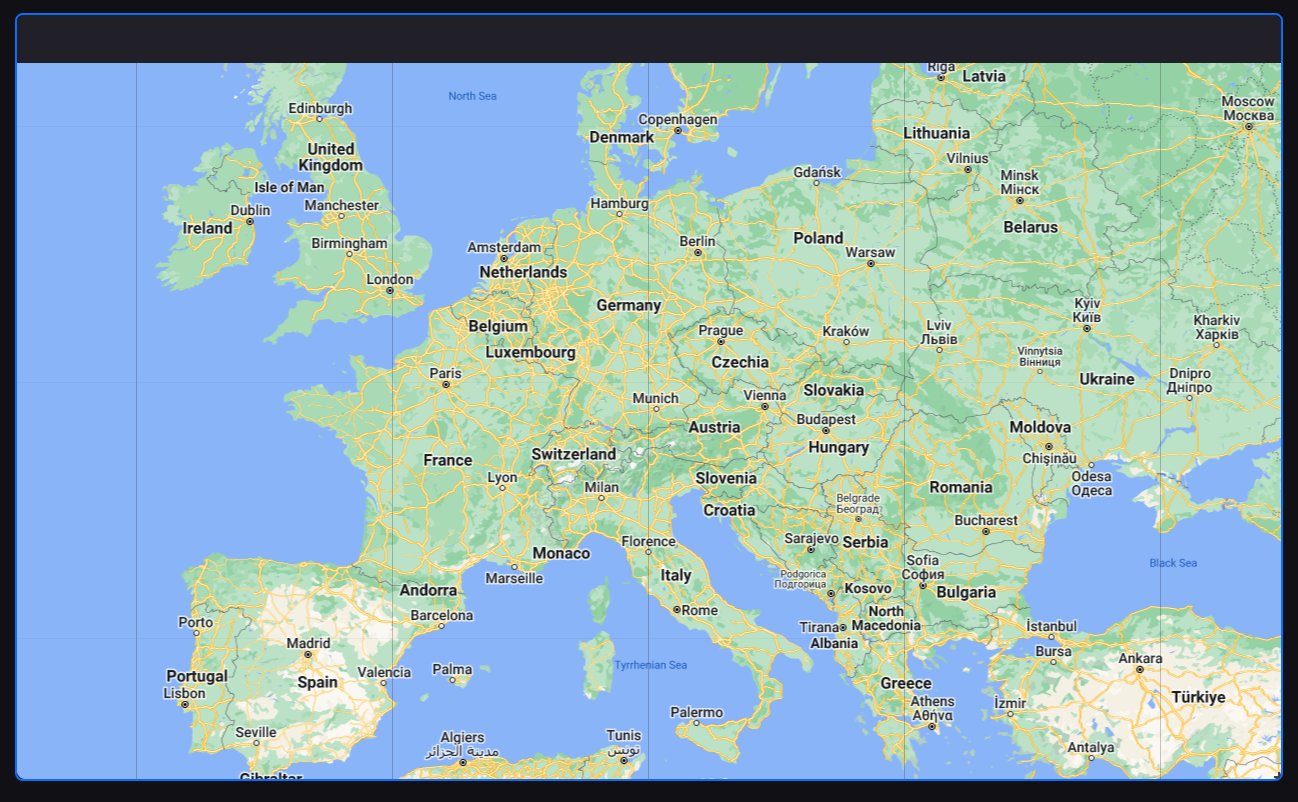
Chart Style
Map Configurations
Basic Configurations
| Field | Description |
|---|---|
| Center, Auto Calculate | Toggle between automatically calculating or manually setting the coordinates of the center of the map. |
| Zoom Level | Set the zoom level from 1-18. |
| Enable Drag | Toggle between enabling and disabling the dragging of the map. |
| Enable Zoom | Toggle between enabling and disabling the zooming in and out |
| Enable Interactive Layers | Toggle between enabling and disabling interaction with the data points on the map. |
| Show View Toolbar | Toggle between displaying and hiding the view toolbar. |
Link Configurations
| Field | Description |
|---|---|
| Enable Link Button | Toggle between displaying and hiding the link button when hovering over the map. |
| Link Name | Specify the name of the link. |
| URL | Specify the address to jump to if the button is clicked. |
Interactive Layer Configurations
Add, configure and sort the layers.
The types of layers available are:
- Map
- POI
- Bubble
- Geo
- Hierarchy
Map
| Field | Description |
|---|---|
| Map Source |
|
| Map Type |
|
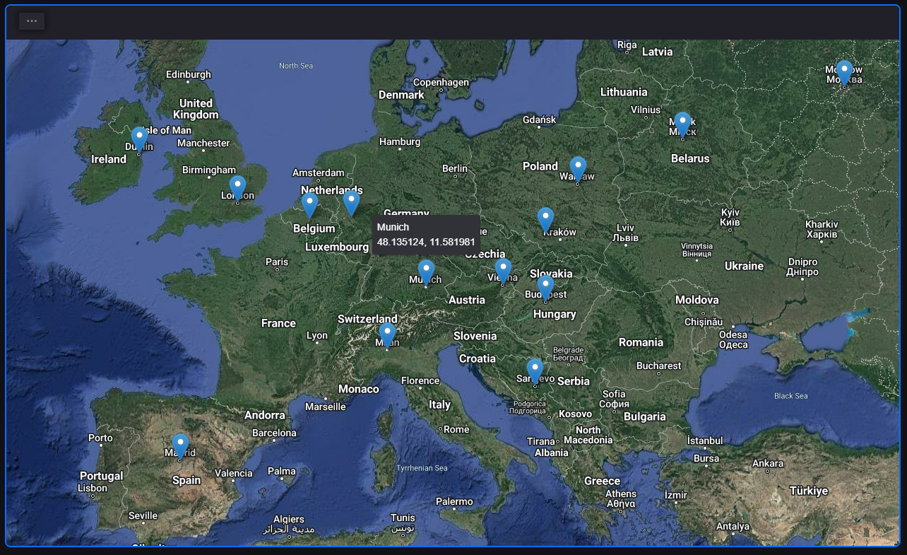
POI
| Field | Description |
|---|---|
| Longitude | Select the data field containing the longitudes of the data points. |
| Latitude | Select the data field containing the latitudes of the data points. |
| Asset Name | Select the data field containing the names of the data points. |
| Show Coordinates | Toggle between displaying and hiding the coordinates of the data points when hovering over them. |
| Aggregation | Toggle between enabling and disabling aggregation. |
| Data Field | Select the data field which specifies the aggregation granularity. |
| Icon Configurations |
|
| POI Icon Size | Specify the height and width of the icons. The default is 40 by 25. |
| Enable Data Linking | Toggle between enabling and disabling the linkage function between the icons and other widgets. |
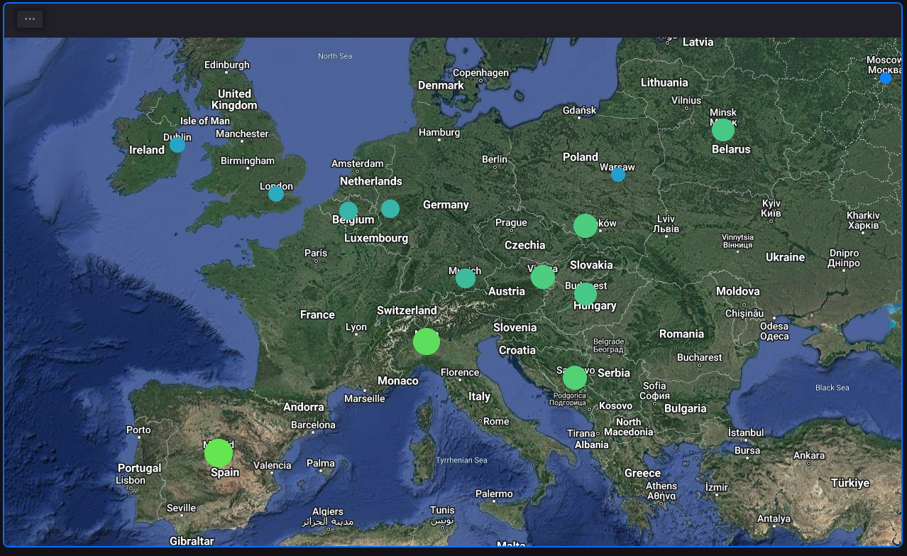
Bubble
| Field | Description |
|---|---|
| Longitude | Select the data field containing the longitudes of the data points. |
| Latitude | Select the data field containing the latitudes of the data points. |
| Bubble Source | Select the data field which specifies the bubble sizes. |
| Bubble Size | Specify the minimum and maximum sizes of the bubbles. |
| Color Mapping |
|
| Color Scheme | Select the color scheme for the color map. |
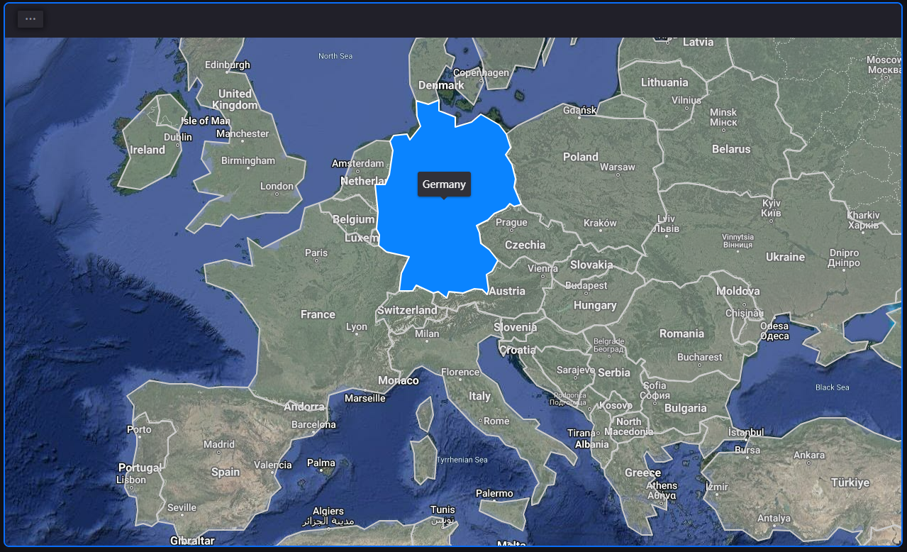
Geojson
| Field | Description |
|---|---|
| Region | Select the region to display. Select Custom to upload a map file in GEOJson format. |
| Region Field | Select the data field containing key values mapped to different areas. |
| Value Field | Select the data field containing the data which corresponds to the key values. |
| Enable Zoom On Click | Toggle between enabling and disabling zooming in on click. |
| Zoom Level | Set the zoom level from 1-18. |
| Color Mapping |
|
| Color Scheme | Select the color scheme for the color map. |
| Highlight Color | Specify the color of an area when hovered over. |
| Outline | Style the borders separating the areas. |
| Font | Style the display names of the different areas. |
| Enable Data Linking | Toggle between enabling and disabling the linkage function between the icons and other widgets. |
Hierarchy
| Field | Description |
|---|---|
| GeoJson URL | Enter the URL of the GeoJson for the hierarchy layer. The default URL is https://geo.datav.aliyun.com/area_v3/bound/{adcode}_full.json. |
| Linking Parameter | Enter the parameters to map the Adcode of the current layer Configuring Parameters. |
| Default Adcode | Specify the default area displayed on the layer. For example, if you want to display the map of Shanghai by default, enter 310000, the Adcode of Shanghai. |
| Region Code Field | Specify the field to map regions displayed on the layer. |
| Data Value Field | Specify the field to map data displayed on the layer. |
| Display Name and Data | Display the names and data of the regions on the layer. |
| Display Name and Data on Hover | Display the names and data of a region when you hover over the region. |
| Color Mapping |
|
| Color Pattern | Specify the color pattern for the layer. |
| Highlight Color | Specify the color of the region on which you hover over. |
| Outline | Specify the style of region outlines. |
| Font | Specify the font of region names and data field names. |
| Enable Widget Link | Enable the Widget Link function. For more information, see Configuring Widget Links. |
| Data Value Unit | Specify the unit of the field specified in Data Value Field, only available when Display Legends is enabled. |
| Display Legends | Display legends on the right of map widget. |
| Data on Hover |
|