Using Asset List
This topic describes how application users monitor the attributes, measurement points, and metric data of assets through Asset List. The Asset List page is shown as follows.

For more information about the page elements of Asset List, see Explore Asset List.
Note
Unified Monitoring supports custom page layouts and functions, so the actual layout and functions may differ from this topic. For help, contact the application developer.
Prerequisites
Before you start, make sure that the current account has been assigned the required asset permissions, operation permission points, and the menu group that includes the Asset List page. If not assigned, contact the OU administrator.
Switching Display Style
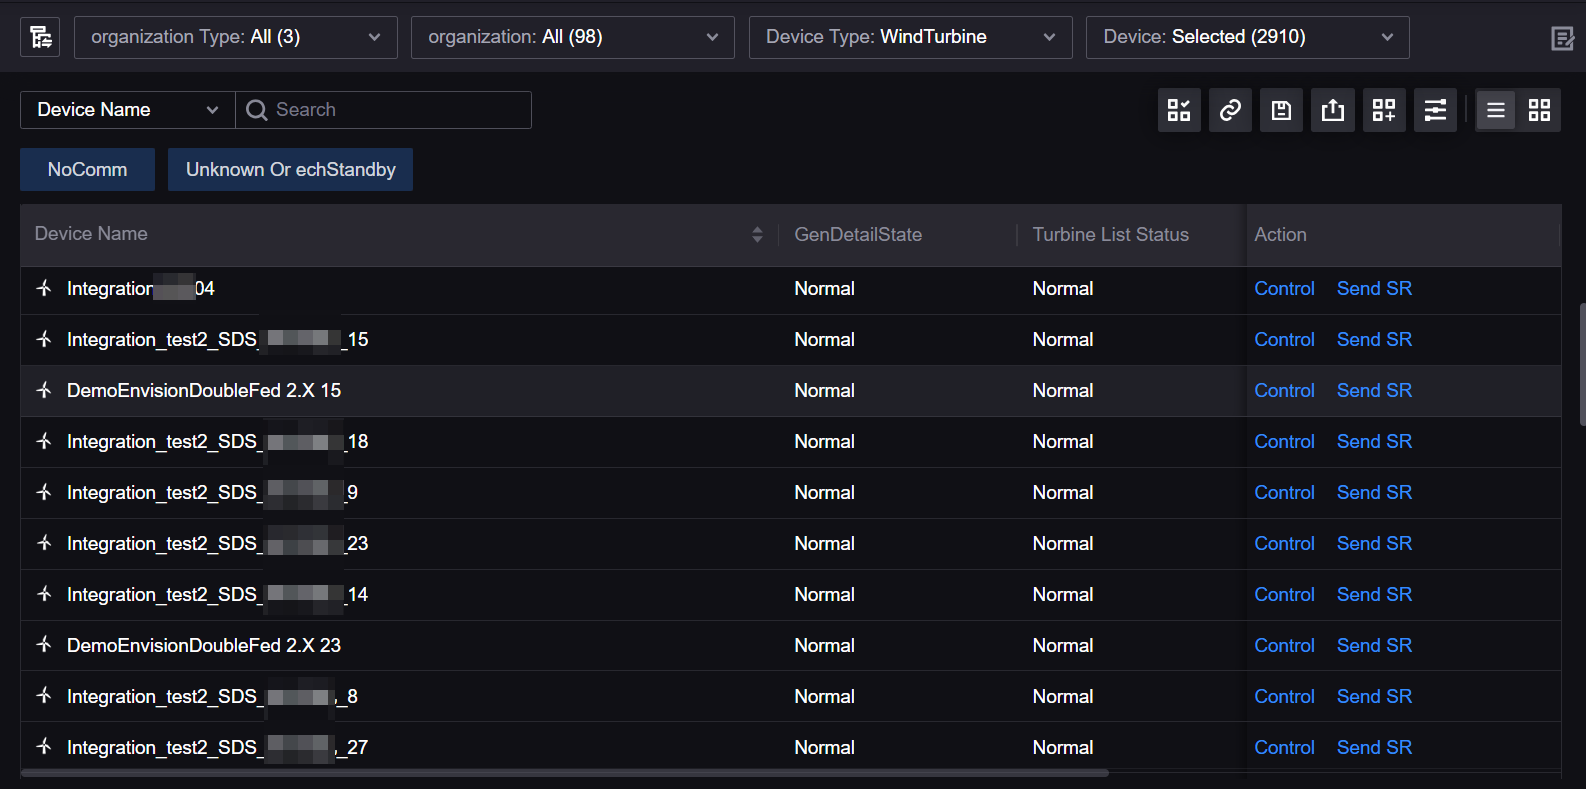
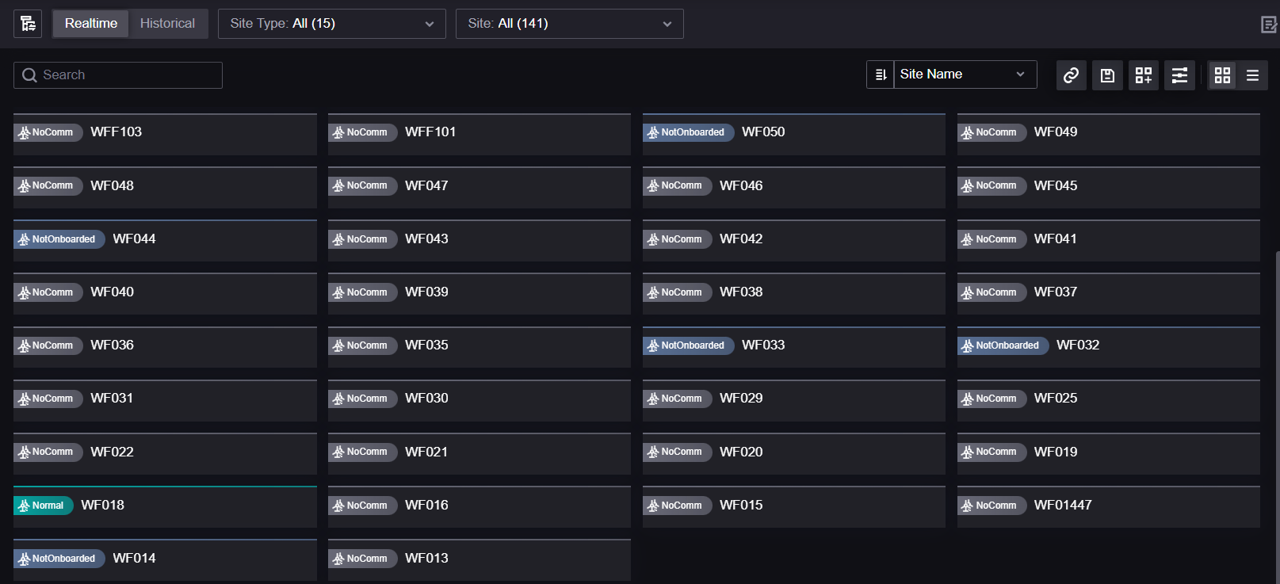
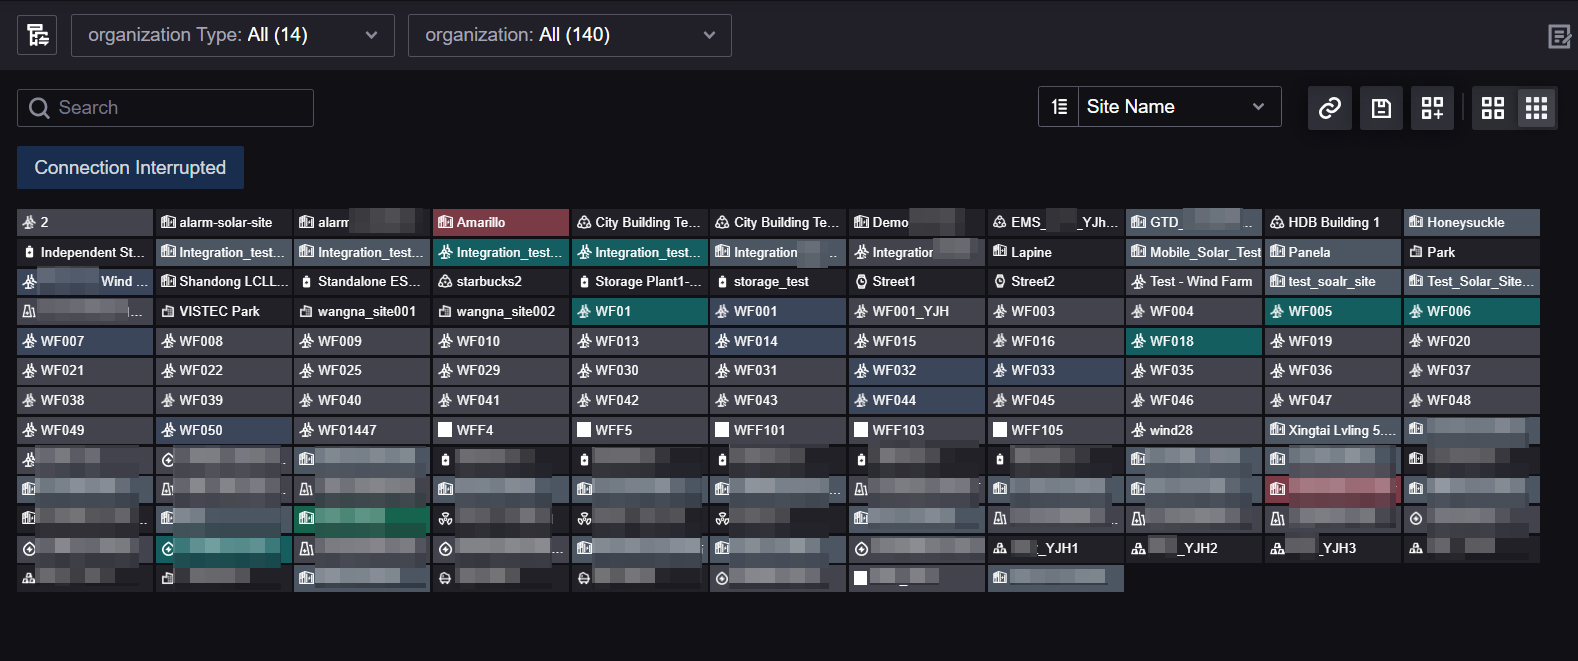
Asset List supports the following styles:
List style: displays assets and related data fields in a table, with the highest information density. Suitable for batch comparison, summary statistics, and data export.
Card style: displays assets and related data fields in cards, highlighting asset status and key metrics. Supports the site list and the device list.
Compact Card style: displays assets in cards without data fields. Supports the site list only. Suitable for quickly browsing a site list.
Follow these steps to switch the style of the current Asset List:
Select Asset List from the left navigation pane.
Note
Unified Monitoring supports custom menu names, so the actual menu name may differ from this topic. For help, contact the OU administrator.
Select one of the following icons in the action bar at the upper right corner of the page to switch the style:
Select
 to apply the List style.
Select
 to apply the Card style.
Select
 to apply the Compact Card style.
Note
The style switch buttons are displayed on the page only when the application developer has configured two or more styles.
Some functions are available only in specific styles. For example, the Total Row, export, batch actions, and batch control are available only in the List style.
Switching Data Type
If the application developer has enabled both realtime data and historical data, the page will display a data type switch button  .
Realtime: displays the current real-time values of assets, and the page updates automatically at the configured refresh interval.
Historical data: displays data in a specified time range. After switching, a time range filter is displayed at the top of the page, where you can specify the query range.
If you are currently editing Column Settings or Card Settings, the system will prompt that unsaved configurations will be lost before you switch the data type.
Filtering Assets
Filtering Assets with Filters
Select Asset List from the left navigation pane.
Select the target filter at the top of the page. The available filters depend on the asset dimension of the page and the configuration of the application developer, and usually include asset type, site, region, device type, device, and time range.
Specify the filter conditions in the dropdown menu, and the filtering results will take effect in the Asset List immediately.

The Device Type Filter may be a dropdown or grid buttons, and may support single or multiple selection, depending on the configuration of the application developer.
Filtering Assets with Metric Cards
A metric card contains specific data field conditions and can be used to quickly filter the assets that meet the conditions. The metric cards in Asset List are shown in the following figure. To add or delete metric cards, contact the application developer.

Follow these steps to filter assets with metric cards:
Select Asset List from the left navigation pane.
Select a metric card to enable or disable the corresponding filter conditions. Enabled metric cards will be highlighted.
Metric cards support the following three selection modes, and the mode is configured by the application developer:
Selection mode |
Description |
|---|---|
Multiple (all selected conditions are satisfied) |
Multiple cards can be selected at the same time, and the page only displays assets that satisfy all the selected card conditions. Suitable for narrowing down the range step by step. |
Multiple (any selected condition is satisfied) |
Multiple cards can be selected at the same time, and the page displays assets that satisfy any of the selected card conditions. Suitable for summarizing multiple types of abnormal status. |
Single selection |
Only one card can be selected at a time. |
If the application developer has enabled Metric Card Counting, the card will also display the number of assets matching the condition, so as to quickly judge the scale of anomalies.
Searching Assets
Select Asset List from the left navigation pane.
Select the search scope in the search dropdown list at the top of the page. You can search by asset name, or by an attribute for which the application developer has enabled search.
Enter the keyword in the search box, and the search results will take effect in the Asset List immediately.
Only string-type attributes support enabling search. If you need to search by an attribute but the option is not in the dropdown list, contact the application developer to enable search for that attribute in Column Settings.
Switching Organization Structure
If the current application and the current account have access to multiple organization structures at the same time, an organization structure switch entry will be displayed at the top of the page. After selecting the target organization structure, the asset scope in the asset filters will be updated accordingly.
After switching the organization structure, the page will reload the asset tree, and the selected filter conditions may be reset.
Grouping and Aggregating Assets
Asset List supports the following three grouping methods, which can help you view assets in blocks by management dimension when the number of assets is large. The available grouping methods depend on the asset dimension of the page and the configuration of the application developer.
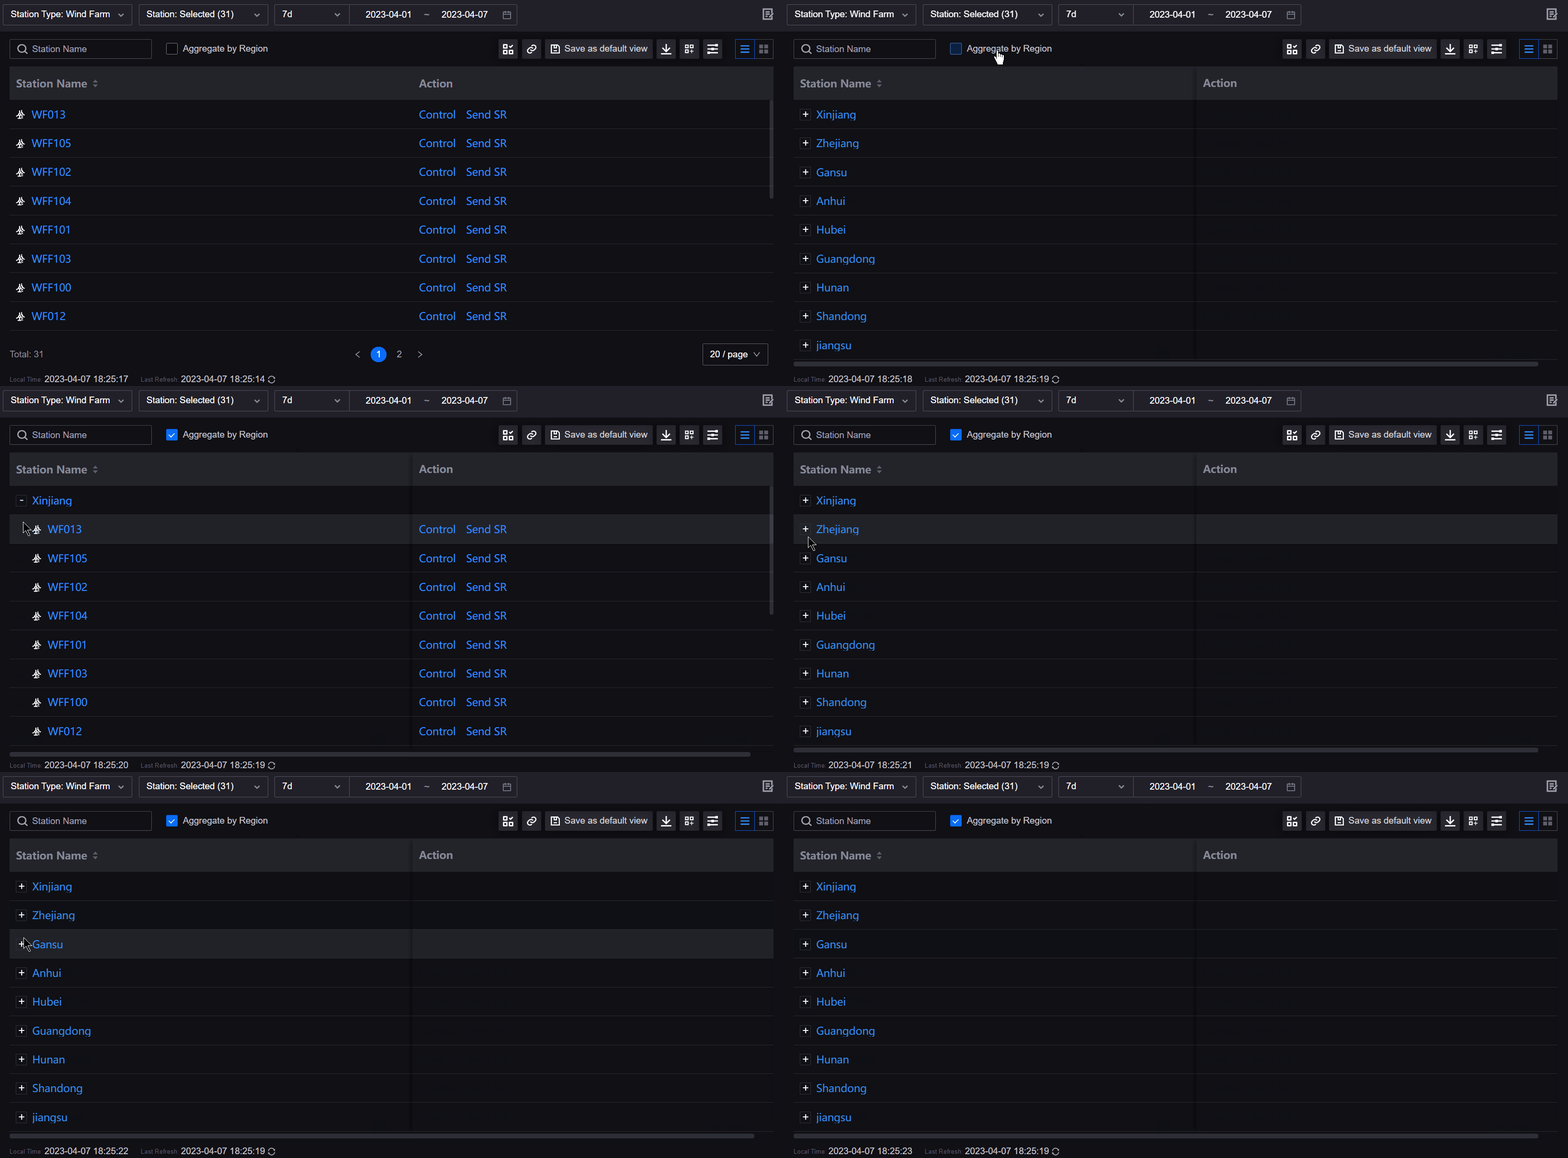
Aggregating Sites by Region
In the site list, select the Aggregate by Region check box to aggregate the sites on the page by region. Select a region name label to expand or collapse the sites under this region, which facilitates region-by-region monitoring.
Grouping Devices by Site
In the device list, select the Grouped by Site check box to group the devices on the page by their sites, avoiding mixing same-name devices from different sites in cross-site queries.
The application developer can configure action buttons for site rows and device rows separately, so the content of the Actions column of the two types of rows may differ.
Grouping Assets by Attribute
If the application developer has enabled grouping for an attribute in Column Settings, a Group By dropdown list will be displayed at the top of the page. After selecting the target attribute, assets will be grouped and displayed by the value of that attribute, such as viewing turbines grouped by device model.
Grouping by attribute is unavailable when Aggregate by Region, Grouped by Site, or server paging is enabled.
Sorting Assets
Select Asset List from the left navigation pane.
Change the display order of assets in the following ways:
List style: select the header column of the list to sort the assets in the table by the data of this column (select once for descending order, and select twice for ascending order).

Card or Compact Card style: select a data field in the asset order dropdown list, and select the
 icon to set ascending or descending order.

Note
Metric columns are sorted by numeric value, not by text.
When sorting by the value of a dimension, the system sorts by the identifier of the dimension value.
When server paging is used, only fields that support sorting can be clicked to sort.
If the application developer has enabled Show Non-Connected Status, the data of non-connected assets does not participate in sorting.
Setting Columns
Column Settings are used to adjust the columns displayed in the List style and how they are displayed. Follow these steps to set columns:
Select Asset List from the left navigation pane.
On the Asset List page, select Column Settings
 .
In the Column Settings panel on the right, select the data fields to be added, and select the check icon
 to save the changes.
Select the tag of an added data field to expand the configuration bar and configure the following information.
Field
Description
Conditions and Limitations
Display Name
The display name of the column in the table, with internationalization input supported.
Configurable for all added data fields. When left blank, the registered name of the data field is used.
Unit
The unit of the data field, with internationalization input supported.
Configurable only for data fields whose data type is
INT,FLOAT, orDOUBLE, that are not DI measurement points, and whose unit is defined in the metadata. Enumeration, string, unitless numeric, and DI measurement point fields do not display this item. After the customized unit is cleared, the system restores the original unit in the metadata.Unit Multiplier
Used to adjust the order of magnitude of data when the data is too large or too small. The value displayed in the list is the product of the original value and the unit multiplier. For example, if the original data is 10000 Wh, you can set Unit to KWh and Unit Multiplier to 0.001 so that it is displayed as 10 KWh.
The same conditions as Unit: configurable only for
INT,FLOAT, orDOUBLEdata fields that are not DI and already have a unit; enumeration types are not supported. The default value is 1.Decimal Places
The number of decimal places the data retains in the list, supporting
Originaland 0–10 places.Configurable only for data fields that are
FLOATorDOUBLEand not DI measurement points; the default is 2 places when not set. Integer and enumeration data do not display this item, and integers are displayed with 0 decimal places.Style
The display style of the data in the list, supporting
Metric,Progress Bar, andStriped Progress Bar.Metricdisplays the value directly, and the two progress bar styles display the percentage as a bar chart.Configurable only for non-enumeration
INT,FLOAT, orDOUBLEdata fields, andMetricis used by default. Progress bars are suitable for ratio-type data such as completion rate and availability rate; when the unit is%, the current value is used directly, otherwise the percentage is calculated based on the maximum value of the current asset data in that column.Condition
Configures conditional colors for data. Select Add to create a condition and set its value range and color.
Configurable only for non-enumeration numeric types, or enumeration data fields with at least one enumeration value. Numeric types can be filled with a minimum and a maximum value; leaving blank means no restriction at that end; enumeration types can only select from existing enumeration values. Data that is neither numeric nor with enumerations does not support this item.
Enable Search
Allows application users to search assets by this attribute in the search box.
Configurable only for string-type attributes without enumerations. With client paging, available only when Asset Dimension is Site or Device; with server paging, the filter mode of the attribute metadata is also required to include fuzzy query (
like).Group By This Attribute
Allows application users to group and display assets by the value of this attribute, for example viewing turbines grouped by device model.
Configurable only when client paging is used, Grouped by Site or Aggregate by Region is not enabled, and Asset Dimension is not Region. The data field must be a string attribute or an attribute with enumeration values; unavailable with server paging.
Keep This Attribute In Table
After grouping is enabled, still keeps the attribute column in the table.
Displayed only when Group By This Attribute is enabled, and selected by default once grouping is enabled. After being deselected, the attribute is still used for grouping but not displayed as a separate column.
Data Validity
Sets a valid time for realtime data, in minutes. When the difference between the asset timestamp and the timestamp of the latest data value exceeds this duration, the system determines that the data is invalid and displays an alert icon in the column.
Configurable only when client paging is used and Asset Dimension is Site or Device. The data field must be a measurement point, or a latest-value metric with a period of
L. The value range is 1–1440 minutes, and it is not set by default; the asset or its site needs to have a time zone and the corresponding data timestamp.In Frozen Column, select the number of columns to be fixed on the left of the table, supporting
NoneandFirst ColumnthroughFirst 5 Columns. The first 1 column is frozen by default. Freezing is counted by the current column order, and the asset name column is always the first column; the operation column is fixed on the right of the table regardless of freezing. Suitable for scenarios with many columns where the asset name needs to remain visible during horizontal scrolling.Select OK.
Note
If the application developer has enabled Permission on Column/Card Settings, the corresponding permission point is required to use Column Settings.
The asset name column and the operation column cannot be removed.
Setting Cards
Card Settings are used to adjust the data fields and charts displayed in the Card style. Follow these steps to set cards:
Select Asset List from the left navigation pane.
On the Asset List page, select Card Settings
.At the top, select the asset type tab to be configured. To reuse the settings of a configured type, select
 and specify the source type.
Enable Show Data, select Add Data, and select the data fields to be added to the card in the dropdown menu, then select the check icon
to save the changes.Select the tag of an added data field to expand the configuration bar and configure the display name, unit, unit coefficient, decimal places, and conditional colors. The field descriptions are the same as those in Column Settings. A single card displays at most 6 data fields. Attribute data fields can be controlled by Keep This Attribute In Card whether to be displayed directly on the front of the card.
(Optional) Enable Show Chart, select the data fields to be displayed as trend charts, and configure the chart style and colors. This item requires Card Trend Chart to be enabled in Basic Configurations first. A single card displays at most 2 charts.
(Optional) After Show Chart is enabled, you can configure the time range and time granularity of the chart in Time Configuration.
Field
Description
Conditions and Limitations
Overlapped Intervals
Displays the time intervals jointly supported by the selected data fields, for confirming the selectable range.
Read-only.
Time Range
The time range displayed by the chart, such as today, the last 7 days, this month, and the last 12 months.
Up to 2 time ranges can be selected.
Time Grain
The aggregation granularity of data points in the chart, supporting 1, 5, 10, 15, 30, and 60 minutes.
Required when a day-level time range is selected.
Select OK.
Note
Show Chart is available only after the application developer has enabled Card Trend Chart.
If data fields have been selected for the chart but the time range or time grain is not configured, it cannot be saved.
It is recommended to customize colors and value conditions for numeric and enumeration data, so that cards can identify anomalies more easily during monitoring.
Viewing Data Update Time
If the application developer has enabled Local Time, the following information will be displayed at the bottom of the page, for confirming the freshness of the data:
Current time
Latest refresh time
Last updated time
Total number of assets

In addition, you can view the latest update time column of measurement points and metrics in the list (if the application developer has added it), or hover the cursor over data with an alert icon to view the prompt that the data has not been updated in time.
To obtain the latest data immediately, select the refresh icon  to manually refresh the page.
Pinning Assets
If the application developer has enabled Asset Pinning, you can pin the assets you focus on over a long period to the top of the list:
Select Asset List from the left navigation pane.
Hover the cursor over the target asset row, and select the star icon before the asset name.
The asset will be pinned to the top. Select the star icon again to unpin it.
Note
Asset pinning is available only in the site list and the device list, and is not supported on pages using server paging.
Controlling Assets
Asset List can integrate the control panel in Cluster Control to achieve the integration of asset monitoring and control.
Only the Asset List in the List style supports controlling assets, and the asset control permission point is required.
Controlling a Single Asset
Select Asset List from the left navigation pane.
In the Actions column of the Asset List, select Control to open the control panel.
Control the asset in the control panel. For more information, see Controlling a Single Device.
Controlling Assets in Batches
Select Asset List from the left navigation pane.
Select the assets to be controlled in the list.
Select Batch Control
 to open the control panel.
Control the assets in batches in the control panel. For more information, see Controlling Devices in Batches.
The upper limit of the number of assets that can be controlled at one time is configured by the application developer. If the type of the selected assets does not open batch control, the page will give a prompt.
Running Batch Actions on Assets
If the application developer has configured batch action buttons, you can perform business operations on multiple assets at one time, such as batch issuing work orders.
Select Asset List from the left navigation pane.
Select the assets to be operated in the list.
Select the target batch action button, and the page will open the target page in the configured way.
Note
Only the List style supports batch actions.
The upper limit of the number of assets that can be operated at one time is configured by the application developer.
If the application developer has configured Batch Criteria, assets can be operated together only when the specified attribute value of the selected assets is the same.
Sending Service Requests
Asset List can integrate the service request page of Work Management. After the application developer opens the asset types for sending service requests, you can quickly send asset service requests (SR) while monitoring assets through the following steps:
Select Asset List from the left navigation pane.
In the Actions column of the Asset List, select Send SR.
Send the service request of the asset on the service request page. For more information, see Creating Work Orders Using Service Requests.
Saving Templates
Templates are used to save the current filters and display configurations, so that they can be directly reused the next time you enter the page. A template contains the current style, column or card settings, metric cards, filters, table column widths, and asset sorting.
Follow these steps to save a template:
Select Asset List from the left navigation pane.
In the action bar at the upper right corner of the page, select Save Template.
In Template Type, select one of the following types:
Template type
Description
Conditions and Limitations
OU Template
Once saved, all application users under this OU will load this template by default when opening this page.
Requires the related OU template permission points.
My Template
Once saved, this template will be loaded automatically only when the current account enters this page again.
—
Select OK.
To discard the saved personal configuration, you can select Reset in the Save Template pop-up, and the page will be restored to the OU template. Restoring to default will lose all personal customized configurations, and the system will require a second confirmation before the operation.
Exporting Asset List
To view or modify the data of the current page offline, or to use the Asset List for archiving and reporting, follow these steps to export the data locally:
Note
Only the List style supports export, and the data export permission point is required.
Select Asset List from the left navigation pane.
Hover the cursor over the export icon
 .
In the dropdown menu:
Select Export as CSV to export the Asset List as a CSV file.
Select Export as Excel to export the Asset List as an Excel file.
The name of the exported file is in the format of “{menu name}_YYYYMMDD”, where the menu name is the menu name defined for the current page in the application.
Note
Pages using server paging generate the exported file on the server side, and no format choice is provided during export.
There is an upper limit on the number of records that can be exported at one time, and the specific value depends on the configuration of the deployment environment. If the page prompts that the data volume exceeds the limit, narrow the filter range and export again.
Export operations are recorded, and the OU administrator can query the download history of application users in the EnOS Application Portal.
The exported content may contain business-sensitive data. Follow the data management requirements of your organization when using it.