Exploring Unified Monitoring
The page describes the pages and components of Unified Monitoring modules to help application users familiar with the components and functions of Unified Monitoring.
Note
Unified Monitoring supports customizing page layouts and functions. The actual layouts and functions of your Unified Monitoring pages might be different. For more information, contact the application creators.
Exploring Portfolio
Portfolio displays the geographical allocation and data of assets in multiple layers and types with interactive maps. A configured Portfolio page is as follows.
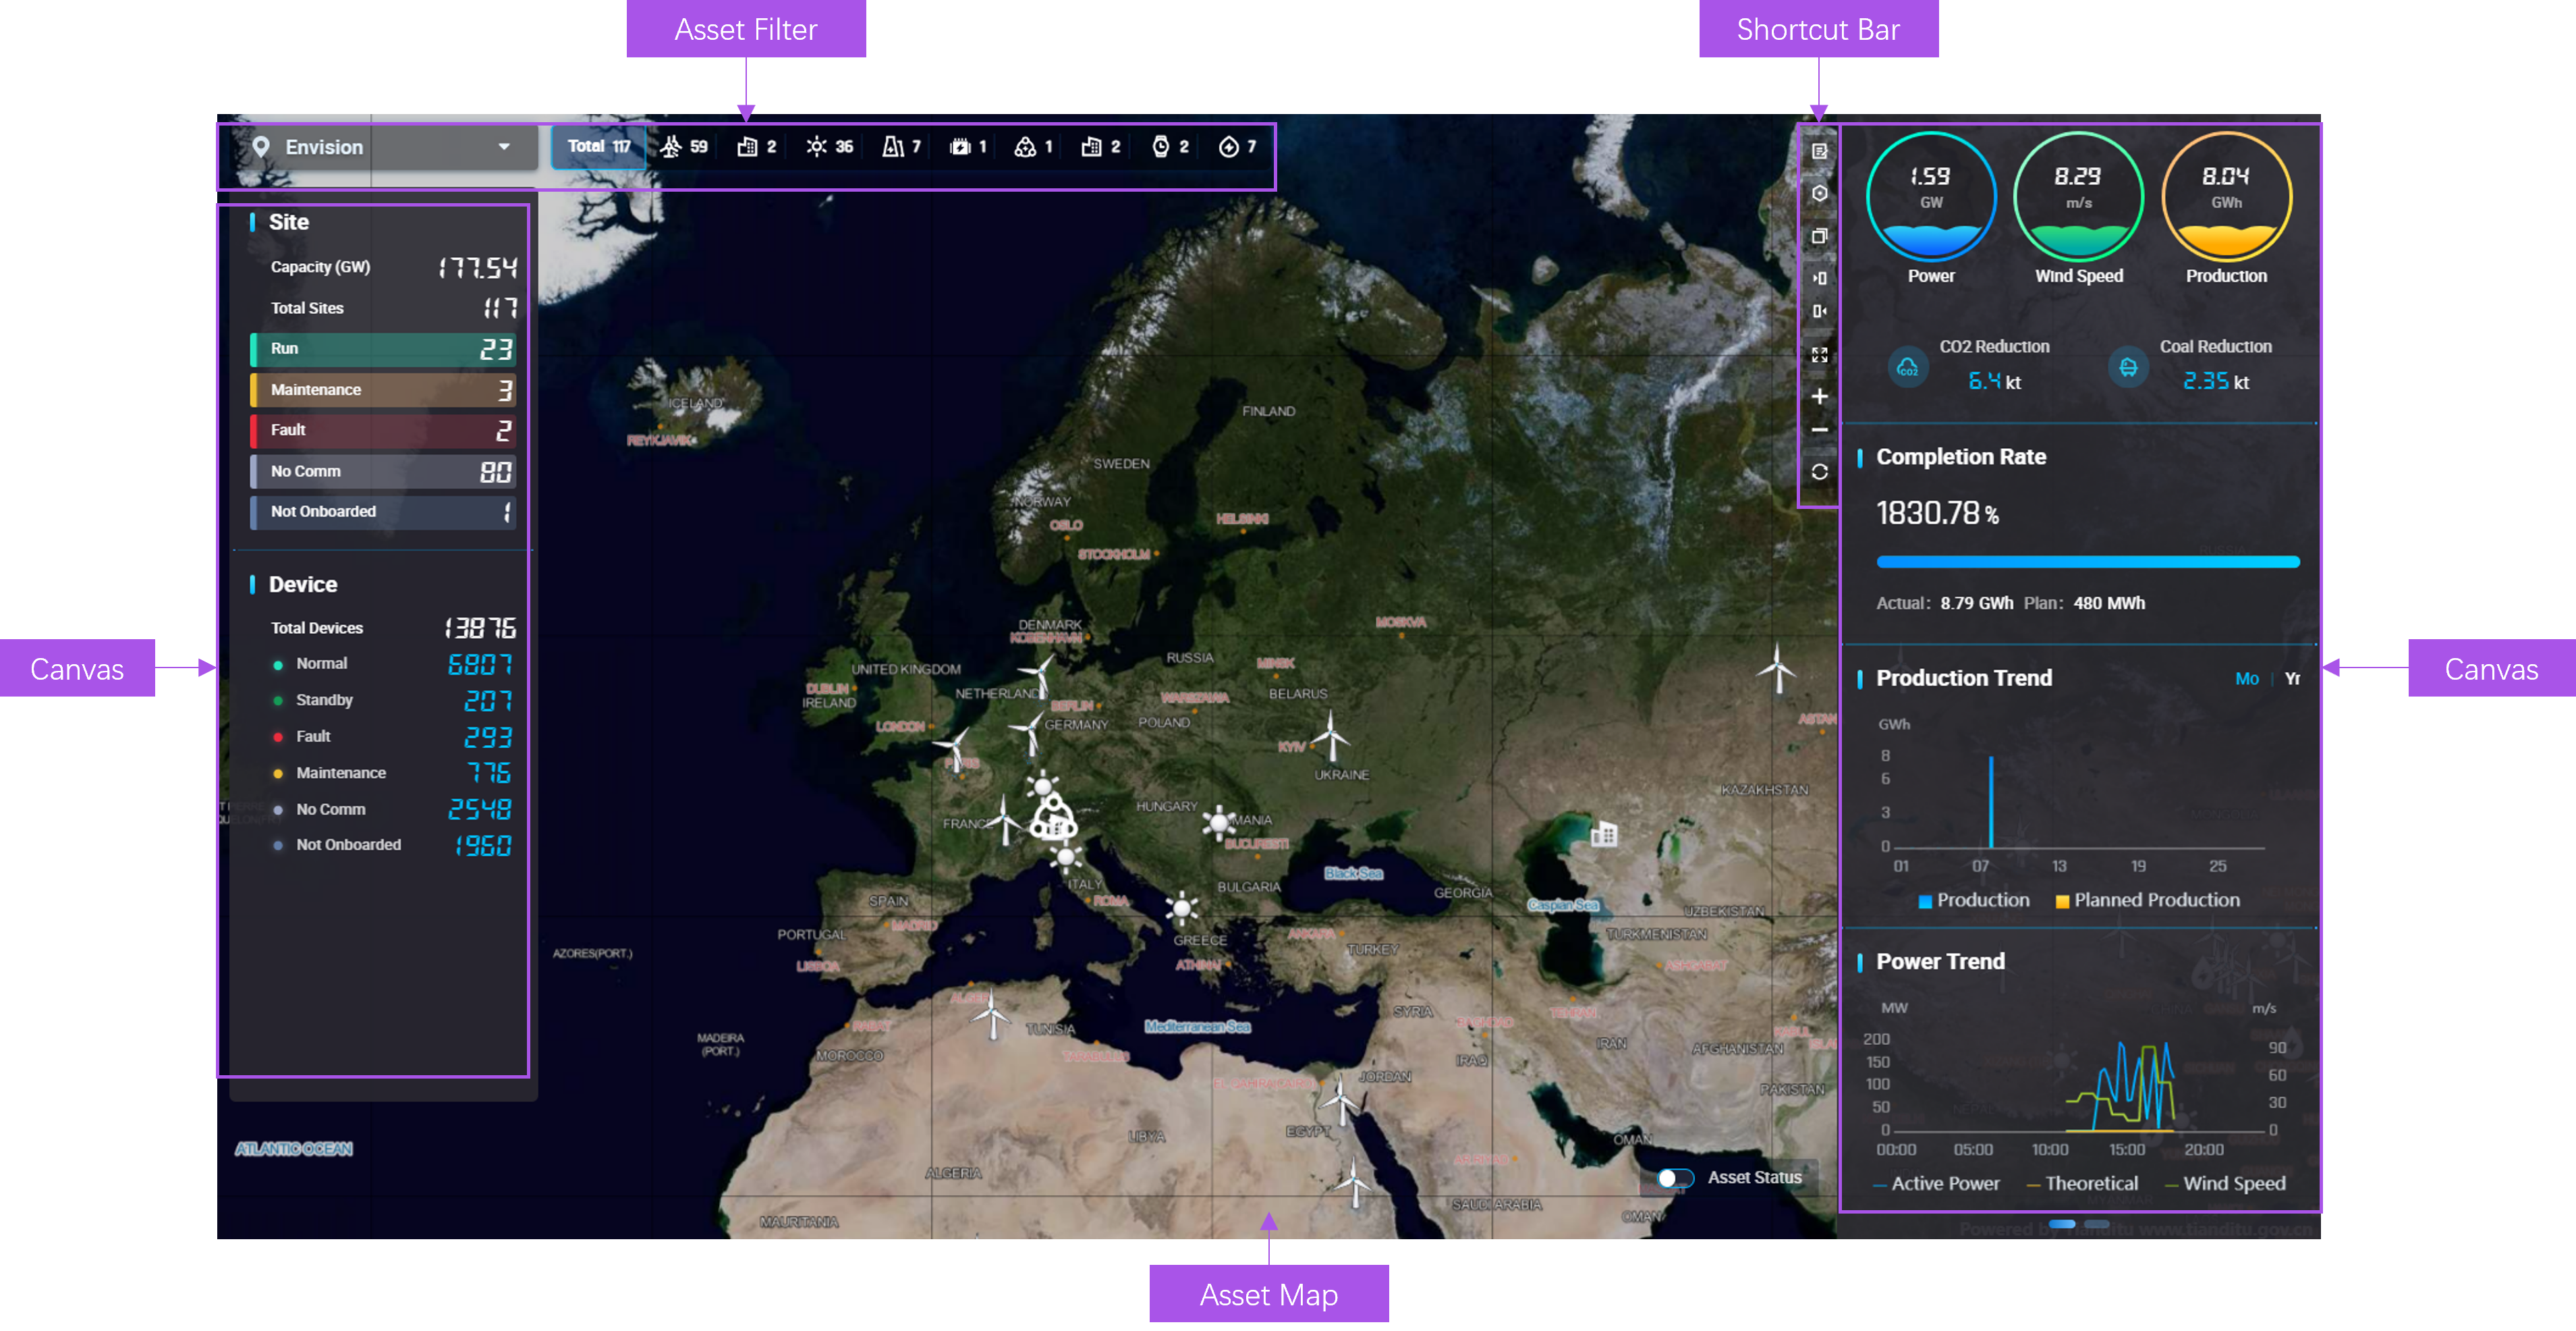
The Portfolio page contains the following components.
Component |
Description |
|---|---|
Asset Filter |
Filter the target assets by name or type. |
Asset Map |
Display the location and status of assets, supporting operations such as dragging, zoom-in, and zoom-out. |
Shortcut Bar |
Contain the functional icons to perform tasks including expanding/folding canvas, enabling/disabling full screen, and configuring page functions. |
Canvas |
Display visualized widgets. |
Exploring Asset Map
Asset map displays the geographical information of all assets in the current asset hierarchy (group, region, or site). An asset map is as follows.
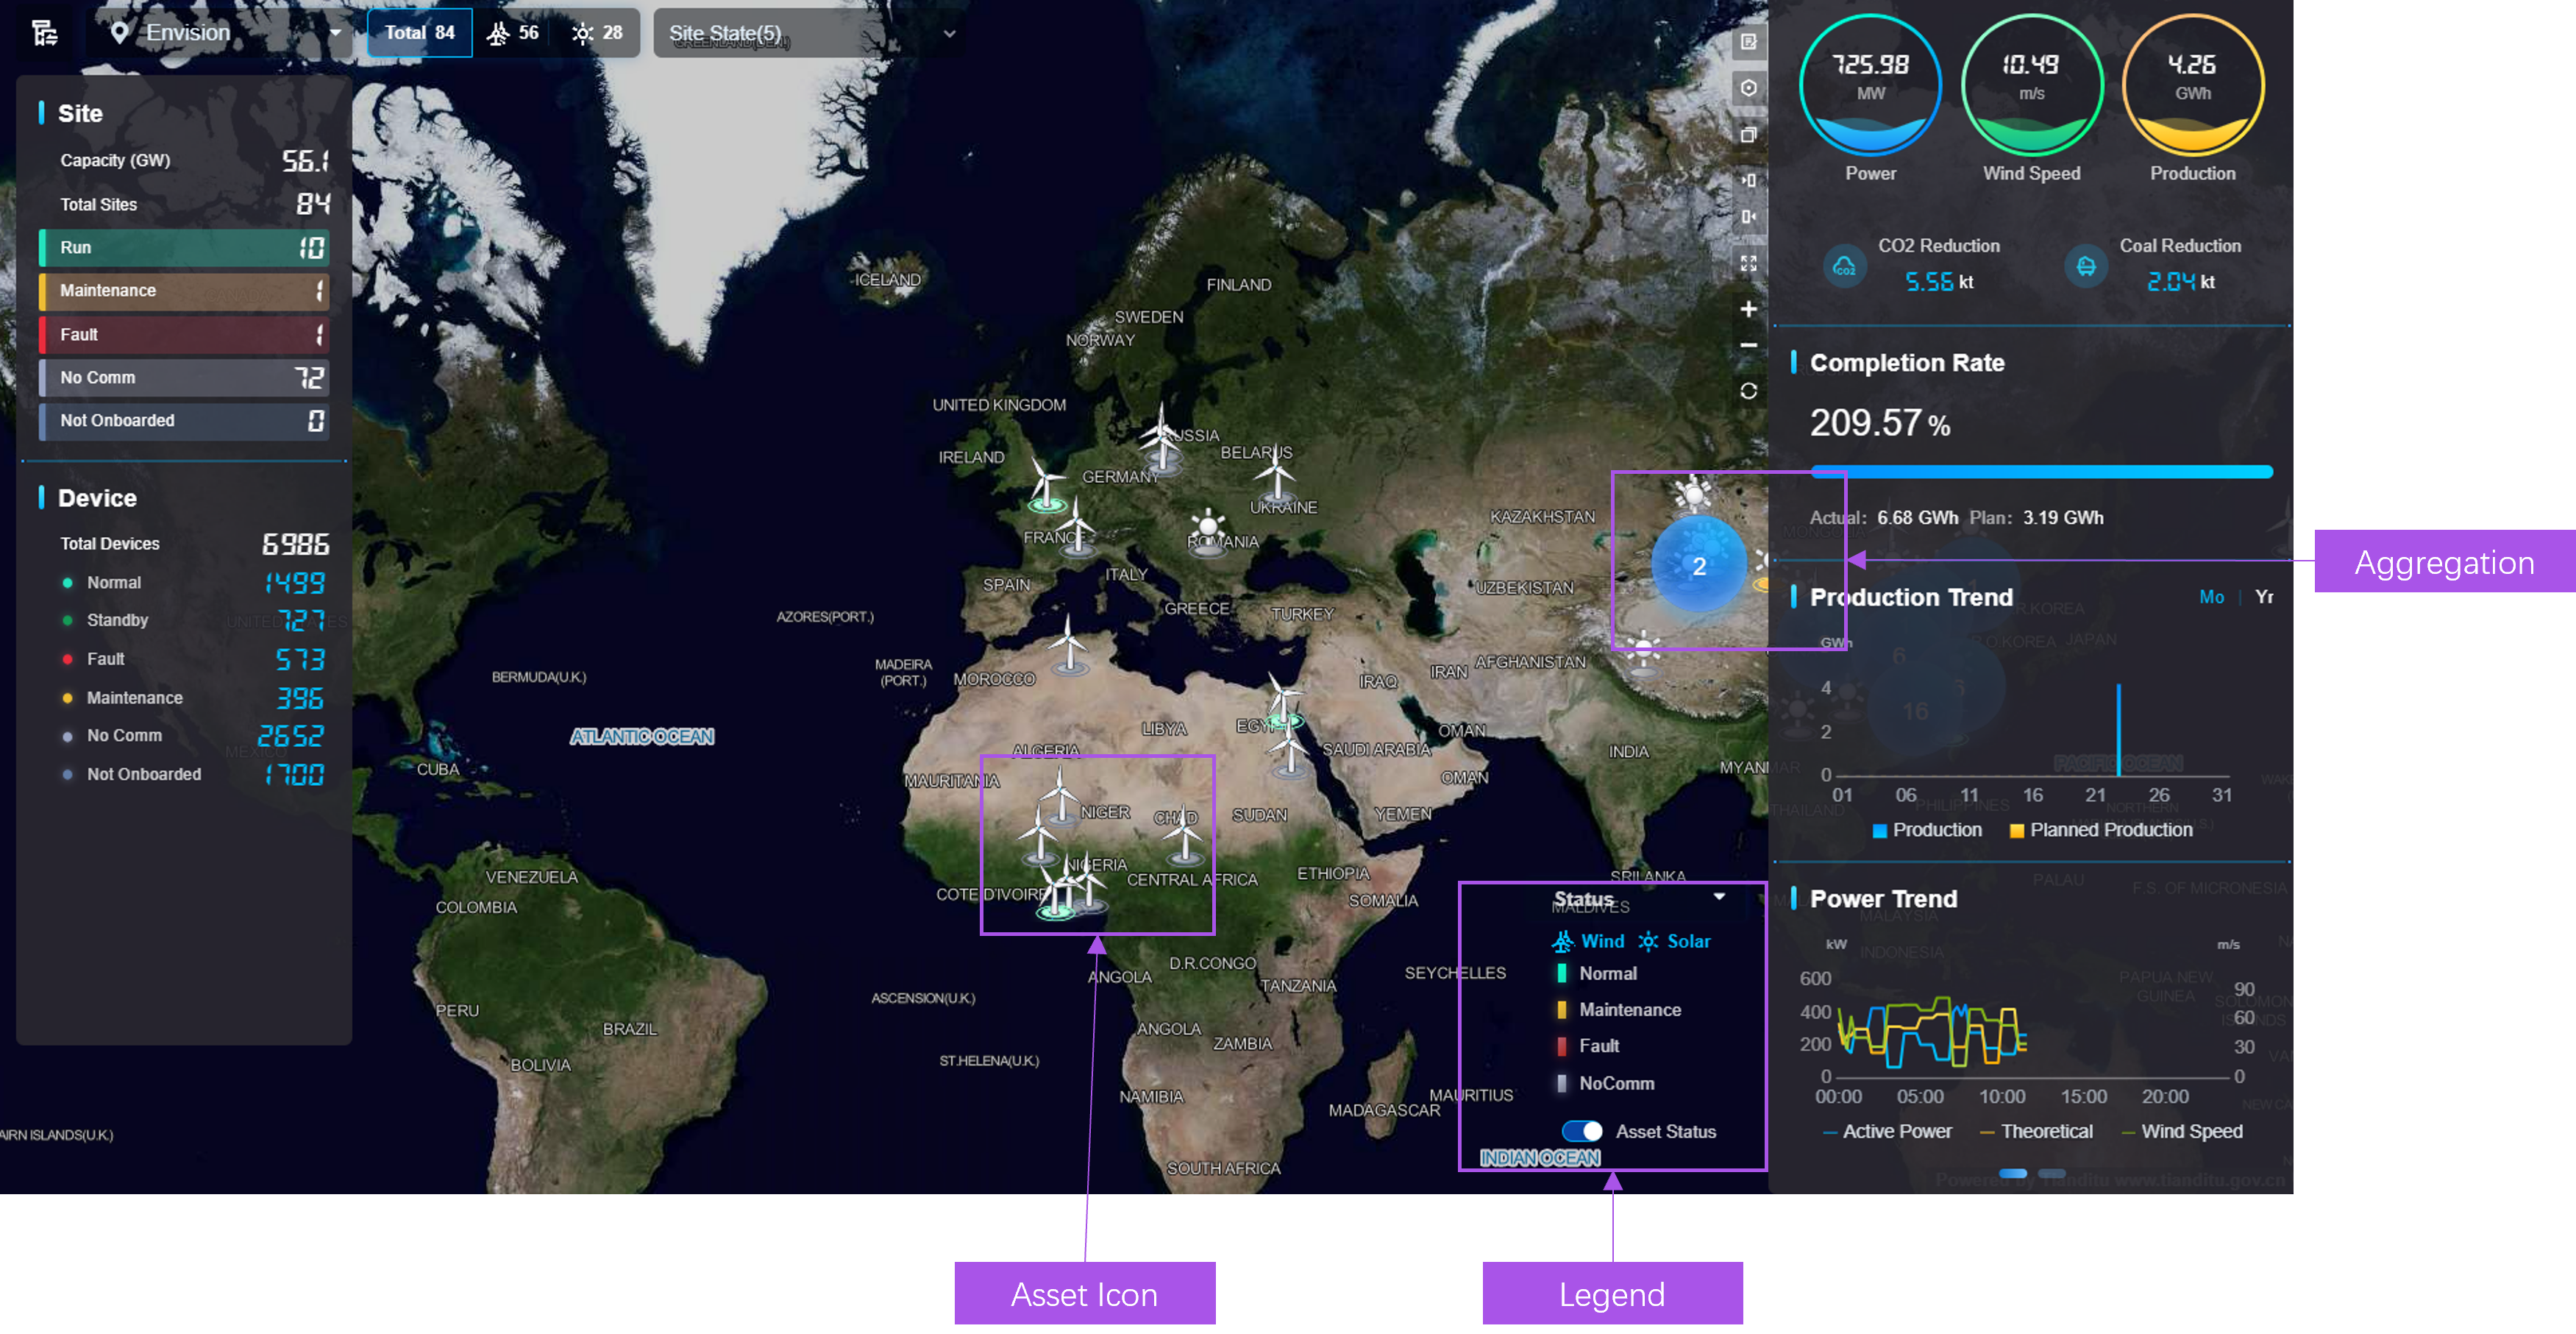
An asset map contains the following components.
Component |
Description |
|---|---|
Asset Icon |
|
Aggregation |
|
Legend |
|
Exploring Asset List
Asset List provides region, site, and device lists in multiple domains, and displays the related data of asset attributes, measurement points, and metrics. Asset List includes:
Region List: display the data of each region in list style.
Site List: display the data of sites in a specified region in list or card style.
Device List: display the data of devices in specified sites in list or card style.
Exploring Asset List in List Style
The list style of an asset list is as follows.
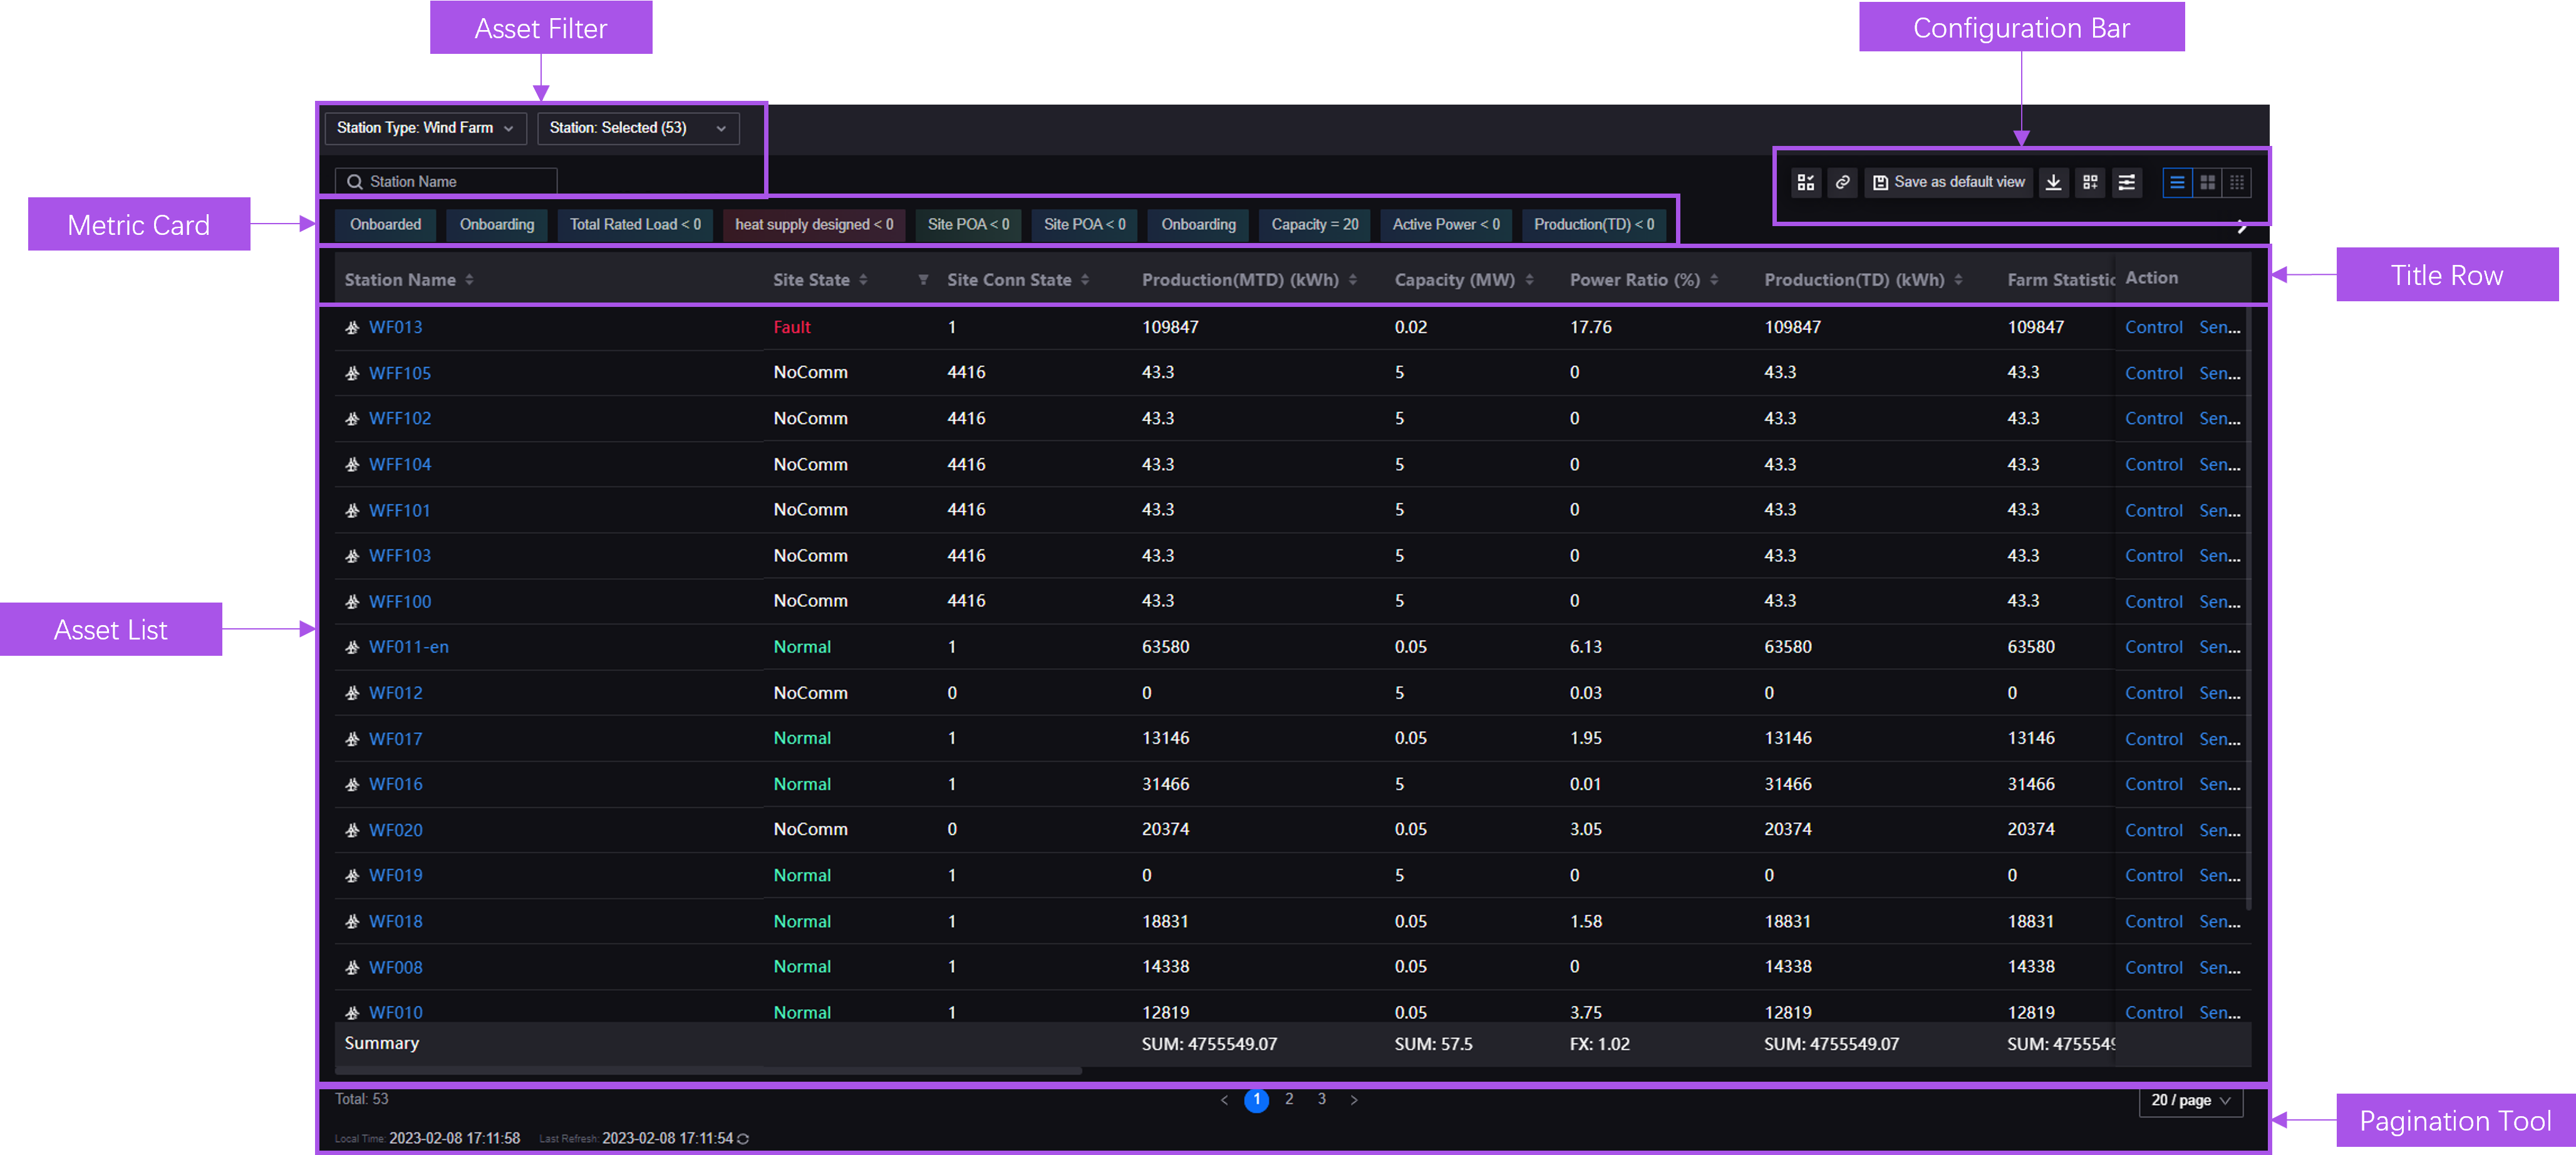
A list style asset list contains the following components.
Component |
Description |
|---|---|
Asset Filter |
Filter the target assets by type or name. |
Metric Card |
Filter the assets of which the data meet the specified conditions. |
Configuration Bar |
Provide function buttons including list configuration, data export, and column settings. |
Asset List |
Display the list with assets and related data, supporting operations such as ranking assets and adjusting column width. |
Title Row |
|
Pagination Bar |
|
Exploring Asset List in Card Style
The card style of an asset list is as follows.
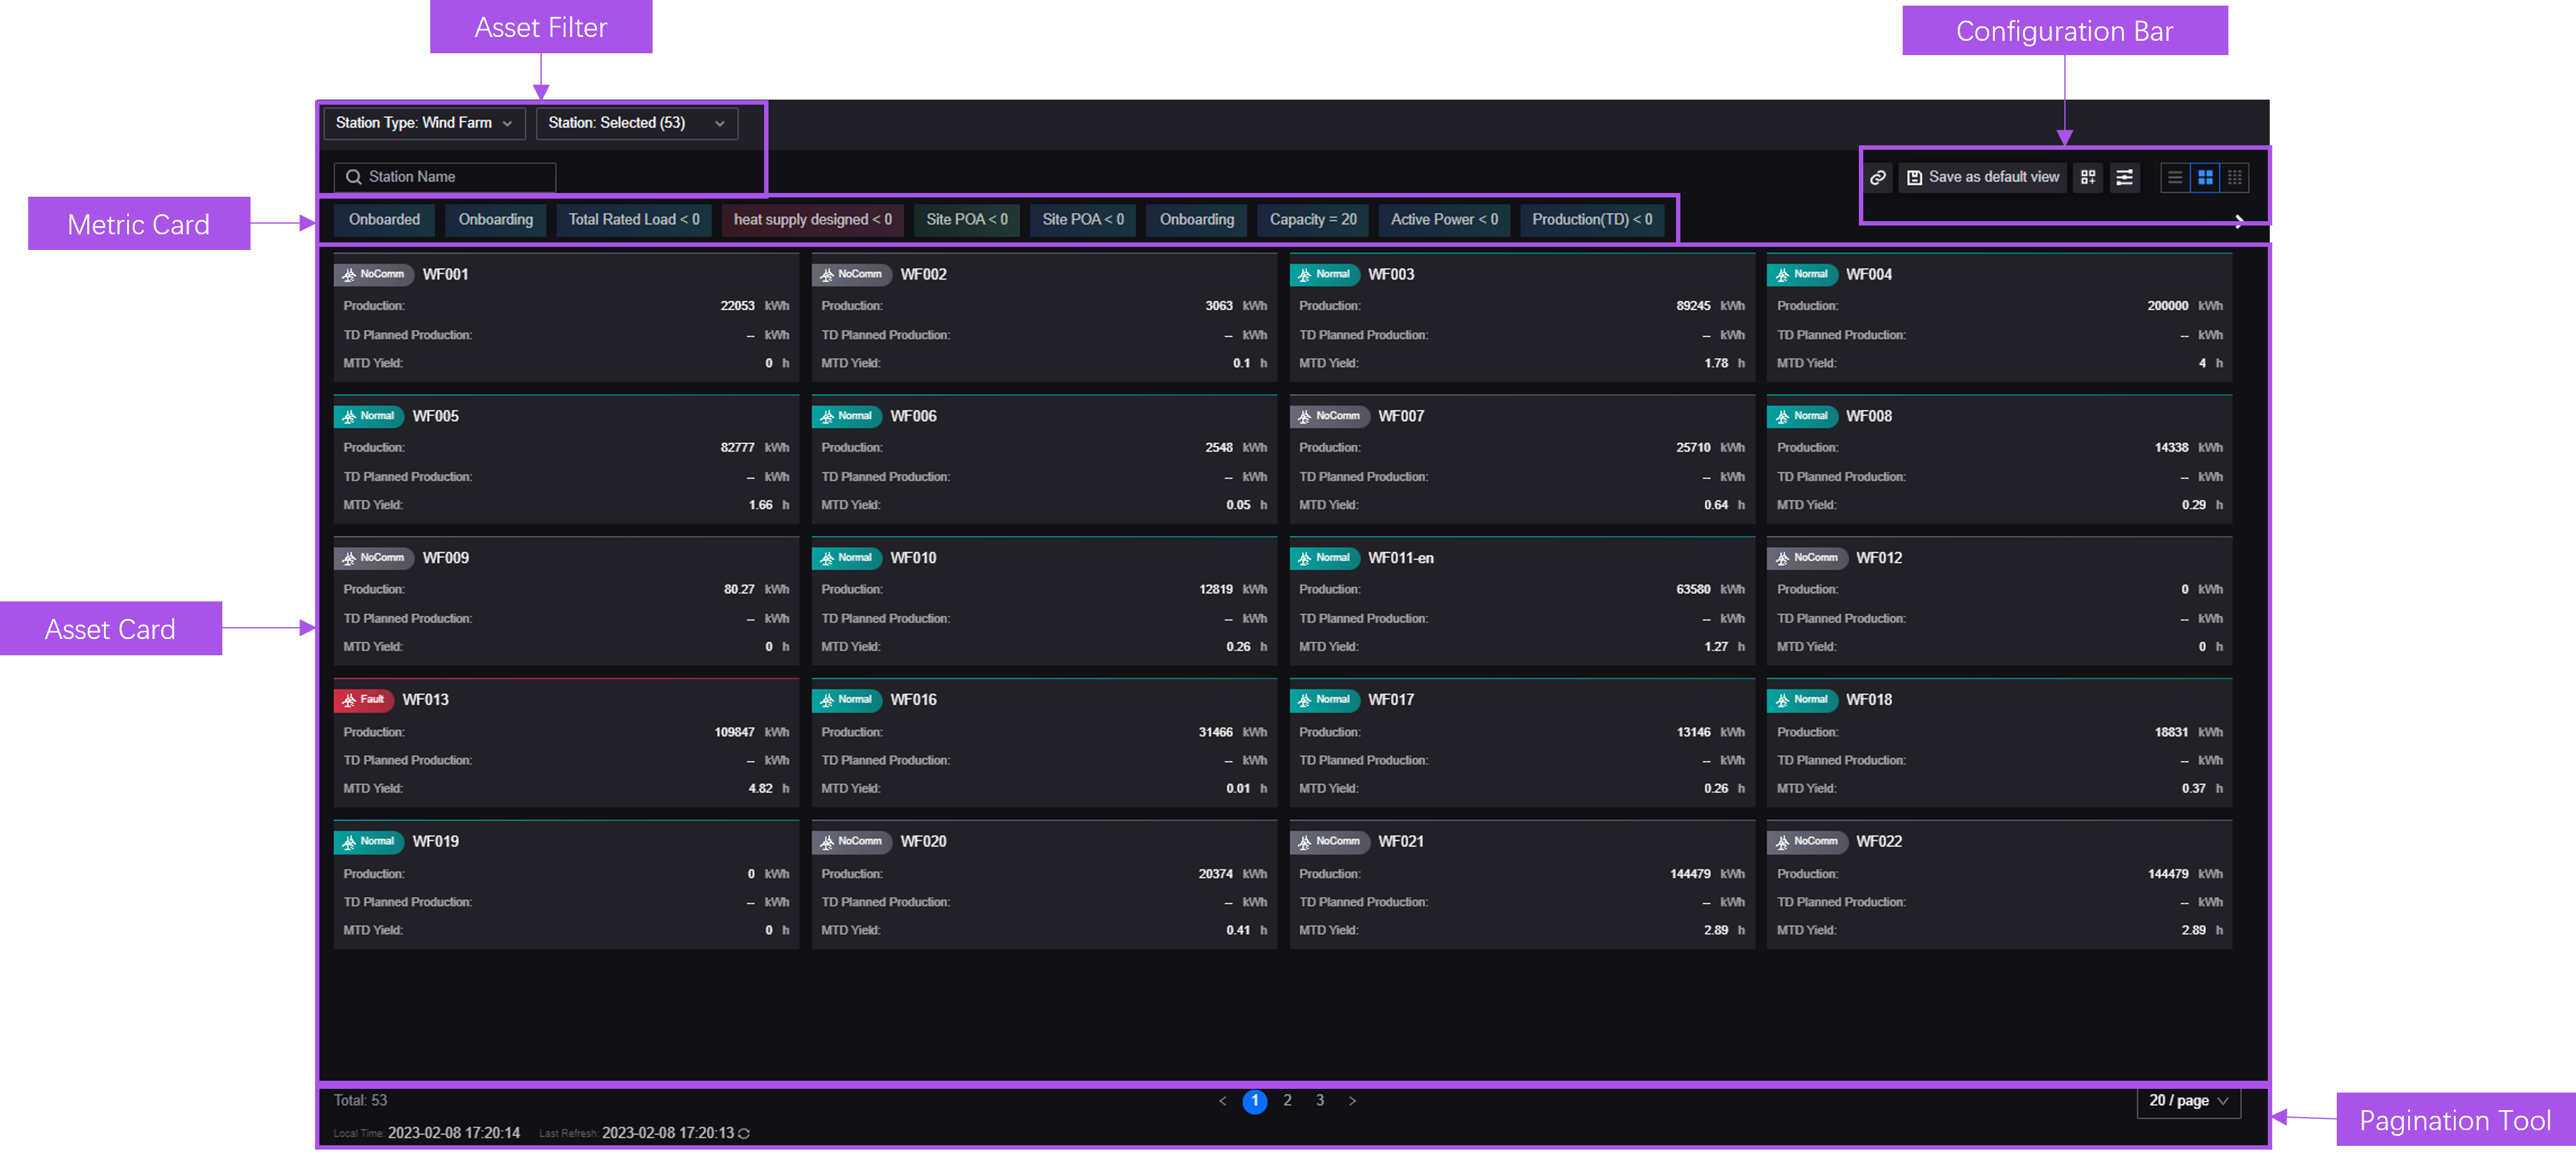
A card style asset list contains the following components.
Component |
Description |
|---|---|
Asset Filter |
Filter the target assets by information such as type or name. |
Metric Card |
Filter and locate key data. |
Configuration Bar |
Provide function buttons including list configuration, data export, and column settings. |
Asset Card |
Display the basic information and metric data of assets. |
Pagination Bar |
|
Exploring Charting Tool
Charting Tool provides visualized charts to display the data trends of devices in sites or site groups during a specified time range. a configured Charting Tool page is as follows.
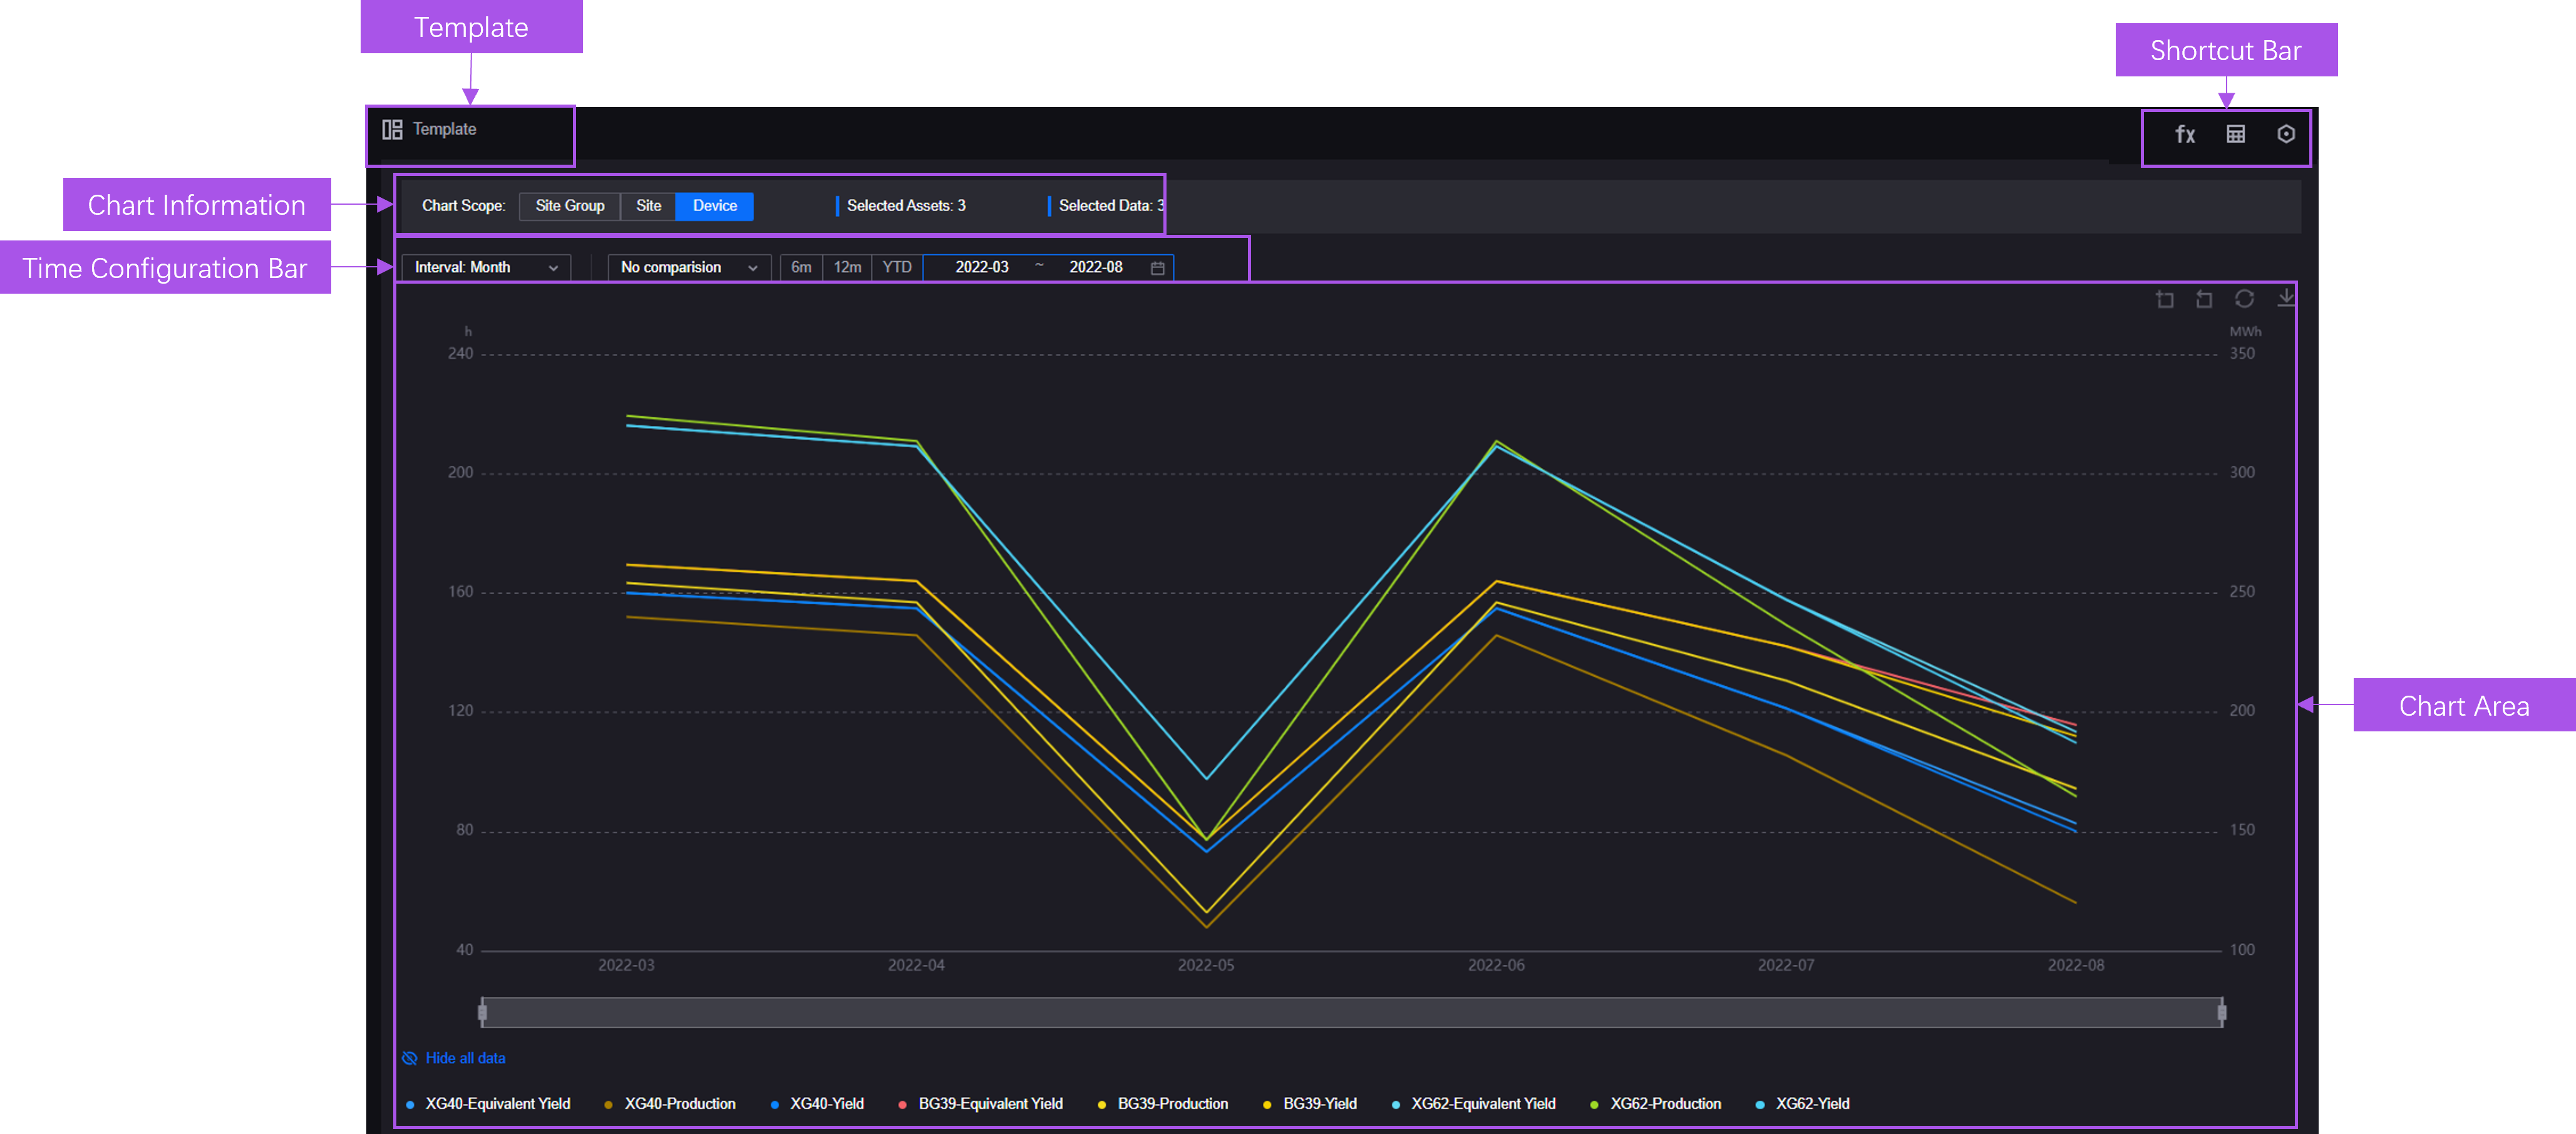
A Charting Tool page contains the following components.
Components |
Description |
|---|---|
Template |
View and apply the templates of asset data charts. |
Chart Information |
Display the basic information including scope, amount of assets, and amount of data fields. |
Time Configuration Bar |
Configure time-related information such as time period. |
Chart Area |
Provide chart, time scroll, legends, and editing bar to configure the chart, reset the chart, or export data in the chart. |
Shortcut Bar |
Perform operations including analyzing data, displaying data in a table, and saving the current chart as a template. |
Exploring Common KPI Inquiry
provide asset reports to display the properties and data of devices. A configured Common KPI Inquiry page is as follows.
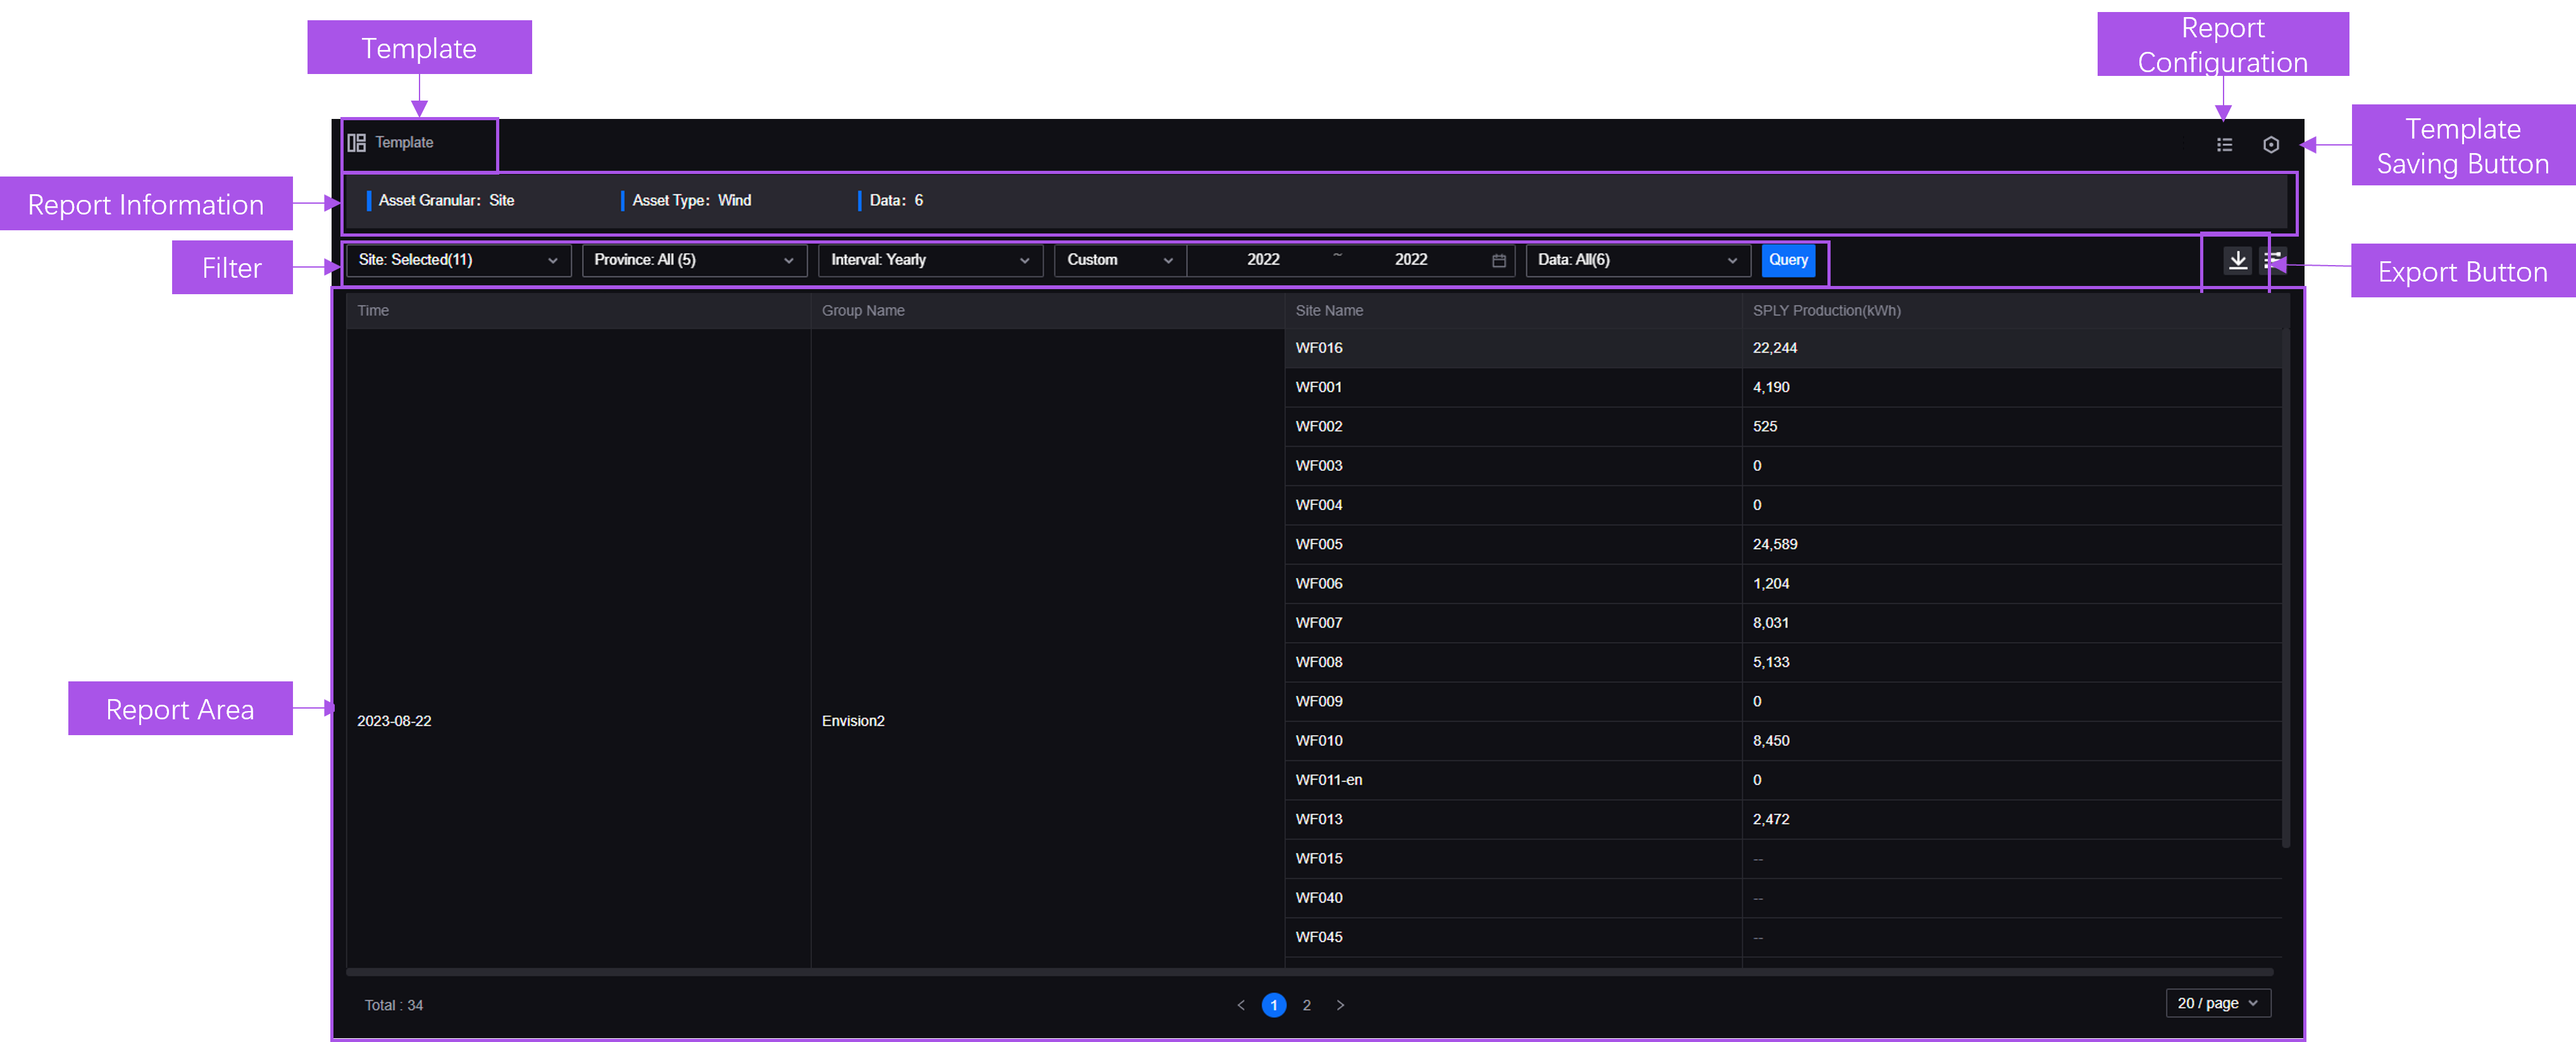
A Common KPI Inquiry page contains the following components.
Component |
Description |
|---|---|
Filter |
Filter the target asset data by information such as time period and asset type. |
Report Information |
Display the basic information including scope, number of asset, and number of data. |
Report Area |
Display the current report. |
Export |
Export the data of the current report. |
Template Saving Button |
Save the configuration of the current report as a template. |
Template |
View and apply the templates of metric query reports. |
Report Configuration |
Configure report information including filter and style. |
Exploring Landing Page
Landing Page supports building visualized monitoring pages and functions such as multi-layer asset filter, multi-dimensional time filter, and real-time page editor. A configured Landing Page is as follows.
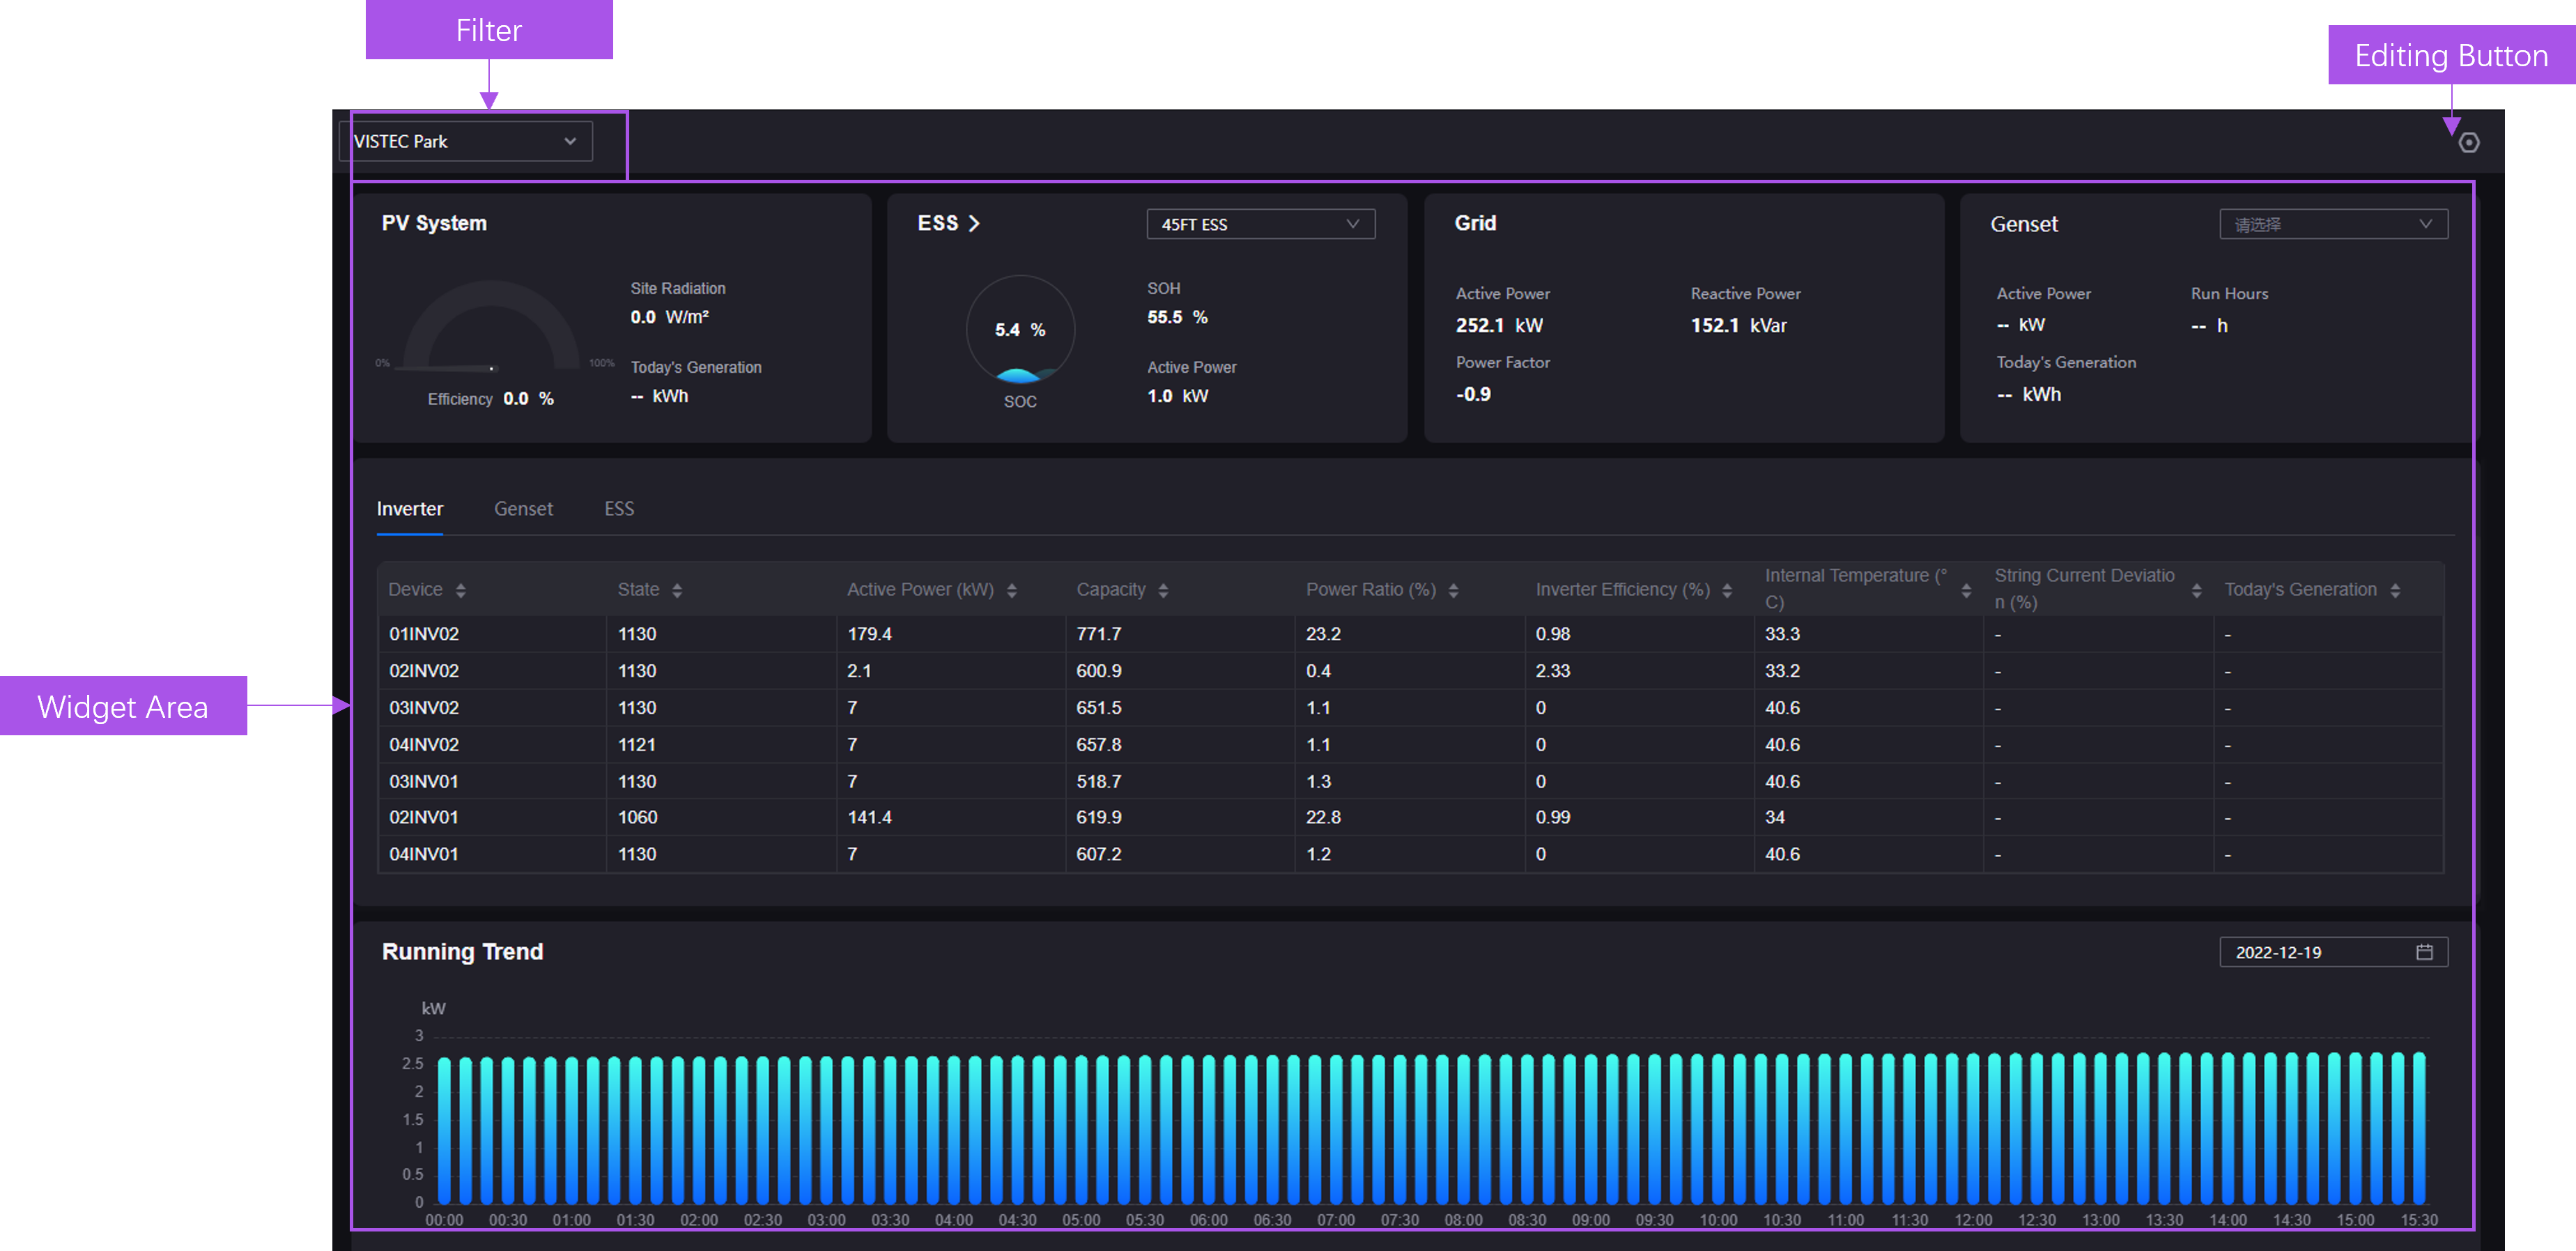
A Landing Page contains the following components.
Component |
Description |
|---|---|
Asset Filter |
Filter assets in multiple types and layers. |
Widget Area |
Display visualized widgets. |
Editing Button |
Select the button to edit the page. |
Exploring Unified Asset Tree
Unified Asset Tree provides asset-oriented navigation, which can be associated with second-level menus and integrated into other monitoring pages to filter target assets. A configured Unified Asset Tree is as follows.
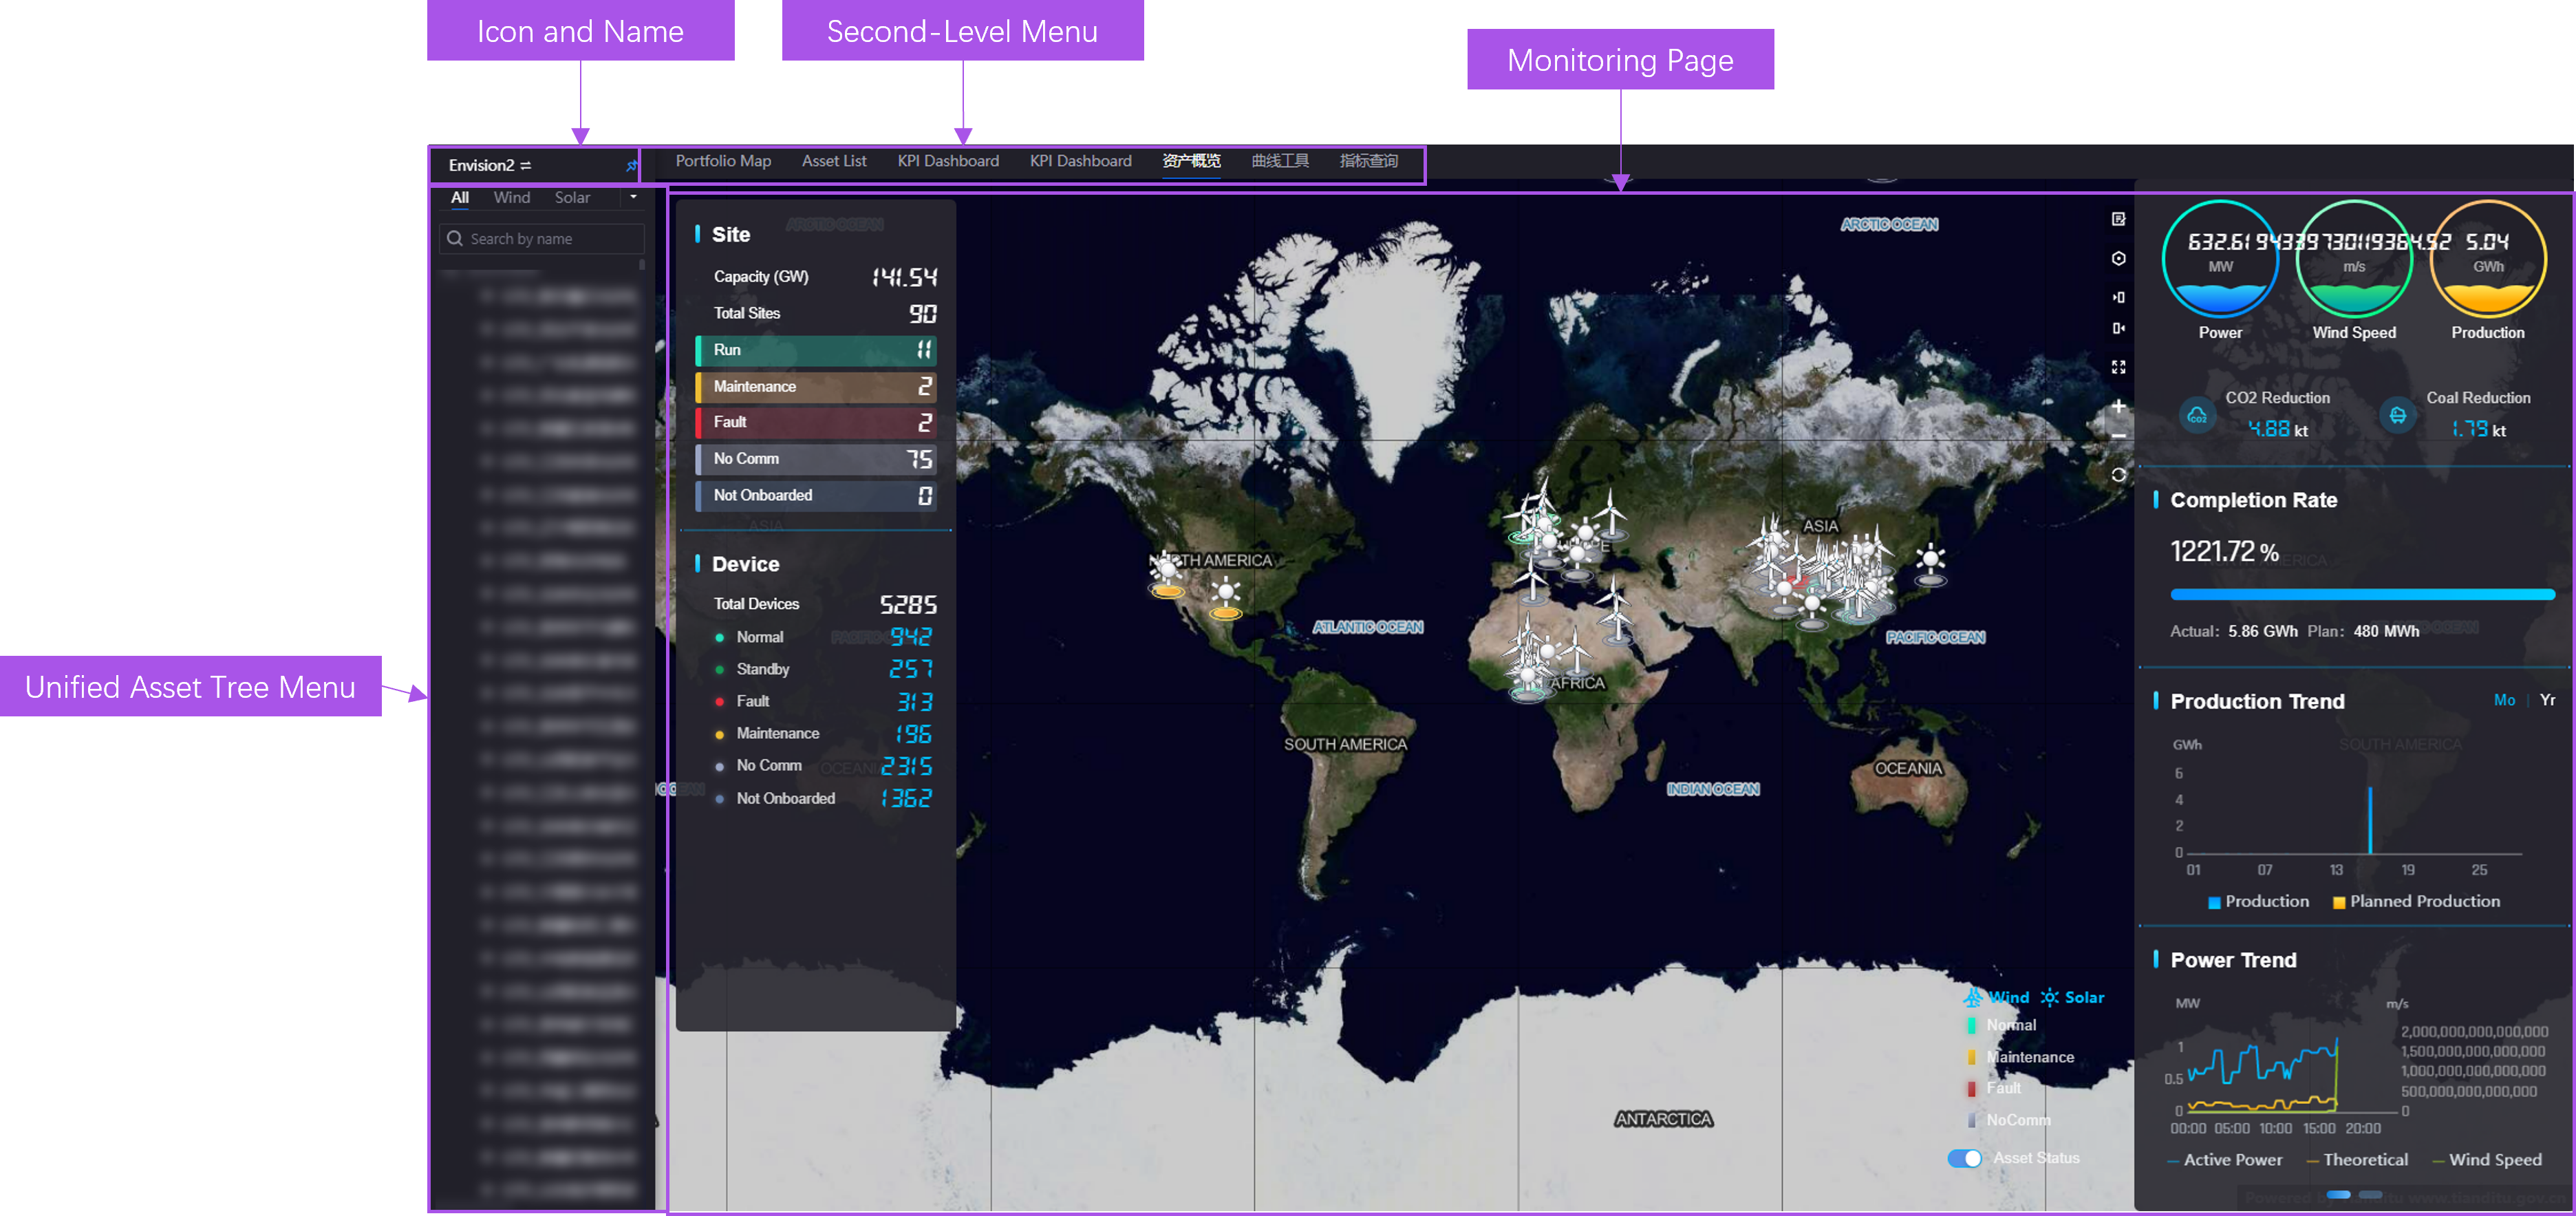
A Unified Asset Tree contains the following components.
Component |
Description |
|---|---|
Icon and Name |
Select the icon and name tag to expand/fold the Unified Asset Tree. |
Unified Asset Tree Menu |
Display the assets by layer in the current asset tree. Supporting filtering assets by selecting asset type tags and searching assets by name. |
Second-Level Menu |
Select the second-level menu associated to the asset tree to open the related monitoring page. |
Monitoring Page |
Display the contents of the page associated to the Unified Asset Tree. |