Cartesian Coordinate System Chart
Cartesian coordinate system chart now supports two types of charts:
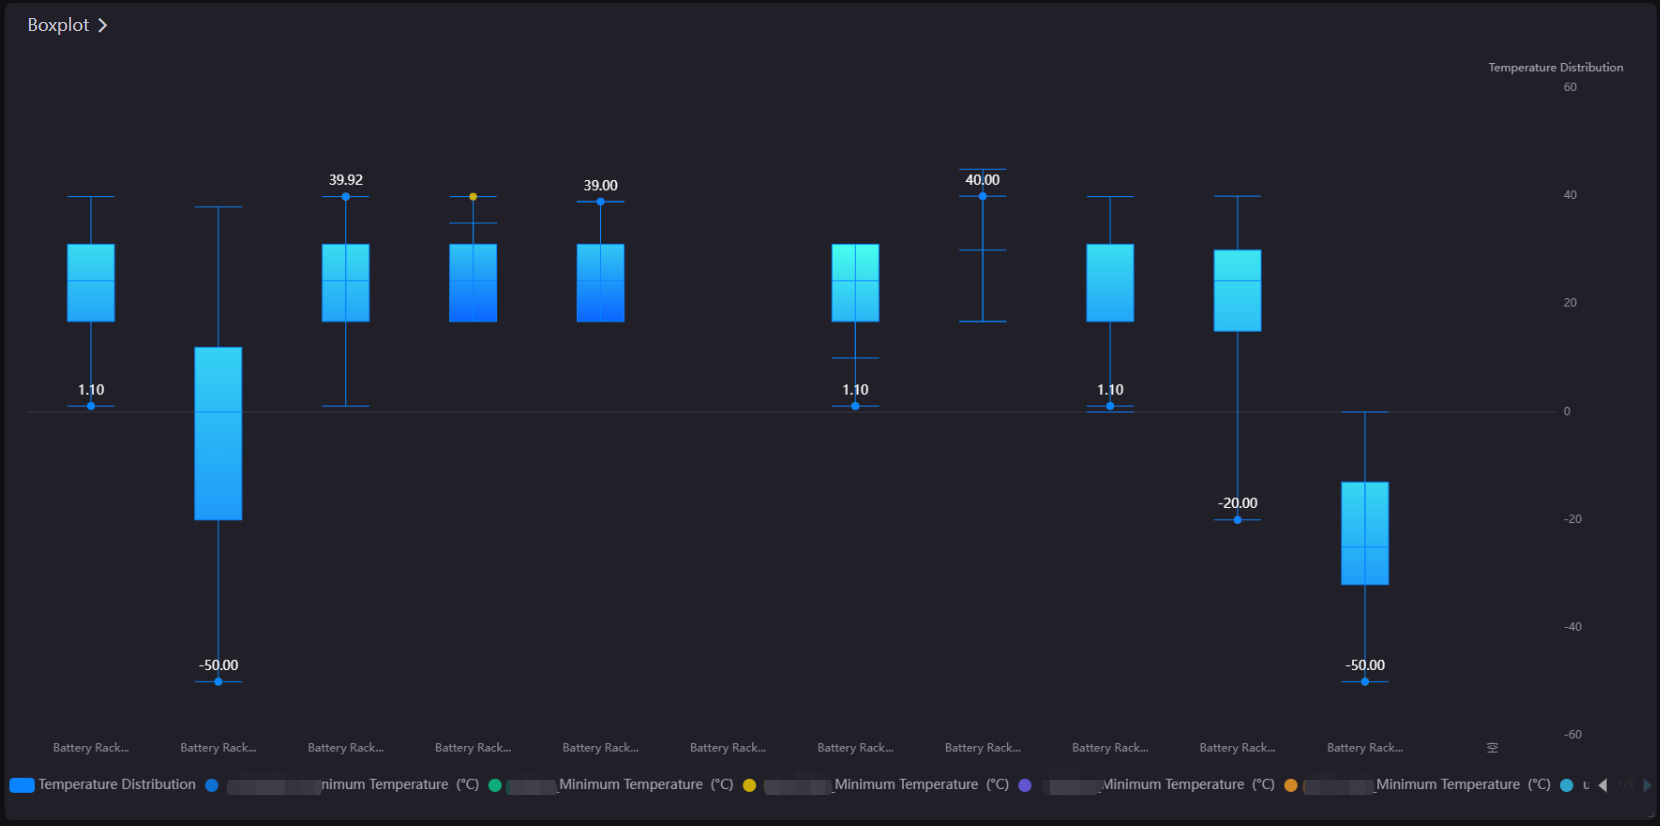
Boxplot Chart: shows a statistical chart of a set of data dispersion information. It is mainly used to show the data distribution, and also allows comparison of multiple data distribution groups. For example, in the energy storage scenario, the boxplot chart can show the maximum, minimum, median, maximum 1/4 value, and minimum 1/4 value of all the battery clusters of an energy storage system over a period of time.
Scatter Chart: helps to show extreme data points by supporting the boxplot chart.
Data Fields
The data fields required are:
Field |
Quantity |
|---|---|
Dimension |
1 - 2 |
Comparison |
0 - 1 |
Measurement |
Unlimited. The recommended number of boxplot chart is 5. |
Extension |
Unlimited |
Chart Style
Set the style of the Cartesian Coordinate System Chart and match the data fields.
Field |
Description |
|---|---|
Layout |
Set the chart orientation to vertical or horizontal. The main function is with the box line direction of the boxplot chart. |
Series |
Add series, choose from boxplot or scatter chart. |
Boxplot |
|
Scatter |
|
Axis Style
Field |
Description |
|---|---|
Name |
Specify the name or unit of the axes. |
Dynamic Unit [1] |
Select this to automatically use the suitable unit for your data values, and to automatically adjust the values on the axes. |
Axis Range [1] |
Specify the minimum and maximum values on the axes, and the number of labels between them. |
Axis Font |
Style the axis name font. |
Unit Font |
Style the unit name font. |
Axis Line |
Style the line for the axes. |
Grid Line |
Style the grid lines for the axes. |
Show Scalar Bar |
Select to show a bar that can limit the range of data displayed on the axes. |
[1] Only available for Y-Axis.
Other Settings
Legend
Formats the legend. You can hide the legend by clicking preview button  .
.
Field |
Description |
|---|---|
Position |
Select the position of the legend. |
Size |
Specify the radii of the legend dots and the vertical spacing between them. Select Auto to automatically set the optimal size for the legend bar. |
Legend Font |
Style the text labels in the legend. |
Annotation
Different types of markers can be added: reference line, mark and highlight area.
Reference Line
Field |
Description |
|---|---|
Data Field |
Specify the data field you wish to add the reference line in. |
Type |
|
Line Format |
Style the line. |
Font |
Style the marked value. |
Mark
Data Field |
Specify the data field you wish to add the mark in. |
|---|---|
Type |
|
Color |
Select the color of mark. |
Size |
Set the size of the mark. |
Shape |
Set the shape of the mark. |
Font |
Style the marked value. |
Highlight Area
Field |
Description |
|---|---|
Linked Axis |
|
Data Field |
Specify the data field of highlight areas. You need to add related fields to Data Fields > Extension first. |
Identification Method |
|
Formatting Rules |
Specify the rules to highlight, including values or value ranges, displayed text, and highlight colors. |