Exploring Digital Twin Dashboard (DTD)
This article describes the main elements of DTD.
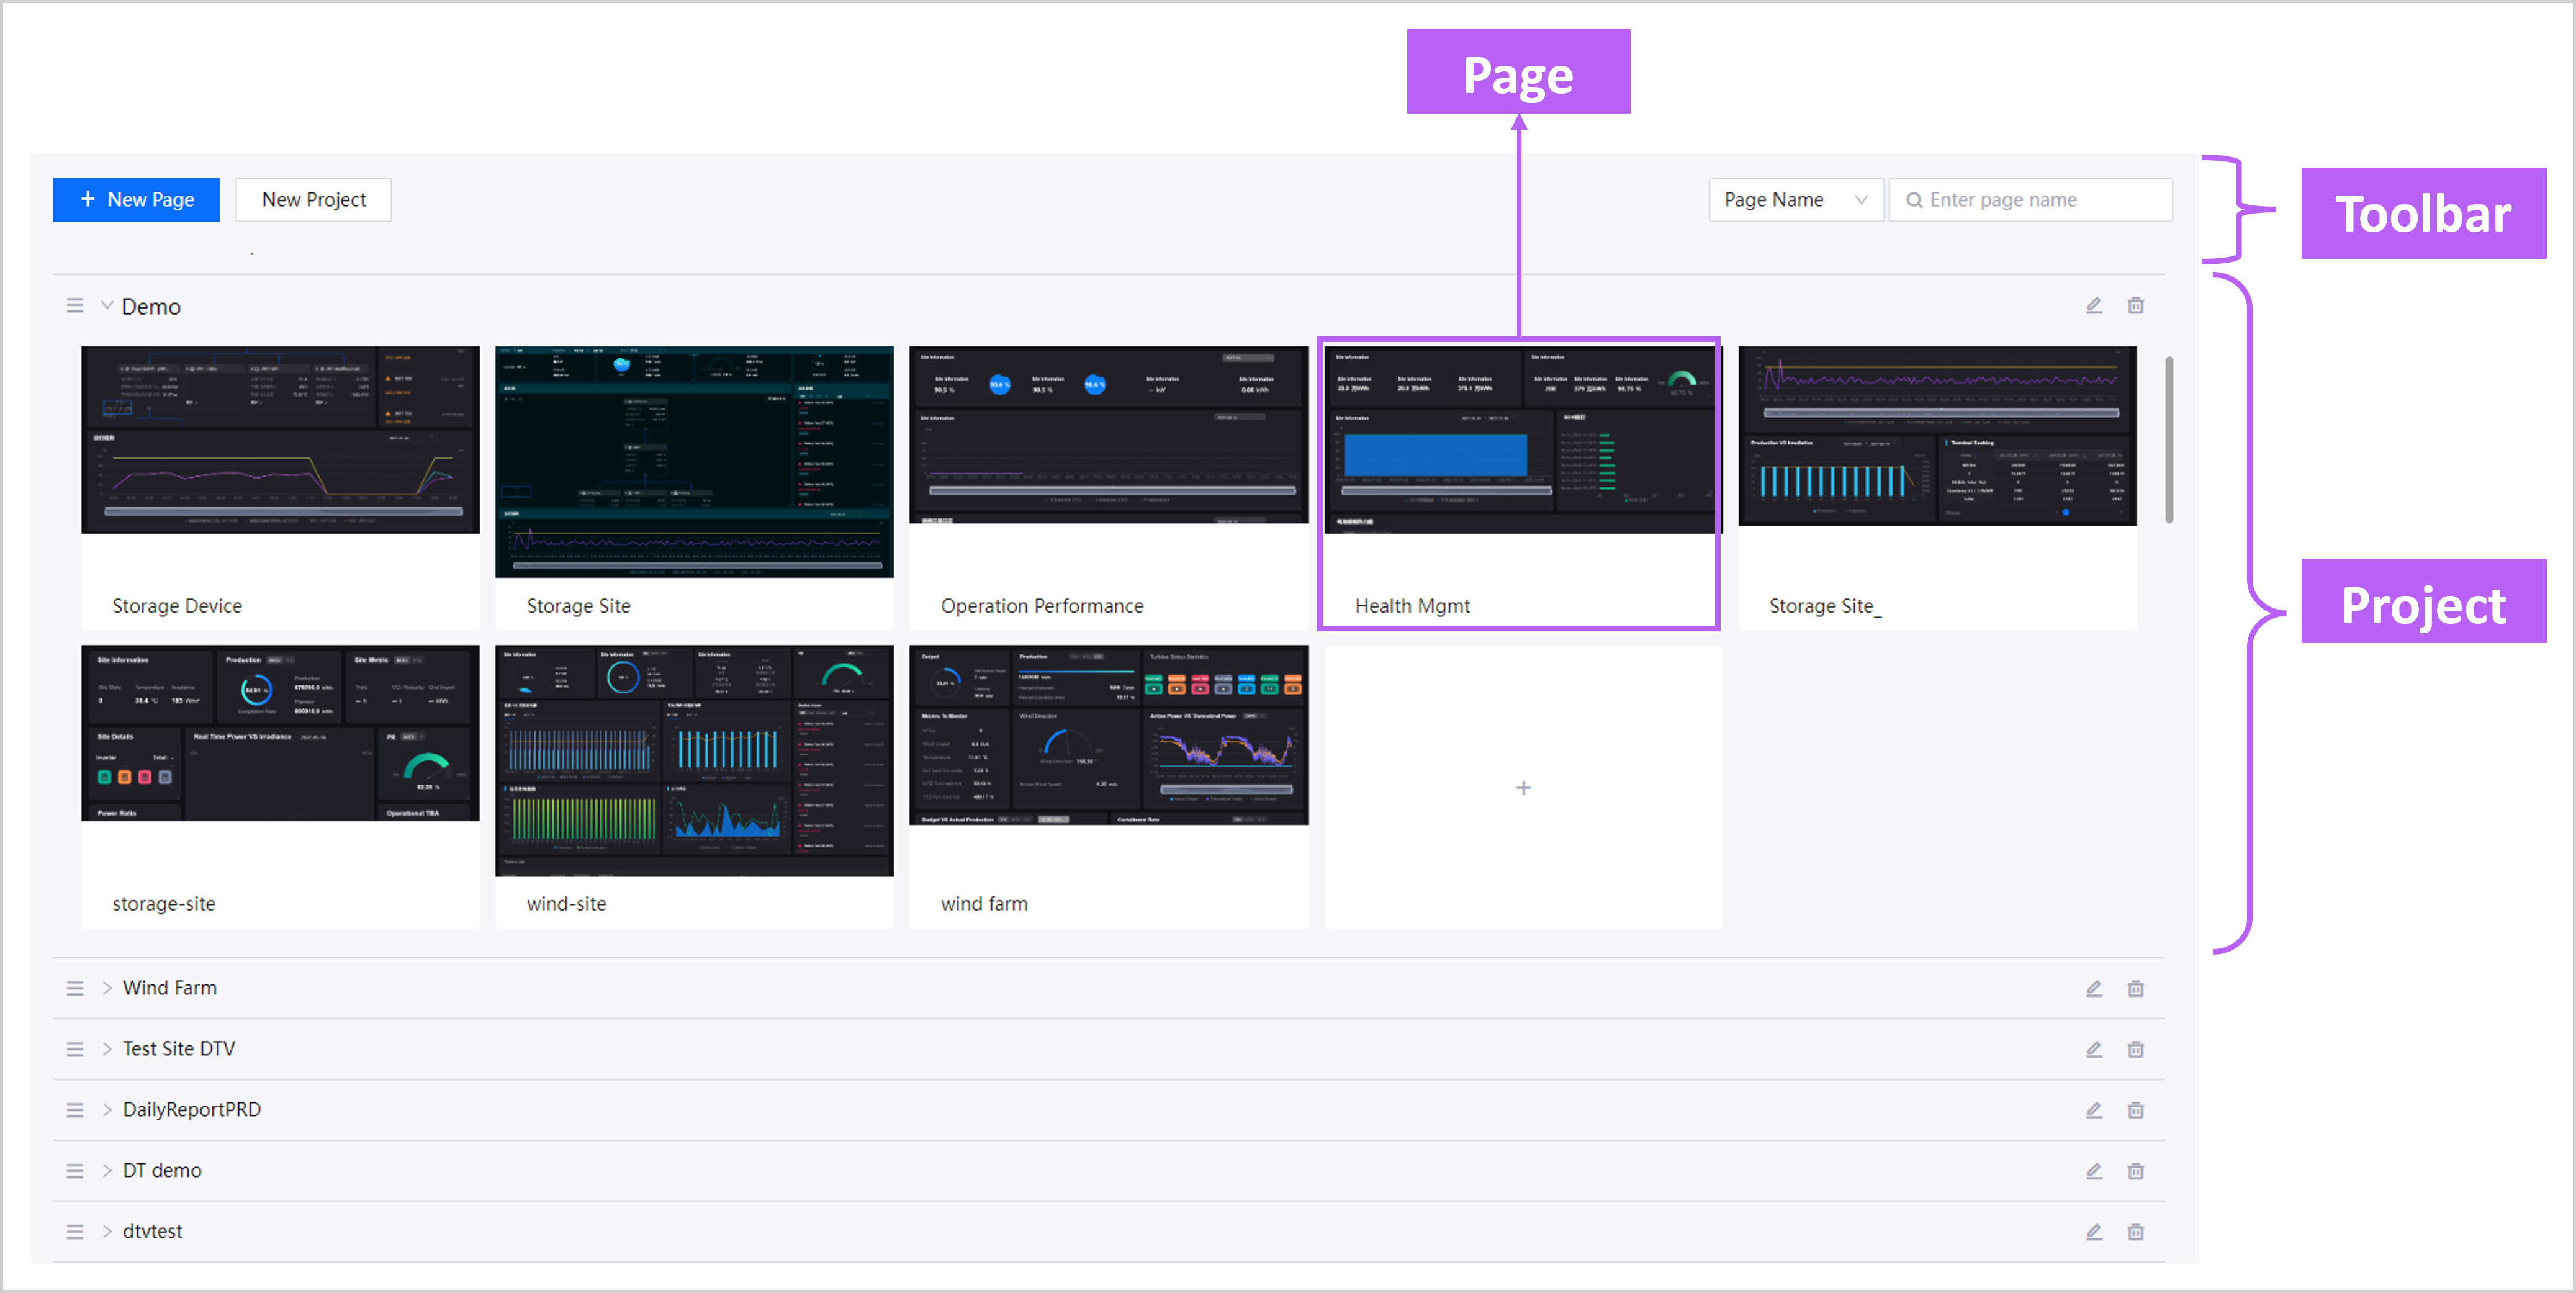
Project Editor
All projects can be viewed and edited in the project editor, and the content of each page can be viewed through the page preview cards.
Component |
Description |
|---|---|
Pages |
Show the contents through a card view. Hovering over the page card reveals several options, such as edit page, save page as a template, and publish page. |
Toolbar |
Enable you to add a new project, add a new page, and search for projects |
Projects |
Display the pages in the project as cards. You can also change project settings, delete the project or add a new page. |
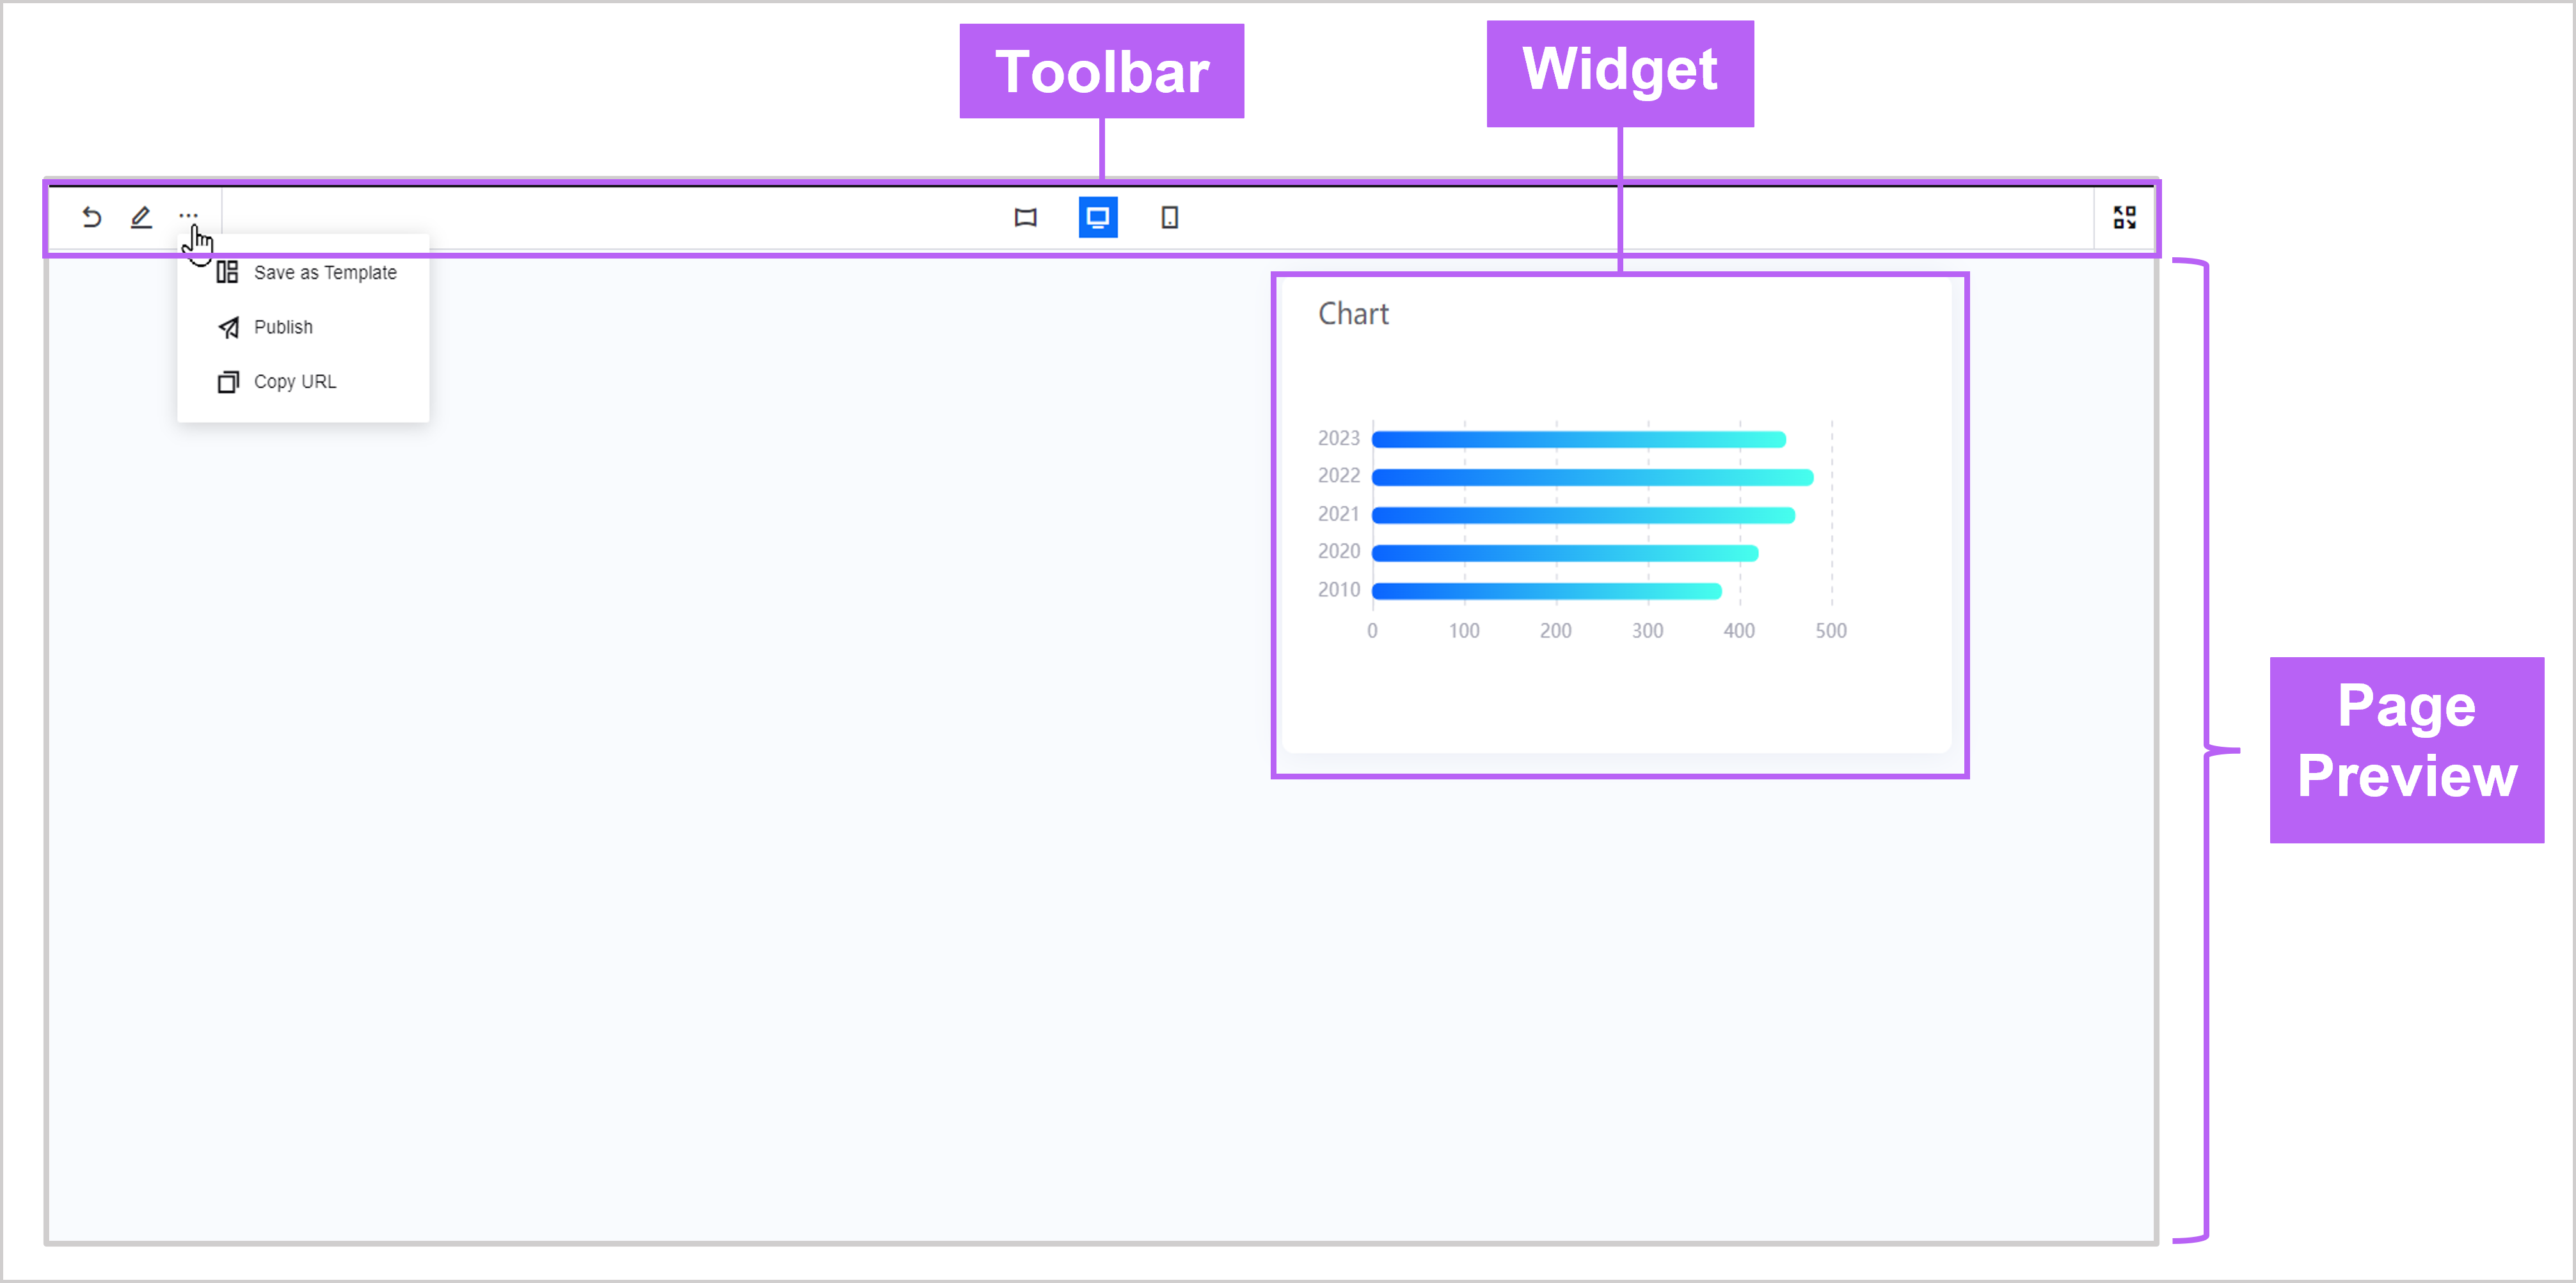
Page Editor
The Page Editor is used to manage dashboard projects. You can create widgets, customize them the way you like, and publish the final work for users to view.
On the Page Editor canvas, you can resize widgets by dragging their corners, and rearrange them by dragging them around.
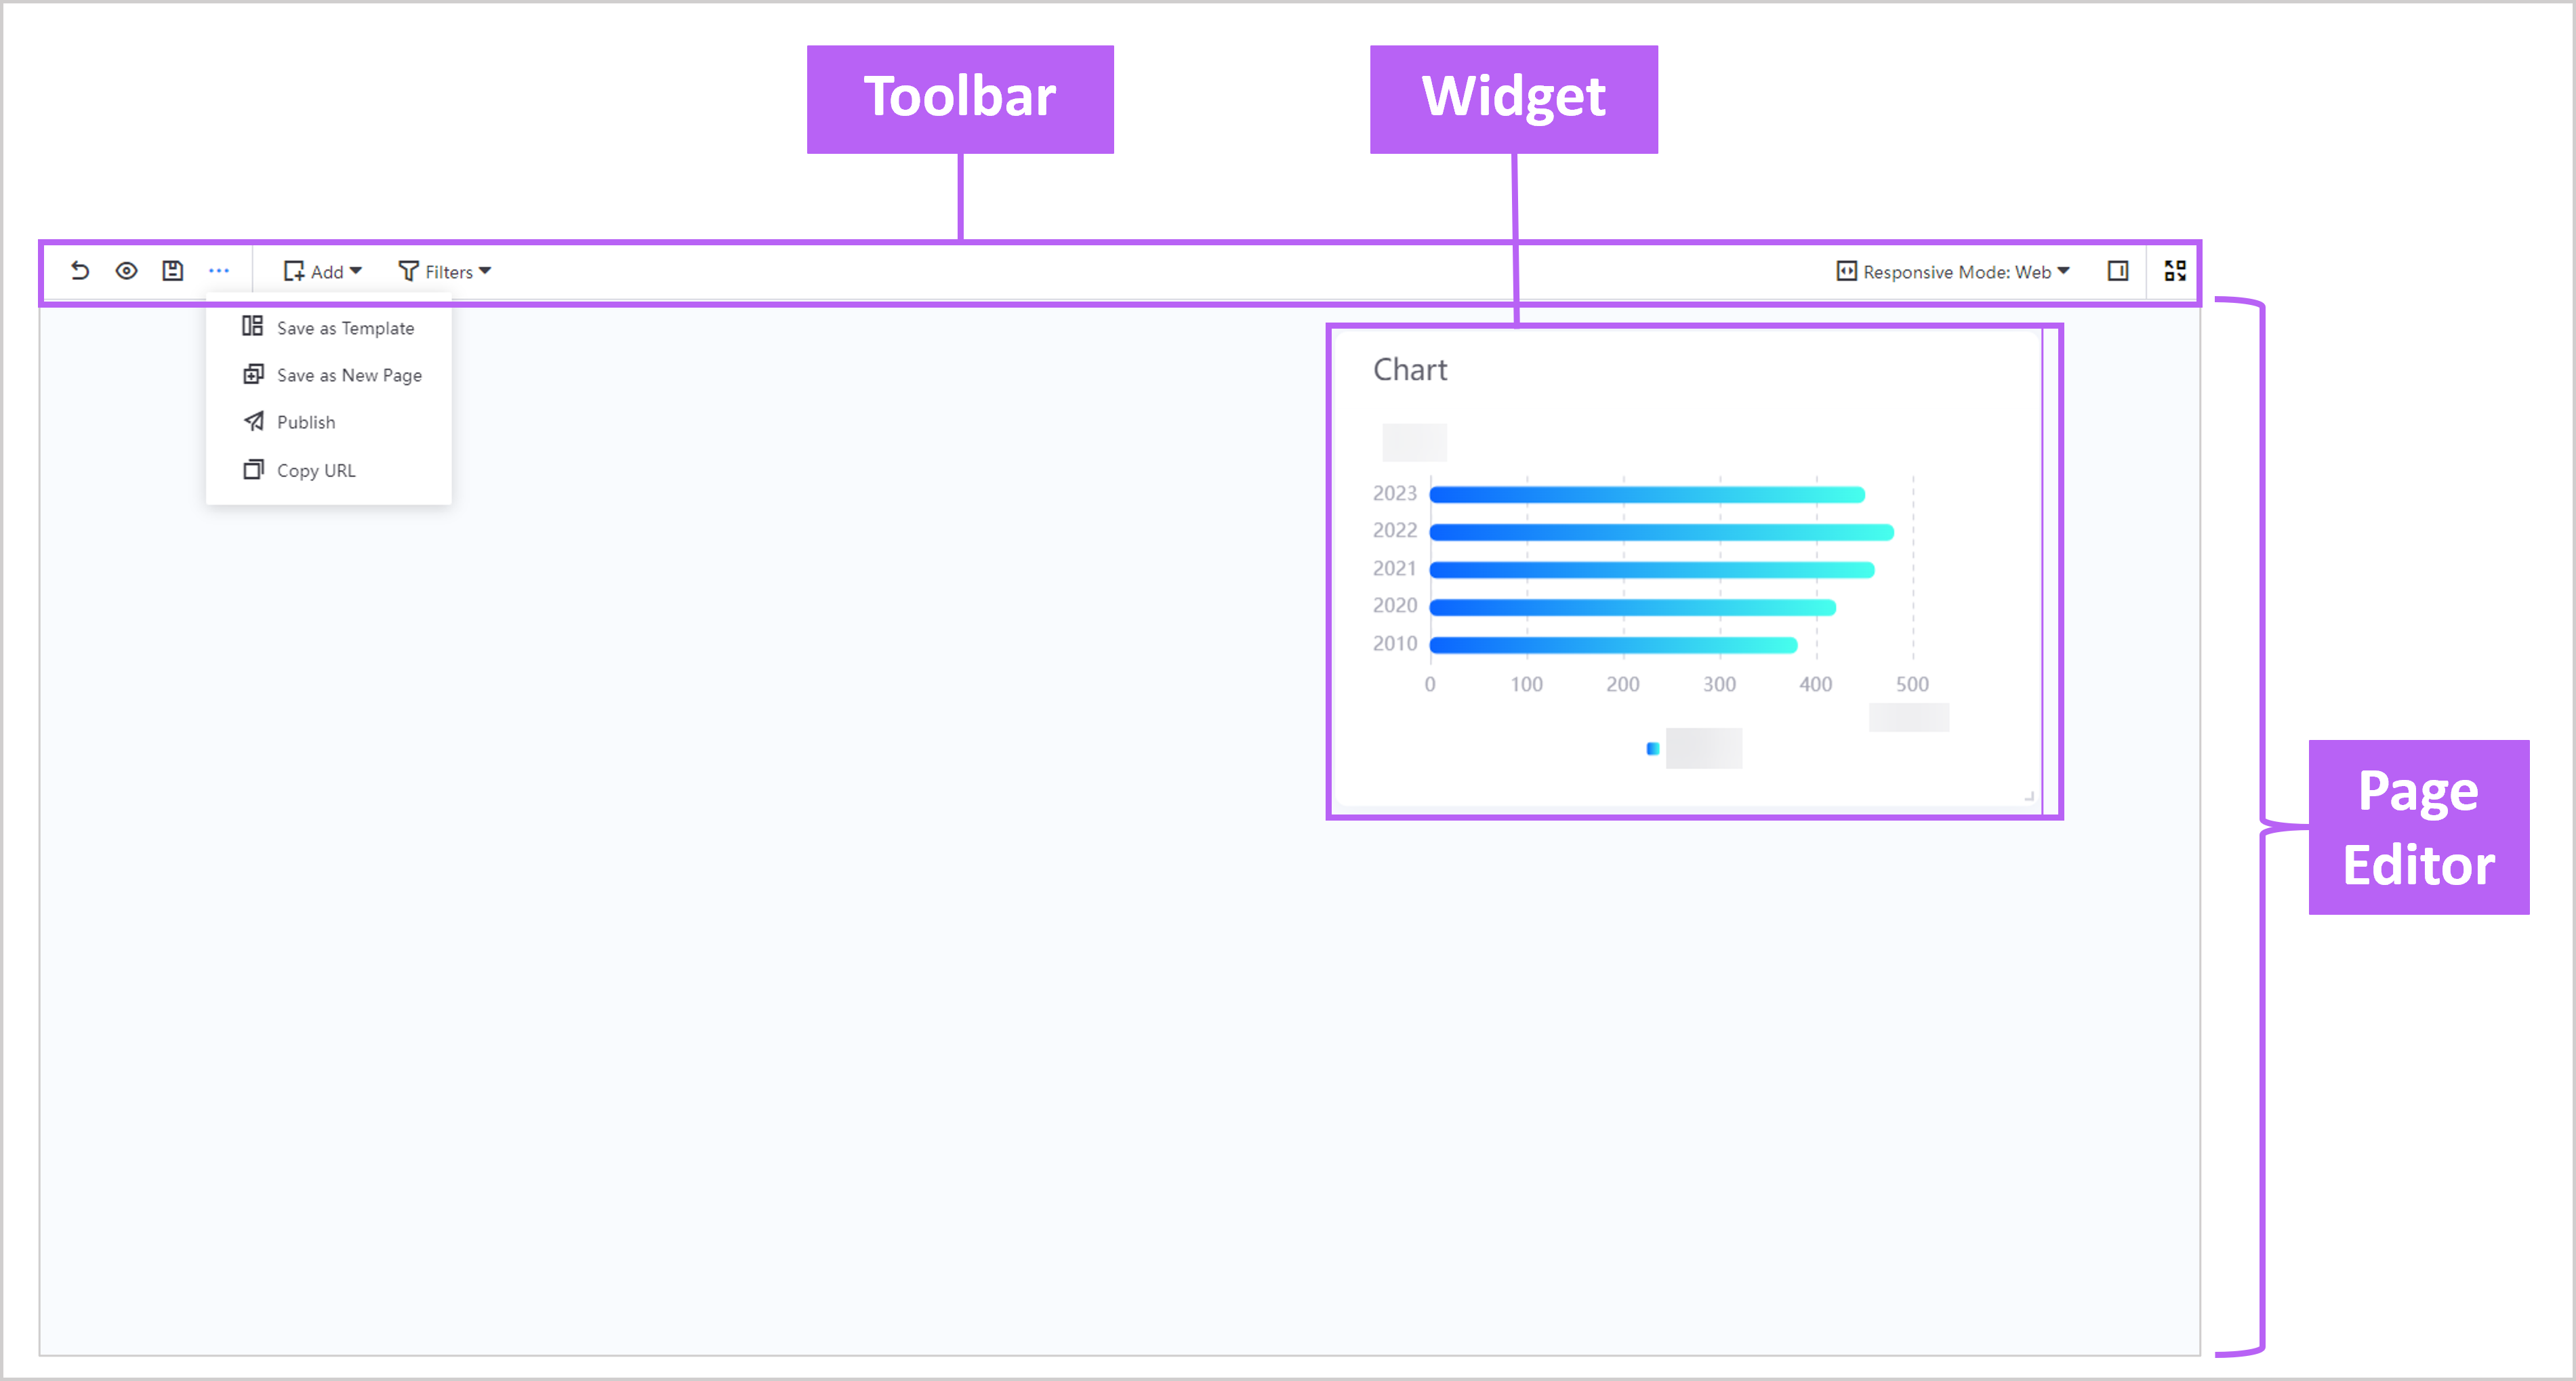
The table below explains the functions of each toolbar button.
Button |
Description |
|---|---|
|
Return to the previous window |
|
Preview the page |
|
Save the page settings and layout of widgets |
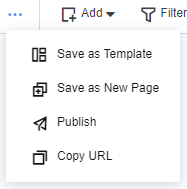
|
Show more options - Save as Template - Save as New Page - Publish - Copy Page URL |
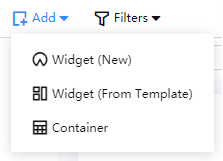
|
Create widgets or add widgets from a template |
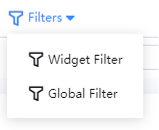
|
Create a widget filter or a global filter |
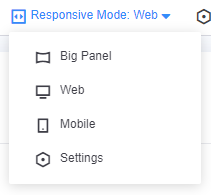
|
Select a mode to simulate your display screen size. You can also customize the resolution response ranges for each mode. This ensures that the configured page is suitable for your intended display screen. |
|
Configure the appearance of the published page, or the Page Editor. |
|
Hide and show the Navigation Pane and the Application Portal header bar. |


Page Preview
You can preview a page from the Project View or the Page Editor.
From Project View
When you preview a page from the Project View, you have the options to edit, publish or save the page as a template.
The table below explains the functions of each toolbar button.
Component |
Description |
|---|---|
|
Return to the Project Editor |
|
Open the Page Editor |
|
|
|
Select a mode to simulate your display screen size. |
|
Hide and show the Navigation Pane and the Application Portal header bar. |


From Page Editor
The following is the screen when previewing a page from the Page Editor.
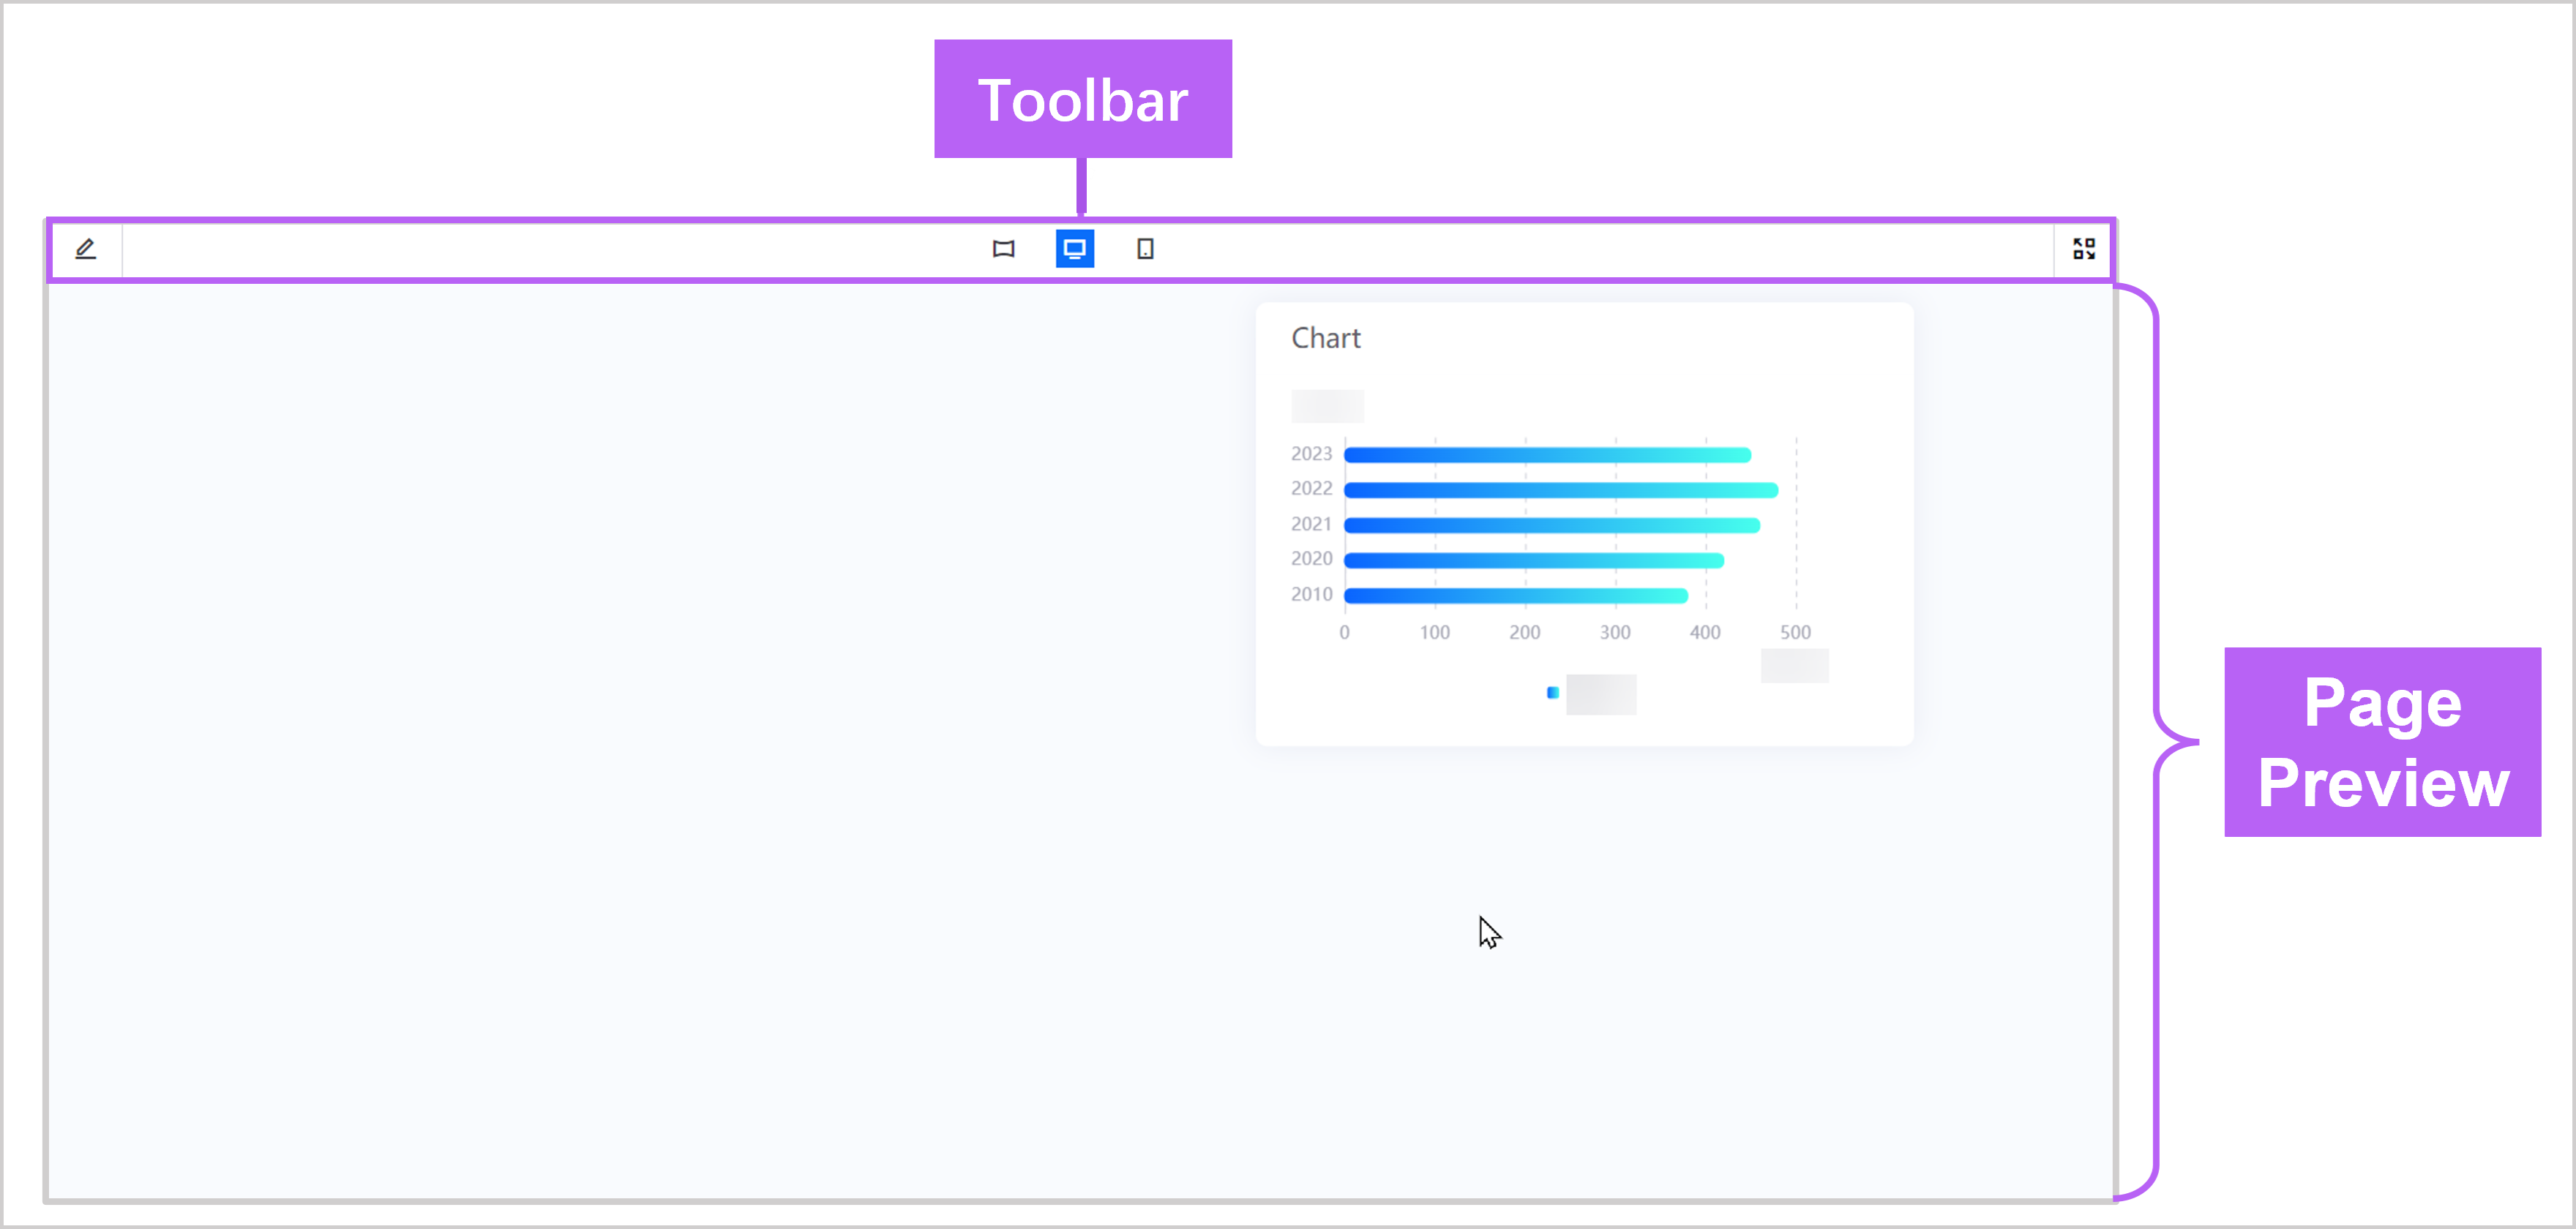
The table below explains the functions of each toolbar button.
Component |
Description |
|---|---|
|
Return to the Page Editor. |
|
Select a mode to simulate your display screen size. This ensures that the configured page is suitable for your intended display screen. |
|
Hide and show the Navigation Pane and the Application Portal header bar. |
Chart Editor
The Chart Editor enables you to configure the properties of a chart, such as the chart type, the data used in the chart, and the design of specific chart widgets.
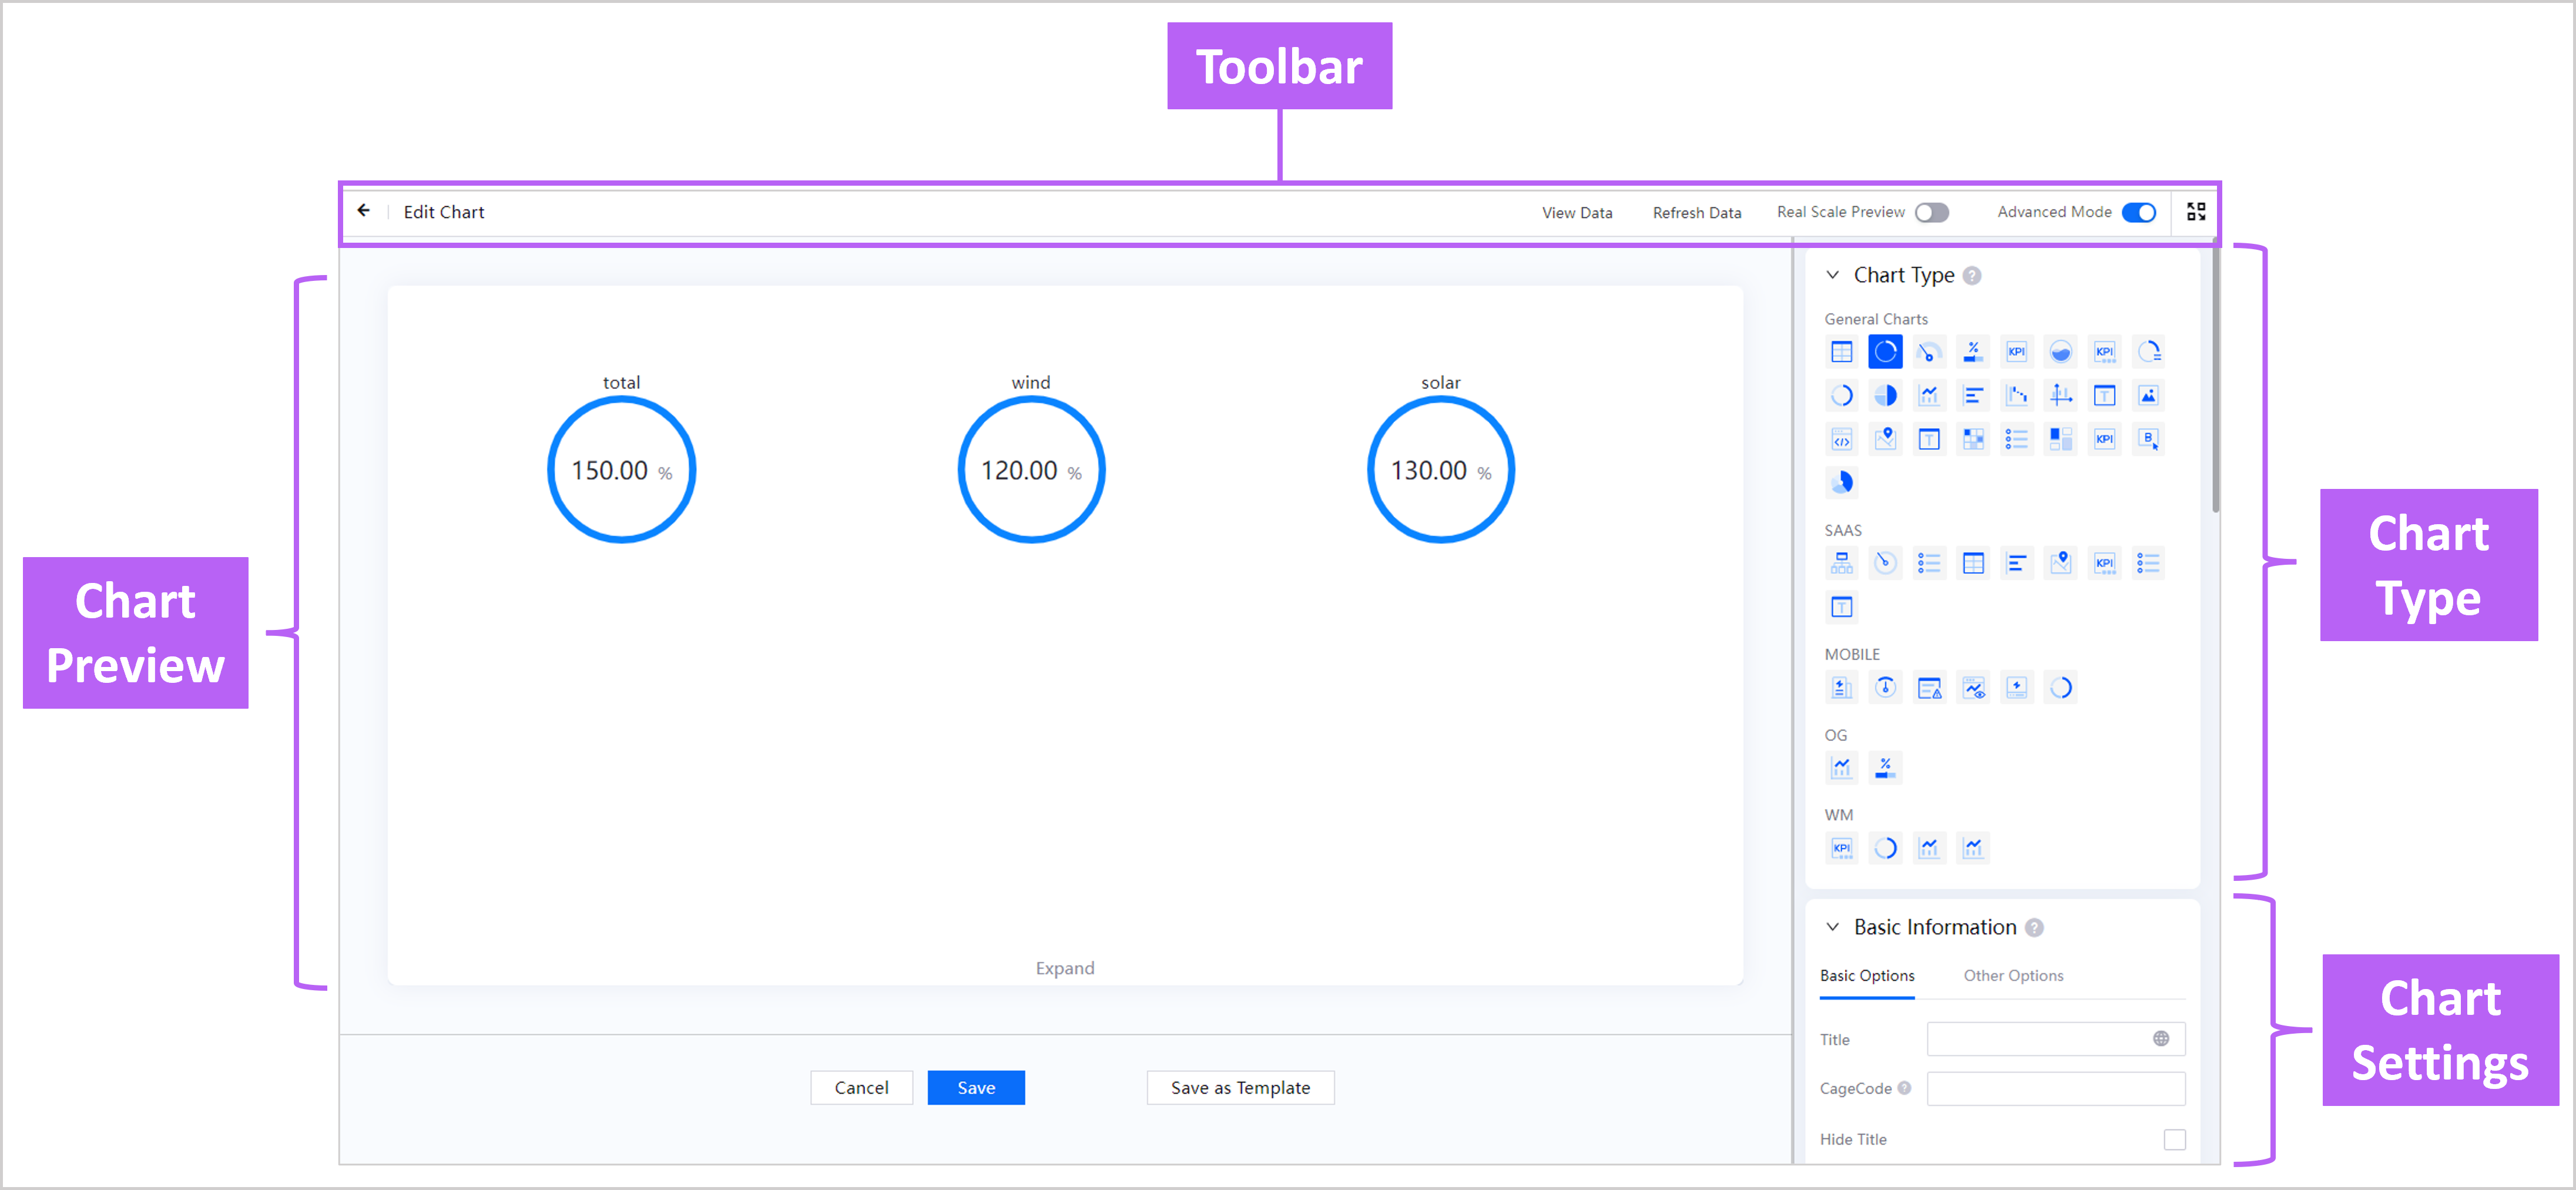
The table below explains the functions of each toolbar button.
Button |
Description |
|---|---|
|
Return to the Dashboard Editor. |
|
Preview the export data, data can be downloaded. |
|
Refresh the widget to display the updated Calculated Field. |
Real Scale Preview |
Display the actual aspect ratio of the chart within the widget. |
Advanced Mode |
Show more options for widget configuration. |
|
Hide and show the Navigation Pane and the Application Portal header bar. |


