Cloud Flows
Cloud flow is an integration flow that is fully managed in the cloud, from creation, design, publish, all the way to deletion.
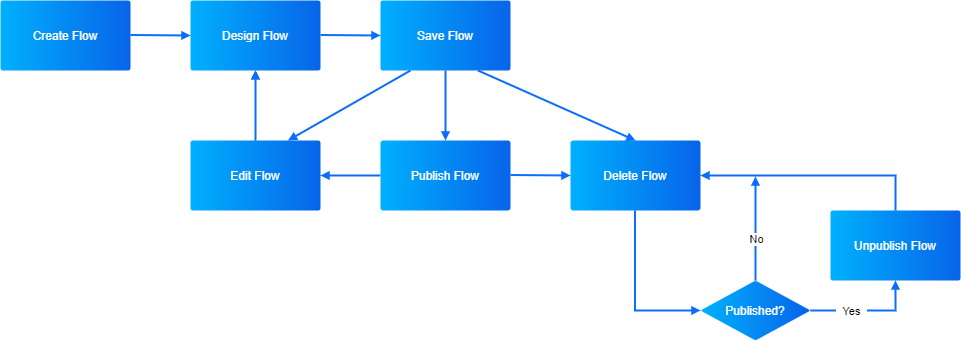
After Creating flows, the following operations can be performed:
Cloud flows have the following features:
Customizing Runtime Resource
- The resource specification determines the computing and storage scale available when the cloud flow runs. You can allocate resources by the following ways to improve the flow efficiency and reduce usage.
Flow runtime resource: It is recommended to allocate more resources for complicated flow logic as that requires more resources for computing and increase the instance for flows that have more connectors to increase system concurrency. For more information, see Allocating Runtime Resource.
Server runtime resource: For flows that connect to the MQTT server, you can optimize the operation of the flow by allocating server runtime resources and flow runtime resources. For more information, see Allocating Resource for Servers.
You can view the resource usage of all cloud flows in this OU in Device Data Integration > Dashboard. For more information about resource on EnOS, see Resource Management on EnOS.
Real-time Monitoring Runtime Status
- You can monitor the real-time running status of each cloud flow and the overall running status of all cloud flows in this OU.
For a single cloud flow, you can view the publishing status, and the CPU and memory usage in the past hour. For more information, see Managing Cloud Flows.
For all cloud flows, you can view the number of flows created in this OU, resource usage, number of runs (success/failure), and details of running failures. For more information, see Monitoring Cloud Flows.
Supports configuring alerts for cloud flows. You can select different alert rules and customize alert levels and thresholds as required. After triggering, the specified recipients will be notified by email or SMS. For more information, see Configuring Cloud Flow Alerts.
Tracing Flow Log and Node Log
- After switching the Debug for cloud flows, cloud flows running normally will generate flow logs and node logs. Each flow log has a trace ID, which will be tagged to all the node logs generated in the flow, enabling you to link all the nodes logs together in this particular flow.
Flow logs: Displays the Runtime Status (success/failure) and Run Time. You can view the error log or monitor the flow status as a basis of resource allocation.
Node logs: Displays the node’s Runtime Status (success/failure), Run Time, Input, and Output logs of every trigger. You can use Trace ID of the flow log to search the corresponding node log.
For more information, see Viewing Cloud Flow Logs.
By dragging and dropping nodes with different functions in cloud flows, you can implement various operations. For example:
Connecting gateways of different protocols: Use HTTP Server, MQTT Sub or Kafka Sub to connect different gateways to collect messages.
Invoking APIs: Use Open API to invoke EnOS Open APIs and access EnOS Cloud. Or use HTTP Client to request 3rd-party HTTP server to obtain data.
Integrating data offline: Use SFTP File or S3 File to poll SFTP server or S3 server periodically and download CSV files.
Data processing: Transfer CSV file to JSON format via CSV or transfer data format from different sources to EnOS standard format via Script.
Data mapping: Look up asset, model, or product via Lookup Asset, Lookup Model or Lookup Product and map device and model via Lookup Mapping. After that you can upload measurement points via Upload Measurement Point or Upload Asset File.
Command forwarding: Receive the command from applications via Command and push commands to devices via MQTT Pub. When the command is performed, you can use MQTT Server to receive the status and post device status and update command via Respond Command.