Monitoring Cloud Flows
The Dashboard page enables you to view the resource usage and flow operation status such as the total flows created, total number of runs, etc. to have a better perspective of the overall flow health status.
You can also choose to view the statistics of a flow that you specify for a certain time range.
Prerequisites
Ensure that you have read the limitations for monitoring flows. See Limitations.
Viewing Overall Statistics
Log in to the EnOS Management Console and click Device Data Integration > Dashboard from the left navigation menu.
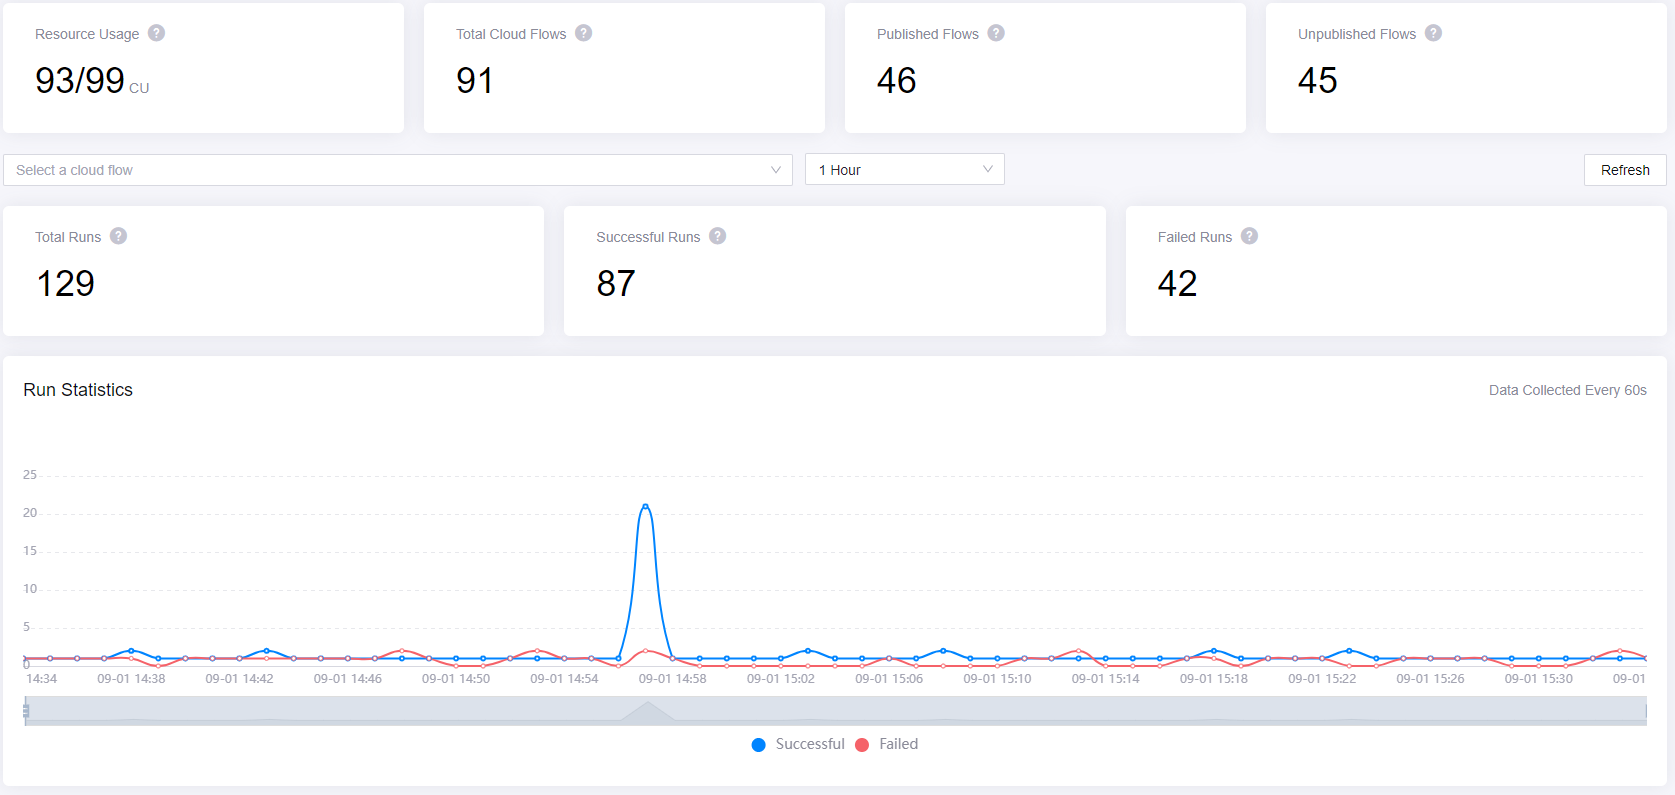
In the Dashboard page, you can view the overall cloud flow information as per the below.
Resource Usage: The total resources used so far / the total resources applied under the OU. For more information on requesting for resources, see Resource Management on EnOS.
Total Cloud Flows: The total number of cloud flows created by users in Flow Designer.
Published Flows: The total number of published and running cloud flows.
Unpublished Flows: The total number of unpublished cloud flows.
Viewing Real-time Statistics
In the Dashboard page, you can view the statistics for successful or failed runs for all cloud flows or a particular cloud flow for four different periods.
To view the statistics for all cloud flows, do not select any flow from the Select a cloud flow list. To view the statistics for a particular flow, select the flow you wish to view from the Select a cloud flow list. You can select up to 5 flows.
Select the period you wish to view. Each period has its own data collection cycle.
1 Hour: The default period for the statistics shown on the page. This will show the statistics for the past 1 hour for every 60 seconds.
1 Day: Select this to show the statistics for the past 1 day for every 5 minutes.
7 Days: Select this to show the statistics for the past 7 days for every 15 minutes.
15 Days: Select this to show the statistics for the past 15 Days for every 30 minutes.
The statistics shown for the below will be based on the selected period above.
Total Runs: The number of flows that have run in the selected period.
Successful Runs: The number of successful runs in the selected period.
Failed Runs: The number of failed runs in the selected period. Click it to see more details, such as the name, publisher, and number of failed runs for the flow.
Run Statistics: A graph showing the real-time statistics of the successful and failed runs for the period selected.