Viewing Cloud Flow Logs
There are two types of logs that you can view for a cloud flow: flow logs and node logs.
Prerequisites
Ensure that the flow is currently running or was running previously.
Ensure that the Debug switch was toggled on for the flow when it was published.
Flow Logs
Flow logs are logs for the flow itself. Flow logs are stored for a maximum period of 15 days.
In the EnOS Management Console, go to Device Data Integration > Flow Designer.
In the list of cloud flows in the Flow Designer page, find the one you wish to view its logs for and click Edit.
Click the Log icon at the top of the page and the Log section will appear at the bottom of the screen.
Select a date range and the status (Success, Error, or All for both success and error). Additionally, you can further customize your search by entering a keyword. If the keyword is found in the input msg of the first node of the flow, the search results will return the relevant logs.
Click Search.
The results, if any, will be displayed below.
Trace ID: Each flow log has a trace ID, which will be tagged to all the node logs generated in the flow, enabling you to link all the nodes logs together in this particular flow. You can use the trace ID in the node logs to search for the log that corresponds to the flow log.
Run Time: The time taken to generate the log log in HH:mm:ss:SSS. Run Time can be used to analyze the time that the flow needs to process the message, which can be used as a guideline for resource allocation.
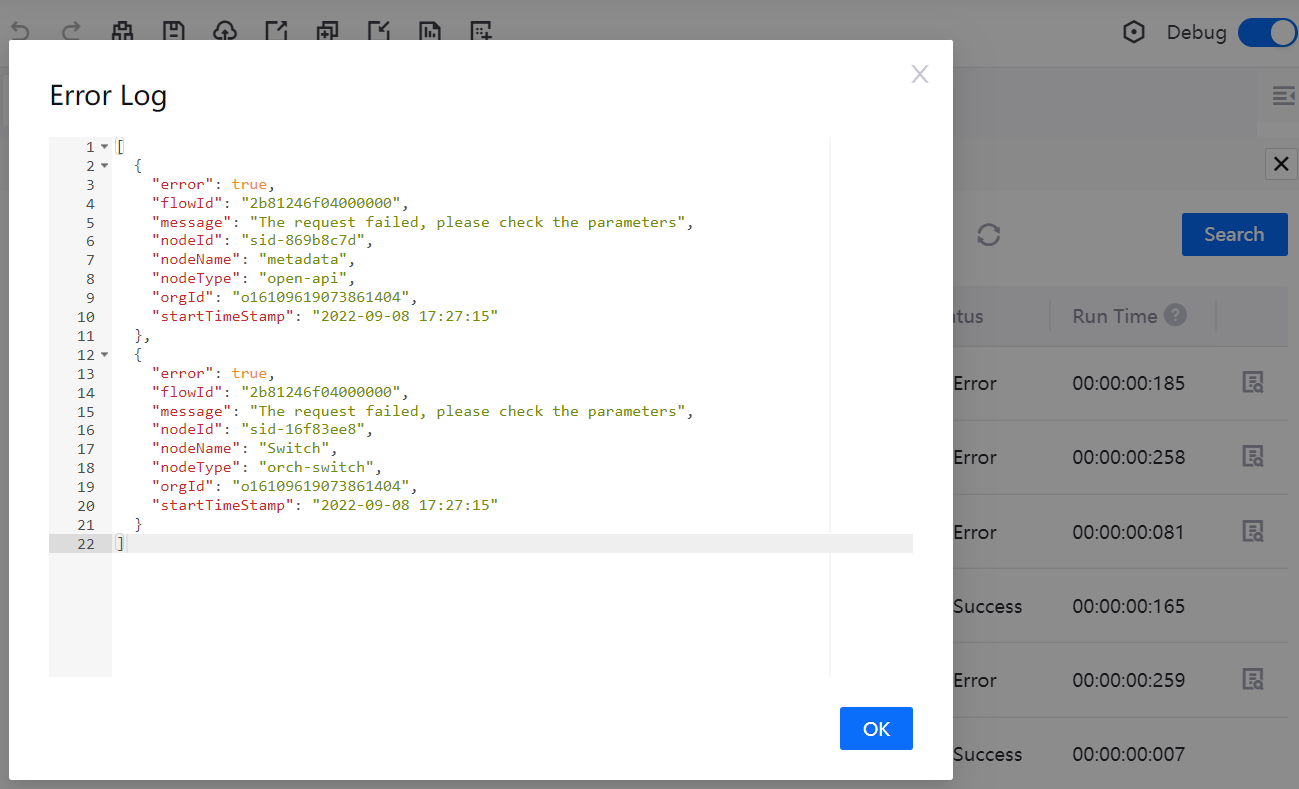
For logs with an Error status, you can click its corresponding Error Details icon to view the error log.
Node Logs
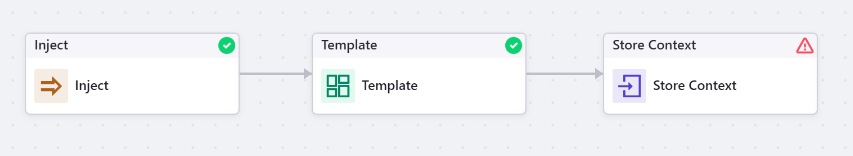
You can see each node’s status on the canvas page at a glance: nodes without errors have a green icon displayed at the top right of the node while nodes with errors have a red icon.
You can access node logs by clicking on the node. Note that some nodes do not have logs. Node logs are stored for a maximum period of 7 days.
In the EnOS Management Console, go to Device Data Integration > Flow Designer.
In the list of cloud flows in the Flow Designer page, find the one you wish to view its nodes logs for and click Edit.
Click the node you wish to view the log of and click its Log tab.
There are two ways to search a node log.
By time: Select a date range and the status (Success, Error, Stopped, or All for all three statuses).
By Trace ID: You can use the trace ID to search for the node log that corresponds to the flow log. Enter a trace ID and select the status (Success, Error, Stopped, or All for all three statuses).
Click Search and the results, if any, will be displayed below.
Trace ID: Each node log has a trace ID, which will be tagged to the flow log and other node logs generated by one trigger.
Run Time: The time taken to generate the node log in HH:mm:ss:SSS. Run Time can be used to analyze the time that the node needs to process the message.
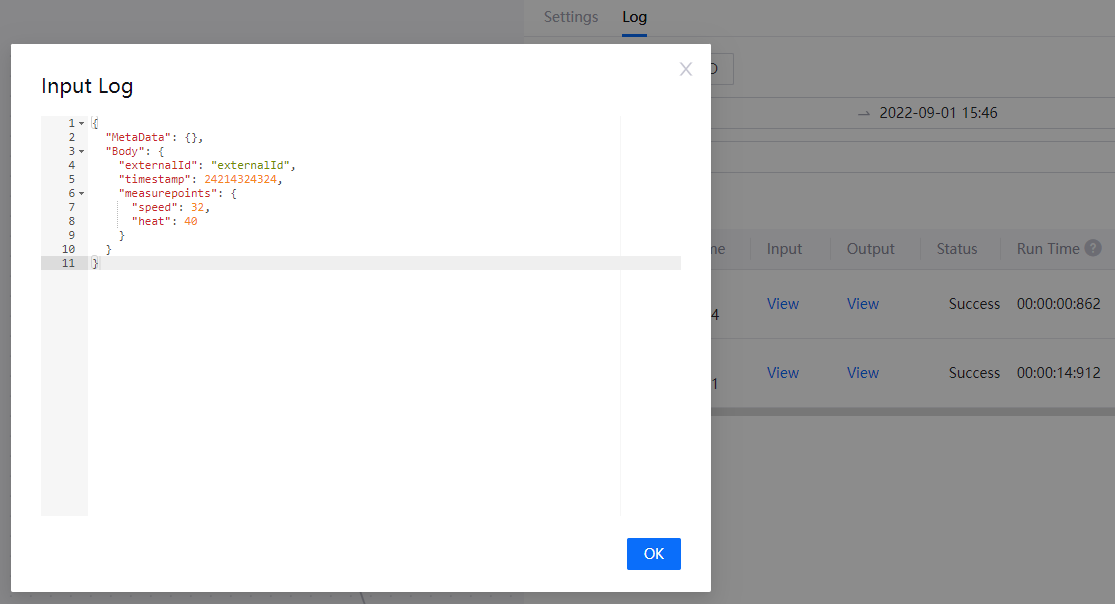
For node logs, you can click View under Input or Output to view the node’s input and output msg respectively, as well as its metadata.
The max storage for the input/output msg of each node log is 8KB. If the input/output msg exceeds 8KB, only the first 8KB worth of msg will be saved. The rest will be cut off, which will cause the display of some msgs to be incomplete. This will only affect the msg content; the total number of logs of the flow and the msg metadata will not be affected.
Note
The storage limit will only affect the display of the msg. The flow will still run with the full msg.
If you need the complete msg when exceptions occur, you can use the Catch node to store the exceptions and use the File node to store the msgs into a file and save it to your own server.