Using Portfolio
This page explains how application users view asset information and personalize the display content and style of the Portfolio page in Unified Monitoring. The Portfolio page is shown as follows.

For more information about the page elements in Portfolio, see Exploring Portfolio.
Note
Unified Monitoring supports custom page layouts and functions, so the actual layout and functions may differ from this page.
Prerequisites
Before you start, make sure the current account has been assigned the required asset permissions, operational permission points, and a menu group that contains the Portfolio page. If these are not assigned, contact your OU administrator.
Using the Shortcut Toolbar
On the Portfolio page, you can use the shortcut toolbar to edit the functions or styles of the asset map and canvases. The shortcut toolbar on the Portfolio page is shown as follows.

The shortcut toolbar mainly contains the following functions.
Function |
Description |
|---|---|
Map Settings |
Opens the map and canvas settings panel. |
Map Type |
Changes the map type. |
Collapse/Expand Panels |
Collapses or expands the canvas panels around the map. |
Full Screen/Exit Full Screen |
Enters or exits full-screen mode. In full-screen mode, the top status bar and the left navigation bar are hidden. |
Zoom In |
Adjusts the zoom ratio of the map. |
Reset |
Restores the default zoom ratio and center point of the map. |


The buttons displayed in the shortcut toolbar depend on the configuration of the application creator. For example, when map settings are not enabled, the Map Settings button does not appear; if the application creator enables auto-hide, the action buttons will be collapsed automatically when there is no interaction.
Changing Map Types
Portfolio supports the Administrative Map, Geographical Map, Road Map, ECDIS, and 3D Map. To change the map type of the Portfolio page, follow these steps:
In the left navigation bar, select Portfolio.
Note
Unified Monitoring supports custom menu names, so the actual menu name may differ from this page. For help, contact your OU administrator.
In the shortcut toolbar of the Portfolio page, select Map Type
 .
Change the map type in the map type list. The new map type takes effect immediately.
The selectable map types are configured by the application creator, and the types supported by different asset levels differ. For example, the Administrative Map does not support drilling down to the site level, and the 3D Map is available only on single-site pages.
Editing the Portfolio Page
Through the map settings panel, you can adjust the display effects of the map and the display content of canvases according to your own monitoring habits, and save the adjustments as the default configuration.
In the left navigation bar, select Portfolio.
In the shortcut toolbar of the Portfolio page, select Map Settings
 to open the map settings panel.
Configure the following information in the Map Settings tab.
Field
Description
Conditions and Limitations
Show Title Bar
Displays the title bar at the top of the page, with the page title on the left and the current time on the right.
Requires that the application creator has enabled the title bar.
Show Mini Map
Displays a mini map in the corner of the map, for understanding the position of the current view in the global context.
Supported only by the Administrative Map.
Show Area Boundary
Overlays administrative region boundaries on the map.
Suitable for scenarios where assets need to be grouped by administrative region.
Map Translucency
Adds a translucent mask on the map, with the mask effect being bright in the center and dark around the edges.
If dense asset information on the map makes canvas widgets hard to distinguish, you can enable this function to display the widgets more clearly.
Show Administrative Name
Displays the names of administrative regions on the map.
Available only when the interface language is Chinese.
Show Heat Map
Displays the metric data of each region in the form of color blocks. When enabled, you can expand Metric Configuration and select a heat map color (blue, red, yellow, purple, green, or gray) for each metric.
Requires that the application creator has configured the heat map. Heat map data can come from the ranking widget or custom data.
Hide Action Buttons
Automatically hides the shortcut action buttons when there is no interaction.
If you do not need to adjust the map frequently, you can enable this function to prevent the action buttons from obstructing asset information on the map.
Show Asset Location
Displays asset icons or asset aggregation points on the map.
When disabled, asset markers are no longer displayed on the map.
Show Asset Name
Displays the asset name below the asset icon.
Requires Show Object Location to be enabled first. Overlong names are displayed with ellipsis.
Enable Asset Aggregation
Combines and displays all assets within a specific range, preventing icons from overlapping each other.
Requires that the application creator has enabled asset aggregation. Suitable for maps with a large number of assets.
Aggregate By
Selects the rule on which asset aggregation is based. The options include by province, by region, and by attribute.
Requires Enable Asset Aggregation to be enabled first. The selectable range is configured by the application creator.
Show Aggregated Label
Displays the name of the aggregated objects in the aggregation point icon.
Requires Enable Asset Aggregation to be enabled first.
Show Donut Chart
Displays asset aggregation icons in the form of donut charts, showing metric progress as percentages on the aggregation icons.
Requires the Aggregate By to be by region, and the application creator to have configured the data fields of the aggregation donut chart.
Show Donut Chart by Site
Displays site icons in the form of donut charts.
Requires that the application creator has configured the site style as bubble and has configured the data fields of the aggregation donut chart.
Looping Display by Regions
Loops through the data of each administrative region in the form of floating cards.
Supported only by the Administrative Map, and requires that the application creator has enabled region looping.
Looping Display by Provinces
Loops through the data of each provincial administrative region in the form of floating cards.
Requires the aggregation method to include by province, and the application creator to have enabled province looping.
Layer
Overlays weather data layers such as wind speed, temperature, and irradiance on the map.
Requires that the application creator has configured weather layers and the current account has the map layer data permission point. Available only at the global and region levels.
Show Legend Filters
Displays a legend in the lower-right corner of the map. Selecting status labels in the legend shows or hides assets of the specified status in the asset map.
Requires that the application creator has enabled the site status legend.
Legend Filter
When expanded, allows checking the legend items that participate in filtering metric by metric.
Requires that the application creator has configured the legend filter.
Note
The functions in map settings may differ depending on the map type, asset level, and Portfolio configuration. Contact the application creator for more information.
In the Left/Right/Top/Bottom Canvas tabs, select to turn on or off the corresponding canvas or each page in the canvas.
After the adjustment is complete, select one of the following buttons:
Button
Description
Save as default
Saves the current settings as the default configuration. The next time you access Portfolio, the page will display this configuration by default.
Reset
Restores all settings to the initial state preset by the application creator. The system will ask for secondary confirmation.
Cancel
Discards this adjustment and closes the settings panel.
If the application creator has not enabled map settings, the Map Settings button does not appear in the shortcut toolbar, and you can only view the preset map view.
Switching Asset Maps
On the Portfolio page, you can switch asset maps in the following ways:
Switch the map with the asset tree filter
Switch the map with asset icons
Switching Asset Maps with the Asset Tree Filter
The asset tree filter displays the assets under the current asset level, as shown in the following figure.

To switch asset maps with the asset tree filter, follow these steps:
In the left navigation bar, select Portfolio.
(Optional) If the current account has permission to view multiple organization structures, you can select
 and switch the organization structure information displayed on the current page in the drop-down menu.
Select the current group or region name in the upper left of the page to open the asset tree filter.
Select an asset under Recently visited or an asset in the asset tree topology to jump to the corresponding Portfolio page. The Recently visited list displays the names of the last 3 visited nodes.
(Optional) On a region or site map, select the back icon
 on the right of the asset tree filter to return to the global map (from region and site maps) or the region map where the site is located (from the site map).
Note
When jumping to a region or site map, canvas widgets and information such as asset type statistics change accordingly.
If the asset tree filter is not enabled on the current Portfolio page, the back icon is displayed in the shortcut toolbar instead.
If an organization structure node is associated with resource instances and the application creator has enabled associated resources, the page displays the data of the associated resources when the node is selected.
Switching Maps with Asset Icons
Asset icons are icons that display the name, status, data, and other information of assets on the map, with three styles: Icon, Dot, and Bubble.

On the global or region map, an asset icon represents a site; on the site map, asset icons represent the devices in the site. On the global or region map, selecting an asset icon jumps to the site map.
The behavior after clicking an asset icon is configured by the application creator, which may be jumping to the single site map, jumping to an external URL, or no link.
Viewing Asset Pop-ups
When you hover the cursor over an asset icon or select an asset icon, the page displays an asset floating card for viewing the key data of that asset.
The pop-up content has the following two forms, and the specific form is configured by the application creator:
Data Field: displays the attributes, measurement points, and metrics configured by the application creator in the form of key-value pairs.
Embedded Content: directly embeds a Digital Twin Visualization (DTV) page or a third-party page, displaying richer visualization content.
If the application creator has configured a link URL for the pop-up title, selecting the pop-up title jumps to the specified page.
Filtering Assets
Filter the assets and related data displayed in the Portfolio map and widgets through the following filters:
Asset status legend
Asset type filter
Dimension filter
Legend filter
Filtering Assets with the Asset Status Legend
With the asset status legend shown as follows, you can quickly filter assets of each asset type that are in a specific status.

To filter assets with the filter legend, follow these steps:
In the left navigation bar, select Portfolio.
Select the labels in the filter legend to show or hide assets of the corresponding status in the asset map.
The asset status labels currently displayed on the map are preceded by the corresponding color block as a hint, and the color of this color block is consistent with the color block displayed at the bottom of asset icons on the map. For example, if assets in the Normal status are not currently displayed on the map, selecting Normal in the filter legend will make the corresponding color block appear in front of the Normal label and the assets in the Normal status be displayed in the asset map, as shown in the following figure.

Filtering Assets with the Asset Type Filter
When multiple asset types (such as wind, solar, and thermal) exist under the current asset level, you can use the asset type filter shown as follows to quickly filter the assets of a specific type and their related data.

To filter assets with the asset type filter, follow these steps:
In the left navigation bar, select Portfolio.
Select the different asset icons in the asset type filter to filter the assets displayed on the current map and in canvas widgets.
The All option corresponds to the Overall type configured by the application creator, and is used to view the cross-domain aggregated perspective. The order of options in the filter is configured by the application creator.
Filtering Assets with the Dimension Filter
With the dimension filter shown as follows, you can quickly filter assets of specific dimensions (such as type, province, and program information). To change the dimensions used for filtering assets, contact the application creator.

To filter assets with the dimension filter, follow these steps:
In the left navigation bar, select Portfolio.
Select the dimension filter on the asset map and configure the filter conditions in the drop-down list.
The dimension filter supports the partially selected state, which can be used to express a hierarchical relationship of “partially selected”. A single page can be configured with at most 10 dimension filter items.
Filtering Assets with the Legend Filter
With the legend filter shown as follows, you can quickly filter assets that meet specific attribute, measurement point, or metric values. To change the data fields and filter conditions used for filtering assets, contact the application creator.
For numeric data fields

For non-numeric data fields

To filter assets with the legend filter, follow these steps:
In the left navigation bar, select Portfolio.
Select the drop-down box in the legend area at the lower-right corner of the asset map, and specify the attribute, measurement point, or metric used for filtering assets.
Select the name labels (non-numeric data fields) or color blocks (numeric data fields) in the legend filter to show or hide the corresponding assets in the asset map.
If the enumeration values of a data field contain icons and the application creator has enabled icon display, the legend displays icons instead of solid color blocks.
Using Weather Layers
Weather layers can overlay weather data such as wind speed, temperature, and irradiance on the map, helping you assess the operating status of assets in combination with weather conditions.
To use weather layers, follow these steps:
In the left navigation bar, select Portfolio.
Enable Layer in the map settings panel.
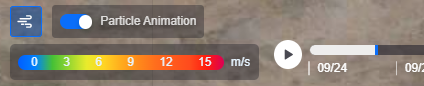
In the weather legend on the map, perform the following operations:
Switch the weather layer type, for example from wind speed to temperature.
Turn on or off the particle animation, used to intuitively show the flow direction of the wind farm.
Drag the timeline or select the play button to view the changes of weather data over time.
Note
Weather layers are available only at the global and region levels.
The current account needs the map layer data permission point, and the application creator needs to have configured weather layers. If the weather layer entry does not appear, contact your OU administrator or application creator.
Using the Single-Site Map
The single-site map focuses on a single site, and is used to view the locations and running status of various devices in the site.
Depending on the configuration of the application creator, the single-site map may contain the following layers:
Layer |
Description |
|---|---|
Device Layer |
Displays the devices in the site by longitude and latitude, such as wind turbines and inverters. Select a device icon to view its floating card. |
Booster Station & Feeder Layer |
Displays the locations of booster stations and the routing of feeders in the site. |
Vehicle & Vessel Layer |
Displays the current positions of O&M vehicles or O&M vessels. |
Electronic Fence Layer |
Displays the electronic fence range of the site. |
Wind Direction Layer |
Displays the current wind direction and wind speed in the form of arrows or particles, and provides a wind direction legend. |
In the device floating card, you can view the device status and device data configured by the application creator.
Viewing Object Trajectories
If the application creator has enabled trajectory display for movable objects such as O&M vehicles and O&M vessels, you can replay the historical movement trajectory of an object through the following steps:
Select the target object on the single-site map.
In the trajectory map, drag the timeline to select a time point, or select the play button to replay the trajectory continuously. Trajectory display is supported only for movable object types in the wind domain.
Viewing the Page in Full Screen
In full-screen mode, the top status bar and left navigation bar of the EnOS Application Portal are hidden, and the map and canvases fill the entire screen, suitable for long-term display on monitoring Portfolios.
You can enter or exit full screen in the following ways:
Select Full Screen
 in the shortcut toolbar to enter full screen, and select it again to exit full screen.
If the application creator has enabled Auto Fullscreen, accessing the page URL automatically enters full-screen mode.
After you manually exit full screen, the page will not automatically enter full screen again. If there is no full-screen button in the shortcut toolbar, it means the application creator has not enabled that button.