Configuring Common KPI Inquiry
This page explains how application developers configure the Common KPI Inquiry page so that end users can query the attributes and metric data of assets according to business needs, and aggregate and analyze the data in the form of reports.
Prerequisites
The current account has menu access to the Common KPI Inquiry page in the target application, as well as the template-configuration permission of Common KPI Inquiry. If not assigned, contact your OU administrator.
The attributes, metrics, and dimension types of the relevant assets have been registered in EnOS. If needed, query the registered data through the EnOS Common Data Service API.
You have read Exploring Common KPI Inquiry to understand the functions of the Common KPI Inquiry page.
Note
Unified Monitoring supports customized menu names, so the actual menu name might differ from this document. The following text uses the default name “Common KPI Inquiry” to refer to the Common KPI Inquiry menu configured in the application.
Entering the Common KPI Inquiry Configuration Page
After the application creator’s account has the template-configuration permission of Common KPI Inquiry, enter the configuration page through the following steps:
Select Common KPI Inquiry in the left navigation pane of the target application.
Select Function Configurations
 at the upper right of the page.
The configuration page contains four tabs, each determining a different aspect of the page:
Tab |
What it determines |
Typical timing for adjustment |
|---|---|---|
Basic Configuration |
Whether end users can modify query conditions themselves, whether they can use templates, the position of the total row, and the UI text of the page. |
When you need to fix the report view, or place the total row at the top. |
Asset Configuration |
The asset granularity, asset types, and device types supported by the page, and the ways assets are filtered and sorted. |
Must be configured before the page goes live; it determines which assets end users can query. |
Time Configuration |
The time intervals, quick time ranges, and end-time standard available to end users. |
When you need to narrow the time granularity range, or align the end time to natural periods. |
Data Configuration |
The source of data classification and the data filtering capabilities available to end users. |
When you need to enable filtering by enum values or filtering and sorting by conditions. |
Configuring Page Functions
Basic Configuration
In the Basic Configuration tab, you can decide the scope that end users can adjust themselves on the page, and set the total row position and interface text.
Configuration item |
Description |
Default value |
|---|---|---|
Modify Query Conditions |
When enabled, the report-scope summary bar is displayed at the top of the page, and end users can select it to open the Report Configurations pop-up and modify the assets, data, and time of the current query themselves. When disabled, the summary bar is hidden from end users, and the page only displays the default view or the report fixed in a template; users with the template-configuration permission can still see the summary bar. Applicable to scenarios that require a unified report standard. |
|
Template |
When enabled, the template entry is displayed at the upper left of the page, and end users can apply, save, and manage report templates. When disabled, the template entry is hidden from end users; users with the template-configuration permission can still manage templates. |
|
Template Menu Style |
The expanded form of the template entry. |
|
Total Row Position |
After time subtotal is enabled, the position where the total row appears in the report. |
|
Customizing UI Text
To meet customization needs such as project terminology display and brand exposure, you can uniformly update certain specific terms in the Common KPI Inquiry interface; the configuration takes effect on both the configuration page and the end-user page at the same time. For example, the standard term “site” can be replaced in batch with the business term “power station”.
Customize the interface text through the following steps:
Locate Customize UI Text in the Basic Configuration tab.
Select Add, and select or enter a key name in the Key column. Each key name can be configured only once, and up to 100 entries can be configured. To customize more text, contact the system administrator to obtain key names.
When the key name does not exist in the text resources, the page shows Invalid key.
When the key name already exists in the table, the page shows Key already added.
In the Default Text column, view the text to be replaced.
In the Custom Text column, enter the updated text. Separate input by interface language is supported, and a single language allows up to 200 characters.
After configuration, the Default Text values in system text will be uniformly replaced with the Custom Text values. Text entered later by yourself (such as data column names, template names, and action button names) is not affected.
Asset Configuration
In the Asset Configuration tab, you can decide the asset scope supported by the report and the way end users filter assets.
Configuration item |
Description |
Default value |
|---|---|---|
Asset Granular |
The query granularity supported by the report; multiple selections are allowed. |
|
Asset Type |
The asset types supported by the report; select at least one. Asset types are determined by the business object types in EnOS Common Data Service, such as wind power and photovoltaic. After selection, a row is generated for each asset type in the table below. |
All site types |
(Asset type table) |
Configure the Multi-Site Device Query and Device Details switches for each asset type, and drag the sort icon to adjust the order of asset types. When no asset type has been selected, the table displays “Select asset types first”. |
Multi-Site Device Query disabled, Device Details enabled |
Multi-Site Device Query |
When enabled, end users can select multiple sites at device granularity and query the devices under multiple sites at one time; when disabled, only one site can be selected each time. Applicable to scenarios that compare devices of the same type across multiple sites. |
Disabled |
Device Details |
When enabled, end users can select the devices to query one by one. When disabled, the asset type enters device big-data mode; see Device Big-Data Mode. |
Enabled |
Device Type |
The device types supported by the report; select at least one. The available range is determined by the business domain of the selected asset types, so device types are added or removed accordingly when asset types change. When values exist, the device type list is displayed below, and the order can be adjusted by dragging the sort icon. Configurable only when Asset Granular includes |
Automatically selected with asset types |
Asset Display Order |
The basis on which assets are arranged in report rows. |
|
Asset Tree Style |
The display style of the asset list in the device filter and Select Asset Scope; multiple selections are allowed. |
|
Asset Filter |
When enabled, the asset filter is displayed in the filter row, and end users can switch assets directly without opening the Report Configurations pop-up. |
|
Dimension Filter |
When enabled, one filter is generated in the filter row for each dimension with enumerated values in the report, and end users can filter report rows by dimension value. |
|
Enable Non-Enumerated Dimension Display |
When enabled, dimensions without registered enumeration values are also displayed as columns in the report. Applicable to scenarios where dimension values are dynamically generated by business data and cannot be enumerated in advance. Configurable only when Total Row Position is |
|
Synchronize Asset Filtering Scope |
When enabled, when end users switch templates or open other KPI Inquiry pages, the site scope already selected on the current page is used by default without reselection. Takes effect only for pages whose asset granularity is site and whose site types are the same. |
Disabled |
Note
The page cannot be published when Asset Granular, Asset Type, or Asset Tree Style is empty.
Device Big-Data Mode
After Device Details is disabled for an asset type, the asset type enters device big-data mode at device granularity, where the server aggregates and paginates by site plus device type. This mode is applicable to scenarios where a single site has an extremely large number of devices and checking them one by one is impractical, but it has three visible impacts on end users, which are recommended to be communicated at the same time during configuration:
End users can only select sites, and the device filter is no longer displayed on the page.
Fewer data items are available: only metrics that support dimension filtering and pagination appear in Select Data.
The report does not support Group By Dimension. Group By Dimension is unavailable in all reports of device granularity, and is not a limitation unique to device big-data mode.
Time Configuration
In the Time Configuration tab, you can decide the time intervals and time ranges available to end users.
Configuration item |
Description |
Default value |
|---|---|---|
Time Interval Filter |
When enabled, the time interval filter is displayed in the filter row, and end users can switch the time granularity of the report themselves. When disabled, the time granularity is fixed and determined by Time Interval below. |
|
Time Interval |
The range of time intervals available to end users. |
|
Quick Time Range |
When enabled, the quick time range filter is displayed in the filter row, and end users can specify the start and end time with one click by preset ranges. |
|
Time Range Cutoff |
The end-time standard of quick time ranges. |
|
Time Range |
The quick time ranges available to end users. |
|
Synchronize Time Filtering Scope |
When enabled, when end users switch templates or open other KPI Inquiry pages, the time range already selected on the current page is used by default without reselection. |
Disabled |
Note
When Time Interval or Time Range is set to
Specified, the behavior of the corresponding selector depends on the filter switch: when the filter is enabled, it is multi-select, and end users can switch within the selected ranges; when the filter is disabled, it is single-select, fixing the report to one time interval or time range.The quick time ranges actually available to end users are further narrowed by the time interval. For example, when the time interval is
Year, onlyThis Year,Last Year, andLast 3 Yearsare retained.
Data Configuration
In the Data Configuration tab, you can decide the source of data classification and the filtering capabilities available to end users.
Configuration item |
Description |
Default value |
|---|---|---|
Data Field Group |
The key of the business object field group used by the page to read data classification. This key determines the values of the Data Classification column in the Select Data pop-up. Keep the default value unless otherwise agreed. To configure the business object field group, contact the system administrator. |
|
Column Selector |
When enabled, the data filter is displayed in the filter row, and end users can check the data columns to display without reconfiguring the report. |
|
Filter by Enum Values |
When enabled, enum filtering can be enabled one by one for data items with enumerated values in Select Data, and end users can filter report rows by enum values in the filter row. For example, viewing only devices in the Fault status by device status. |
|
Filter & Sort by Conditions |
When enabled, the Filter entry is displayed in the filter row, and end users can filter report rows by metric thresholds and sort metric columns by clicking the headers. |
|
Visual Grouping on Device Type is currently not supported for direct editing on the configuration page. After importing a page configuration containing deviceGroupKey, this configuration still takes effect; to add or modify this configuration, contact the system administrator.
Publishing the Page
After completing the configuration, publish the page through the following steps to make the configuration take effect for end users:
Select Publish at the upper right of the configuration page.
In the pop-up, enter the modification description of this publishing and other content as the Remarks. The remark will be displayed in the history version list, facilitating later locating and rollback.
Select OK.
Note
Before publishing, make sure that Asset Granular, Asset Type, and Asset Tree Style are all filled in; otherwise, the page cannot be published. If you exit the configuration page without publishing, the changes made this time will be discarded.
Mapping Report Filters to Configuration Items
Each filter that end users see in the filter row is controlled by a switch in the function configuration. The following table lists the correspondence between filters and configuration items, facilitating troubleshooting of the problem that “end users cannot see a certain filter”:
Filter |
Tab |
Configuration item |
Additional condition |
|---|---|---|---|
Asset filter |
Asset Configuration |
Asset Filter |
— |
Dimension filter |
Asset Configuration |
Dimension Filter |
The dimension has registered enumeration values in the report |
Enum filter |
Data Configuration |
Filter by Enum Values |
Enum filtering has been checked for the data item in Select Data, and subtotal by dimension is not currently enabled |
Time interval filter |
Time Configuration |
Time Interval Filter |
The report contains metrics |
Quick time range filter |
Time Configuration |
Quick Time Range |
The report contains metrics |
Custom time range |
Time Configuration |
Time Range |
The value is |
Data filter |
Data Configuration |
Column Selector |
— |
Filter (filter by conditions) |
Data Configuration |
Filter & Sort by Conditions |
Subtotal by dimension is not currently enabled, and the report contains metrics that support filtering |
The filter row is shown below.

The filter row appears only after the page has completed a query. When entering the page for the first time and query conditions are not configured, the page displays “Query conditions are not configured. Click here”.
Configuring Query Conditions
In addition to the page functions, you also need to build a specific metric inquiry report as the initial view that end users see when entering the page. The report configuration is completed in four steps in sequence:
Configure Dimensions and Statistics Rule: determines the asset granularity, asset types, dimension columns, and statistical method of the report.
Select Asset Scope: determines which assets the report includes.
Select Data: determines which data columns the report includes and how they are displayed.
Select Time Scope: determines the time interval and start/end time of the report data.
Configure the report through the following steps:
Select Common KPI Inquiry in the left navigation pane.
Select the report-scope summary bar or More to its right at the top of the page to open the Report Configurations pop-up.
Complete the following four steps in sequence, and then select Apply. Selecting Reset in any step clears all selected content and starts over.
Configuring Dimensions and Statistics Rule
Field |
Description |
|---|---|
Asset Granular |
The query granularity of the report. Select |
Asset Type |
The type of assets in the report. When the asset granularity is |
Dimension |
Dimensions that occupy separate columns in the report and are displayed to the left of asset names; they must be registered in the dimension types of Common Data Service in advance. Select Add to open the dimension selection pop-up. Added dimensions can be sorted by dragging and deleted (required dimensions cannot be deleted). The title displays |
Statistical Method |
The way dimension data is presented. |
Selecting Asset Scope
Check the assets included in the report in Select Asset Scope. The displayed asset tree changes with the asset granularity:
Site: multi-select the site tree.
Device Group: the device group tree.
Device: the site tree plus the device tree. Sites are single-selected when Multi-Site Device Query is disabled; only the site tree is displayed in device big-data mode.
The following functions are also available when selecting assets:
Switch Asset Tree: when the current OU has multiple organization structures configured, you can switch the organization structure at the upper right of the asset tree.
Switch Asset Tree Style: when both styles are enabled in the function configuration, you can switch between
By ListandBy Hierarchy.
Selecting Data
Add the data columns included in the report in Select Data:
Add a single data item: Select + Data to open the Select Data pop-up, search for and check data items in the pop-up by conditions such as data name, identifier, data classification, time interval, data type, and asset type, and then select OK.
Add a data group: Select + Group to create a new group, enter the group name, and then select Add Data within the group. A data group is presented as a second-level header in the report, suitable for grouping metrics of the same type together.
The selected metrics must share a common time interval; otherwise, you cannot proceed to the next step.
Data groups are displayed in the report as follows:
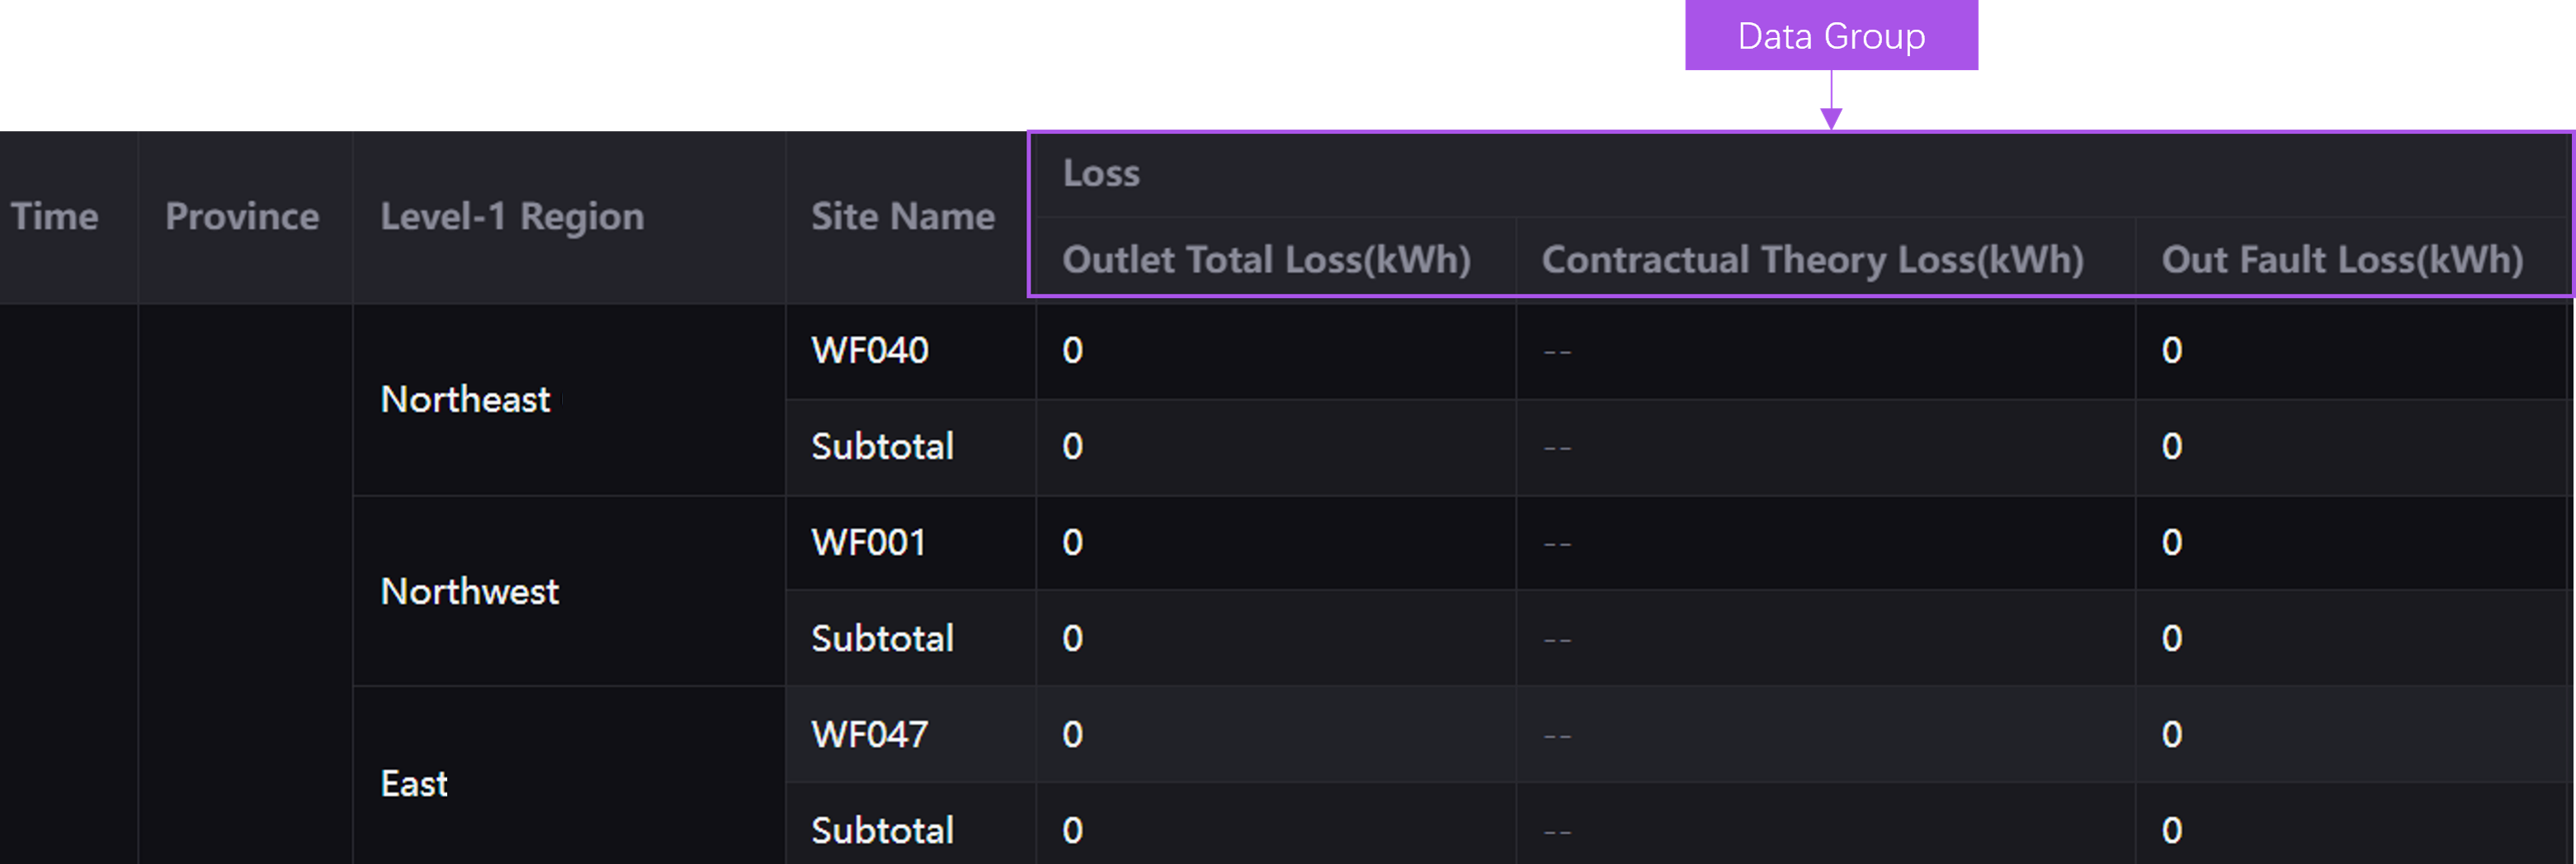
Both data items and groups can be sorted by dragging, and group names support separate input by interface language. After expanding a data item, you can configure the following information:
Field |
Description |
Conditions and Limitations |
|---|---|---|
Name |
The display name of this data item in the report column header; separate input by interface language is supported. |
Up to 50 characters. When left empty, the registered name of the data item is used. |
Unit |
The unit of this data item; separate input by interface language is supported, displayed after the column header name. |
Up to 50 characters. |
Filter by Enum Values |
When checked, end users can filter report rows by the enum values of this data item in the filter row. |
Displayed only when the data item has registered enumeration values, supports enum filtering, and Filter by Enum Values is enabled in the function configuration. |
Unit Multiplier |
Used to adjust the magnitude of the data when it is too large or too small; the value displayed in the report is the original value multiplied by the unit multiplier. For example, when the original data is |
Defaults to 1. Displayed only for numeric data items, not for enumerated data items. |
Condition |
The conditional colors of the data column. Select Add to create a condition row: for numeric data items, configure the value range and color; for enumerated data items, configure the enum values and colors, and enum values already used cannot be selected again. Conditions are evaluated from top to bottom, and only the color of the first matching condition is used. |
Supported only for integer, floating-point data items, or data items with enumerated values. |
Selecting Time Scope
Field |
Description |
|---|---|
Time Interval |
The time interval between adjacent data in the report; the value is the intersection of the time intervals of all selected data items, and is limited by Time Interval in the function configuration. |
Quick Time Range |
Specifies the start and end time by preset ranges; the available options change with the time interval. Displayed only when Quick Time Range is enabled. |
Custom Time Range |
Manually specifies the start and end time of the report data. The selection granularity of the calendar control changes with the time interval; for example, selection is by month when the time interval is |
Note
This step appears only when metrics have been selected and at least one of the time interval filter and quick time range setting is enabled. When the time range is too large, the query fails with the message “The time range is too large, please adjust it and try again”.
Configuring Action Buttons
Action buttons are displayed in the Action column of the report; after selecting one, end users can jump to the specified address with the data of the current row, for example, to the detail page of the device or the work order system. Configure action buttons through the following steps:
Select Common KPI Inquiry in the left navigation pane.
Select Table Settings
 at the right of the filter row.
In the Action Button area, select Add Action; up to 3 can be added. Added buttons can be sorted by dragging and deleted.
Configure the following information in the Action Button Configuration pop-up.
Field
Description
Conditions and Limitations
Button Name
The name of the button displayed in the action column; separate input by interface language is supported.
Required, up to 50 characters.
Button Activation Condition
The display condition of the button. After selecting Add Condition, specify a metric, an operator (
<,<=,=,>,>=), and a threshold; the button is displayed only on rows that meet the condition. For example, displaying the repair button only when the device status is “Fault”. When the metric is enumerated, the operator is fixed to=and the threshold changes to selecting from enum values.Up to 1 condition. Candidate metrics are the filterable metrics among the selected data items.
Opening Method
The presentation form of the jump. Select
Open in new page,Open in same page,Open in bottom drawer,Open in right drawer, orOpen in centered pop-up. Select a drawer or pop-up when end users need to keep the report context.Required; defaults to
Open in new page.
Drawer Size (% of Screen)
The proportion of the page occupied by the drawer, ranging from 50–85. Displayed only when the opening method is
Open in bottom drawerorOpen in right drawer.Defaults to 55%.
Pop-up Window Size
The width and height of the pop-up, both ranging from 1–10000 px. Displayed only when the opening method is
Open in centered pop-up.Defaults to 520×424 px.
URL
The jump address. Data identifiers can be used as placeholders in the address, and the system replaces them with the values of the current row.
Required, up to 500 characters.
Select OK to close the pop-up, and then select OK in the table settings to save.
Note
The action button configuration is visible only to users with the template-configuration permission, and is not provided when the statistical method is Summary.
Managing Report Templates
A report template is used to fix a complete set of query conditions and display settings, avoiding repeated configuration by end users each time. A template mainly includes the following information:
Asset granularity, asset types, and asset scope
Dimensions and statistical method
Data columns, data groups, and column order
Time interval and time range
Subtotal settings, decimal places, number of frozen columns, and action buttons
Filter conditions and enum filtering
Templates are divided into two types:
My Template: visible only to the creator, used to accumulate personal analysis habits.
OU Template: visible to all end users in the OU; the template-configuration permission is required to create and edit one. Used to distribute a unified report standard to all users.
Enabling Report Templates
Select Common KPI Inquiry in the left navigation pane.
Select Function Configurations
at the upper right of the page.In Basic Configuration > Template, select Enable.
In Template Menu Style, select
CardorDrop-down.Select Publish and select OK in the pop-up.
The card-style template menu is shown below.
The drop-down template menu is shown below.
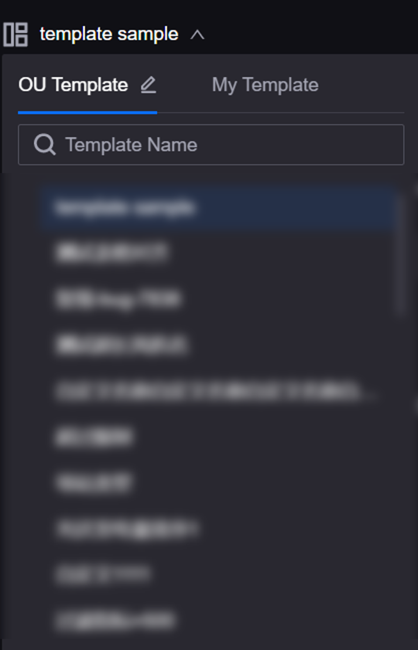
Saving the Current Report as a Template
Save the configured metric inquiry report as a new template or update the current template through the following steps:
Select Common KPI Inquiry in the left navigation pane.
Hover the cursor over the settings button
 and select Save Template. Before saving a template, the page needs to have completed at least one query.
Enter the following information in the Save Template pop-up.
Field
Description
Template Name
Enter the name of the template; separate input by interface language is supported, up to 30 characters. The template cannot be saved when the name is empty. When exporting report data, if a template is currently applied, the exported file is named after the template name.
Template Description
Enter the description of the template, up to 100 characters. When left empty, the system automatically generates a description based on the selected attributes and metrics.
Template Type
Select
OU Templateto allow other users in the OU to also use this template, or selectMy Templateto restrict this template to the current user. Only users with the template-configuration permission can select the template type; other users can only save it as My Template.
Template Category
Select the group the template belongs to, or create a new group directly here. When not selected, the template is placed in the default group.
Save as OU default view / Save as my default view
Select Yes to display the current report by default when entering the Common KPI Inquiry page. When the template type is
OU Template, this field is Save as OU default view, taking effect for all users in the OU; when it isMy Template, it is Save as my default view, taking effect only for yourself. A personal default view is loaded with priority over an organization default view. When a template is set as the default view, the default view mark of other templates of the same type is automatically cancelled.
Select OK.
Saving the Modified Template as a New Template
If a template is currently applied on the page and the original template has been modified, save the modified template as a new template through the following steps, keeping the original template unchanged:
Select Common KPI Inquiry in the left navigation pane.
Hover the cursor over the settings button
and select Save as Template. Save as Template is unavailable when no template is applied on the current page.In the Save Template pop-up, enter the template name, template description, template type, template group, and other information. The description of each field is the same as Saving the Current Report as a Template.
Select OK.
Editing a Template
Modify the name, description, and group of a template through the following steps. The query conditions and display settings in the template are not modified; to adjust them, apply the template and save it again.
Select Common KPI Inquiry in the left navigation pane.
Select Template.
Select Edit
 of the target template.
Edit the name, description, and group of the template in the pop-up, and select OK.
When a user without the template-configuration permission edits an OU template, the system saves the modification result as a new personal template, and the original OU template remains unchanged.
Deleting a Template
Select Common KPI Inquiry in the left navigation pane.
Select Template.
Select Delete
 of the target template.
Select OK in the pop-up.
Managing Template Groups
Template groups can be used to manage templates by category based on information such as the applicable scenario, analysis object, and time range of templates. When there are many templates, grouping can significantly shorten the time for end users to find templates. The template panel supports searching by group name; when a group name is matched, all templates under that group are displayed.
Creating a Group
Select Common KPI Inquiry in the left navigation pane.
Select Template to open the template panel.
Select Edit Category to open the group configuration pop-up.
Select Group and enter the group name. After creating a group, you can add templates to the template group when saving a template, saving a template as a new template, or editing a template.
The groups of OU templates can be maintained only by users with the template-configuration permission, and the groups of My Templates are maintained by their owners.
Editing a Group
Select Common KPI Inquiry in the left navigation pane.
Select Template to open the template panel.
Select Edit Category to open the group configuration pop-up.
Select the template group tab and edit the group name.
Sorting Groups
Select Common KPI Inquiry in the left navigation pane.
Select Template to open the template panel.
Select Edit Category to open the group configuration pop-up.
Drag the sort icon next to the group tab to edit the display order of each group in the template panel.
Deleting a Group
Select Common KPI Inquiry in the left navigation pane.
Select Template to open the template panel.
Select Edit Category to open the group configuration pop-up.
Select the delete icon
 at the right of the group tab, and confirm in the prompt.
Note
Deleting a group also deletes all templates under the group, and this cannot be recovered. To retain the templates, move them to another group first.
Restoring History Versions
The history version list contains information such as the version number, modifier, modification time, and remark of published pages. To use a previous Common KPI Inquiry page configuration, restore the current page to a history version through the following steps:
Select Common KPI Inquiry in the left navigation pane.
Select Function Configurations
at the upper right of the page.Select History Version to open the history version list.
In the history version list, select Restore of the corresponding version.
Select OK in the pop-up.
Importing or Exporting Page Configuration
Common KPI Inquiry supports importing or exporting the following content in the form of JSON files, enabling the migration and reuse of the same page across different applications or environments:
Page function configuration
Query conditions and data column configuration
Templates and template groups
Exporting Page Configuration
Select Common KPI Inquiry in the left navigation pane.
Select Function Configurations
at the upper right of the page.Select Import/Export > Export, and the browser automatically downloads the configuration file.
Importing Page Configuration
Select Common KPI Inquiry in the left navigation pane.
Select Function Configurations
at the upper right of the page.Select Import/Export > Import.
Upload the configuration file in the pop-up and select OK.
After importing, the content in the configuration file is filled into each tab, and you can continue to adjust it before publishing. Imported asset types that do not exist in the current OU are automatically filtered out, so it is recommended to review each tab after importing.
Note
The import does not take effect when the configuration file lacks required fields. If the configuration does not change after importing, check whether the configuration file is complete.
Configuring URL Parameters
In addition to the above configuration, application developers can enable or disable page functions by configuring parameters in the menu URL, or specify the default query conditions when the page opens. For more information, see URL Parameters.