Using Common KPI Inquiry
This page describes how application users view Metric Inquiry Reports and detailed asset data on the Common KPI Inquiry based on the configuration of Application creators. An example of a Common KPI Inquiry page displays as below.
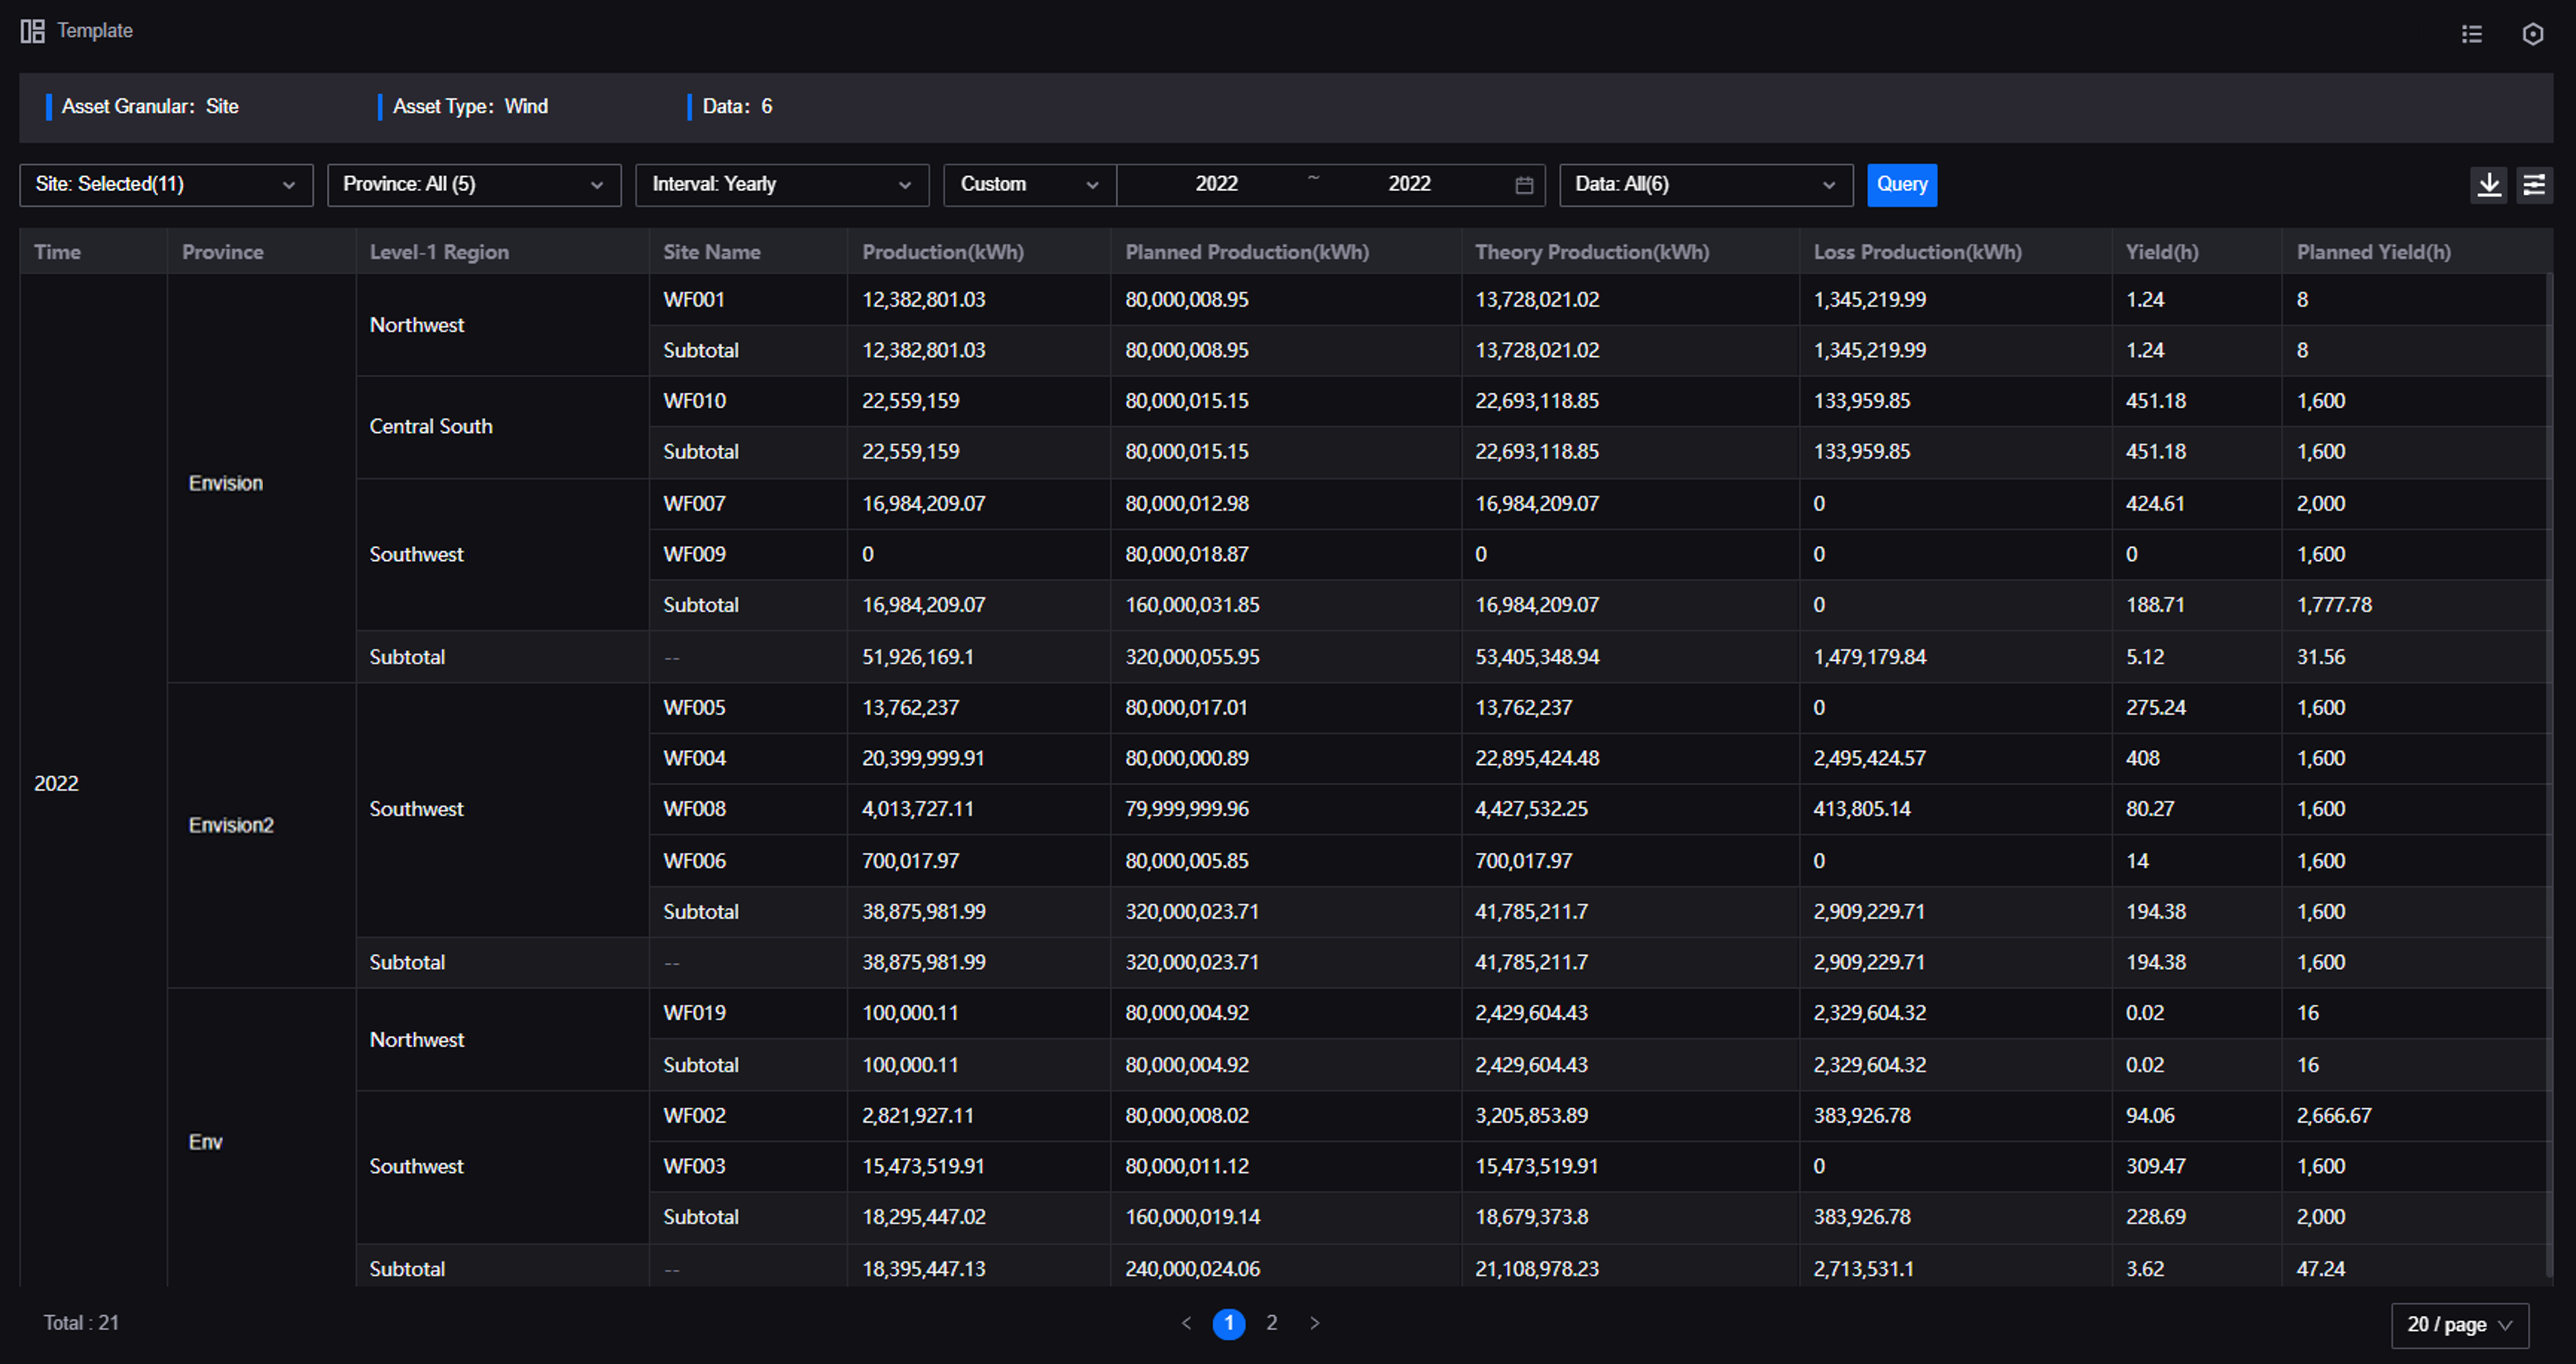
For more information about the elements on a Common KPI Inquiry page, see Exploring Common KPI Inquiry.
Note
The layouts and functions in your applications might be different from the contents introduced in this article, because of the customization on layouts and functions for Unified Monitoring pages. Contact your application creators for more information.
Prerequisites
Before you start, make sure that you are assigned with the required asset permissions, operational permissions, and a menu group containing the Common KPI Inquiry page. If not assigned, contact your application administrators.
Editing Reports
Select Common KPI Inquiry from the left navigation pane.
Note
The menu name in your applications might be different from the name in this article, because of the customization on menu names for Unified Monitoring pages. Contact your application administrators for more information.
Select Table Settings
 to open a popup window and configure the following information:
Field
Description
Decimal Places
Configure the number of displayed digits for the decimal part of data. For example, select
2and the data will be accurate to the percentile.Freeze Columns
Freeze specified columns to make them visible while scrolling the table.
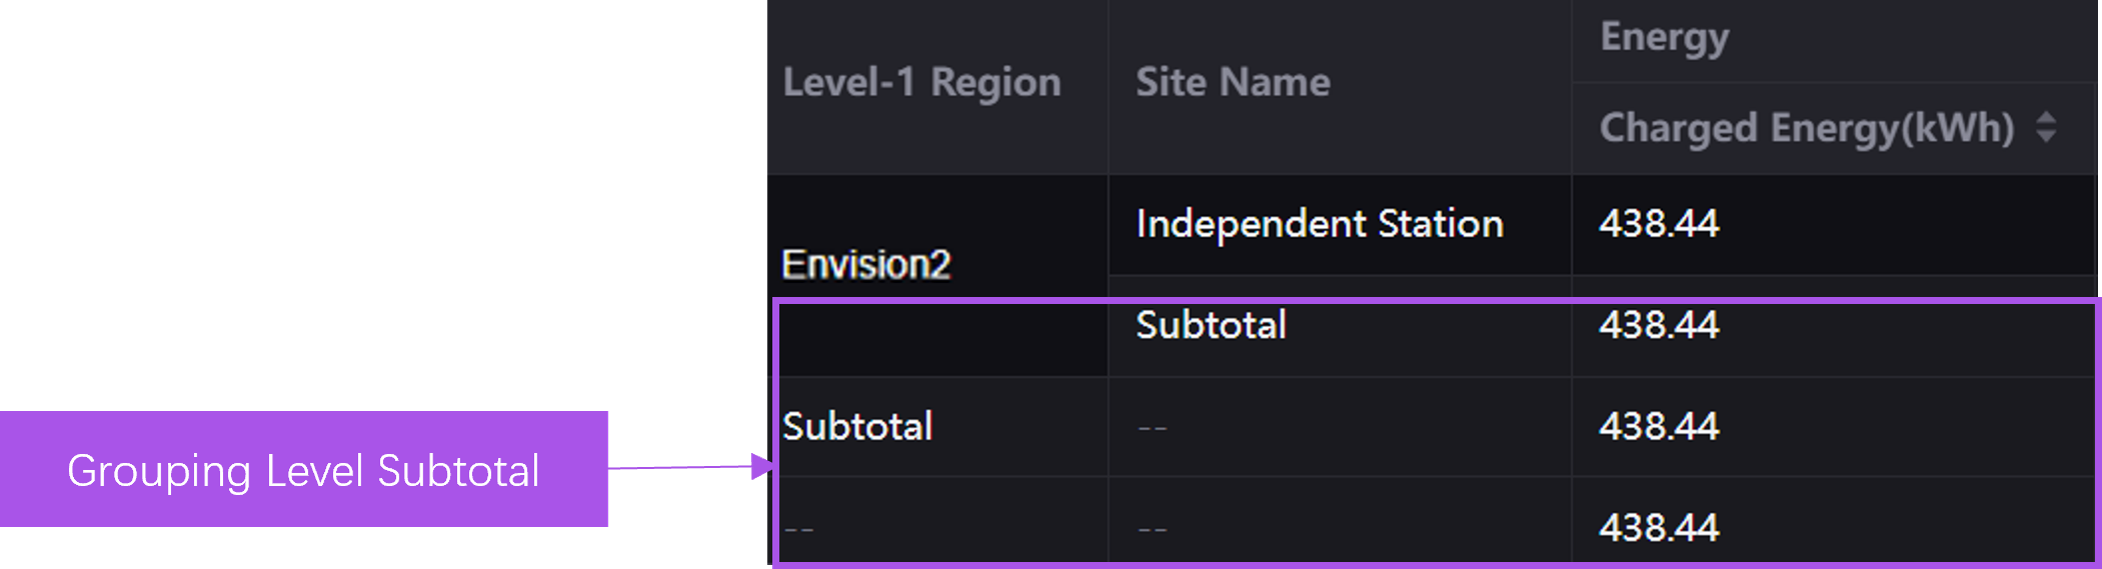
Grouping Level Subtotal
Display the summarized data in each grouping level, which is shown as below.
Select OK.
Filtering Assets
You can filter assets or asset data by the following filters on the Common KPI Inquiry page:
Asset Filter: select the assets displayed on the reports.
Grouping Level Filter: select assets by the grouping levels of the reports.
Time Filter: specify the start time and end time of the data in the reports.
Data Filter: select the data fields displayed on the reports.

Note
Make sure the application creator enabled the specified filters. Contact the application creator to enable or disable the specified types of filters.
Filter assets or asset data by the following steps:
Select Common KPI Inquiry from the left navigation pane.
Select the corresponding filters and configure the filtering conditions from the dropdown list.
Select Query to apply the filtering conditions, and the assets or asset data that meet the conditions displays on the page.
Filtering Data
Filter the data that meeting specified conditions in the reports by the following steps:
Select Common KPI Inquiry from the left navigation pane.
Select Filter
 to open the popup window.
Configure filter conditions in the popup window. To configure multiple conditions, select Add Filter and select
andororlogic.select OK, and the reports only display the data that meet the configured conditions.
Applying a Template
The template of Common KPI Inquiry contains the configuration of asset granular, asset type, grouping level, statistics rules, data Fields, aggregation method, attributes, data field order, time interval and time scope. Apply a template to view the asset and asset data in the template by the following steps:
Select Common KPI Inquiry from the left navigation pane.
Select Templates to open the template panel from the top left corner.
Select template names in Recent Templates or templates in the Template List below to apply the target template.
Exporting Data
To view or modify the current Common KPI Inquiry page offline or for other purposes such as archiving, export the data information on the current page as an Excel file by the following steps:
Select Common KPI Inquiry from the left navigation pane.
Select Export as EXCEL
 to export the data information on the current Common KPI Inquiry page.