Single-Page Application Overview
A single-page application (SPA) integrates multiple DTV (Digital Twin Visualization) pages within a single page, leveraging a navigator to associate data across different pages. This approach provides a more unified, efficient, and flexible data insight experience.
In a single-page application, you can configure the linkage between pages, data, and filters. When users switch the filters, the application will display different pages and data accordingly.
Application Scenarios
Single-page applications are commonly used in the following scenarios:
Asset Management Platform
By combining filters and multiple canvases, application builders can build a global, visual asset operation management and control platform for operation and maintenance personnel to monitor and analyze the production and consumption of resources in the site and the operation data of assets.
In the Resources tab page, operation and maintenance personnel can view resource data in the selected area, such as electricity consumption, power generation, energy usage trend charts and other data, to help understand the resource utilization of the site.
In the Assets tab page, operation and maintenance personnel can view the real-time data of assets in the selected area, including asset online rate, number of active alarms of assets, station status ranking, etc., and discover possible problems with assets in a timely manner. Improve operation and maintenance efficiency.
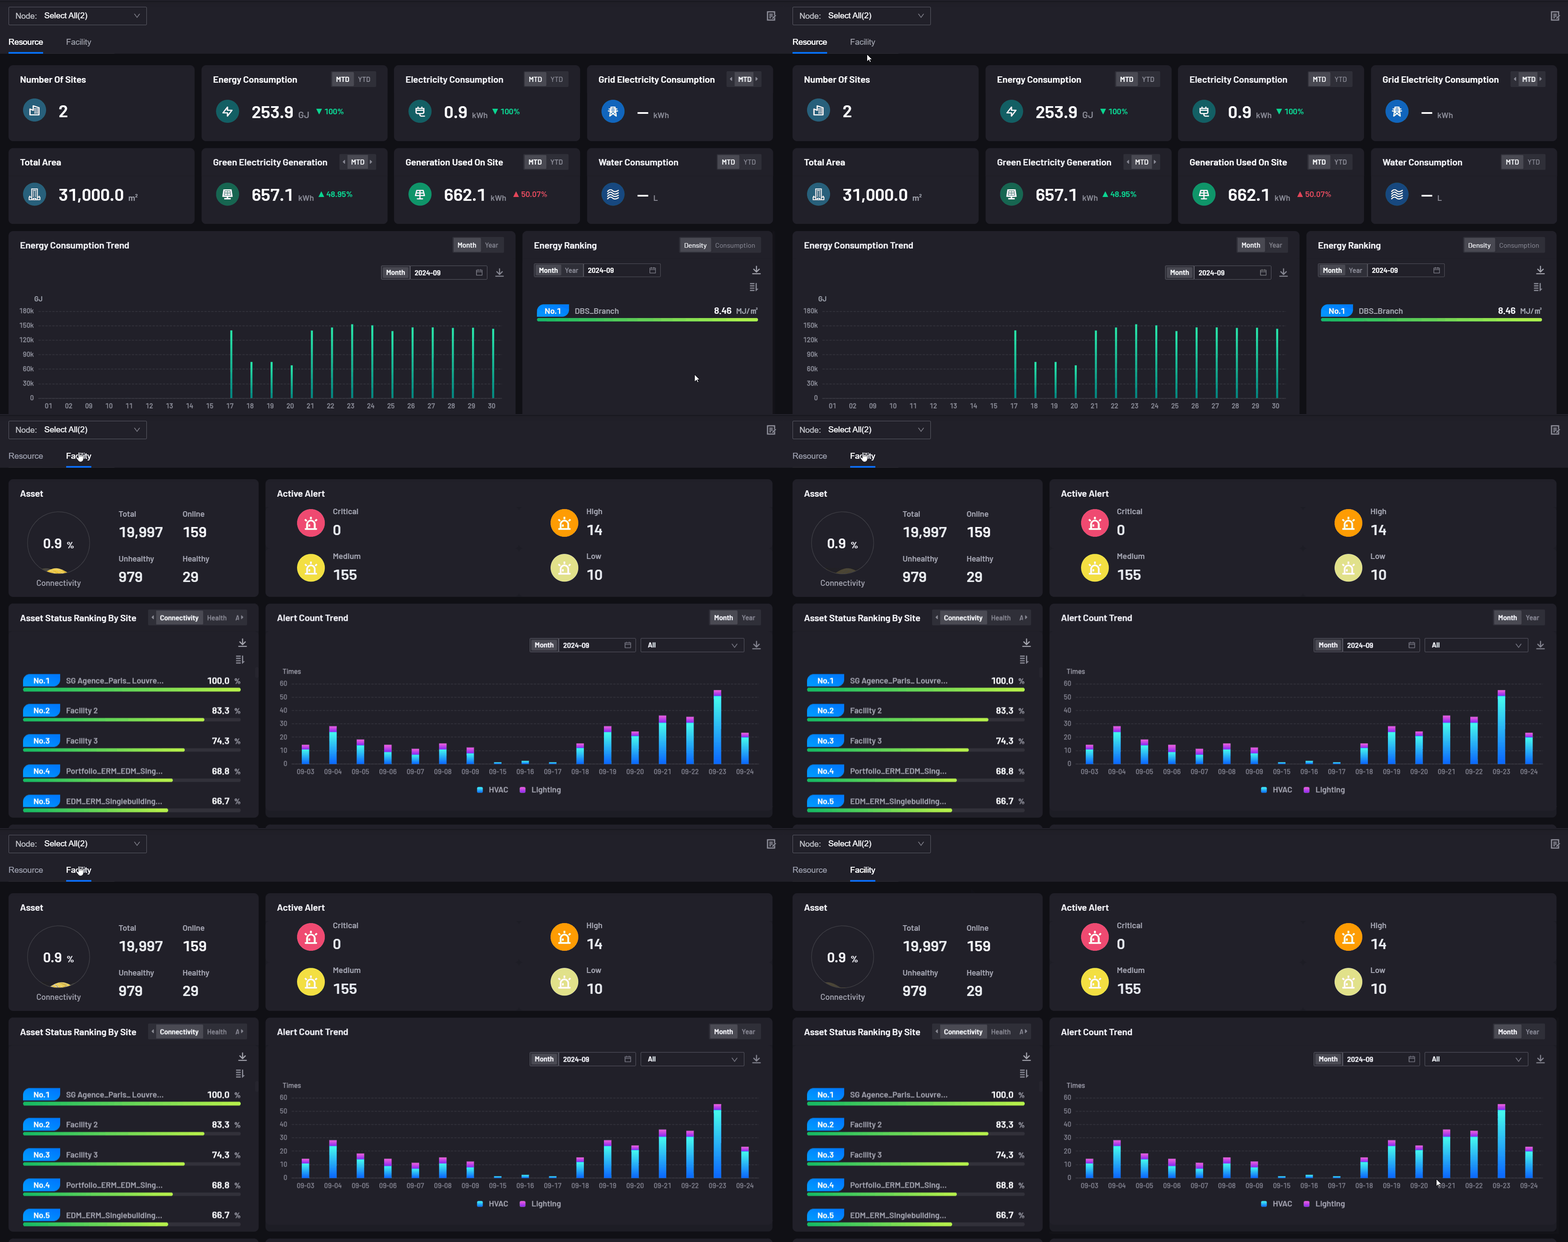
Energy Monitoring Panel
In a single-page application, “site filter + tab” and multiple canvases can be added to integrate the data overview with various energy dashboards, helping enterprises to fully understand the asset usage of the energy system. The page contains a total of 10 tabs. If you switch to any tab, the operation and maintenance personnel can view the corresponding dashboard of the selected site, track the energy consumption and operating data of various equipment in a timely manner, and optimize the scheduling strategy accordingly to improve the overall energy efficiency and sustainability.

Key Concepts
The page built by a single-page application consists of the following parts:
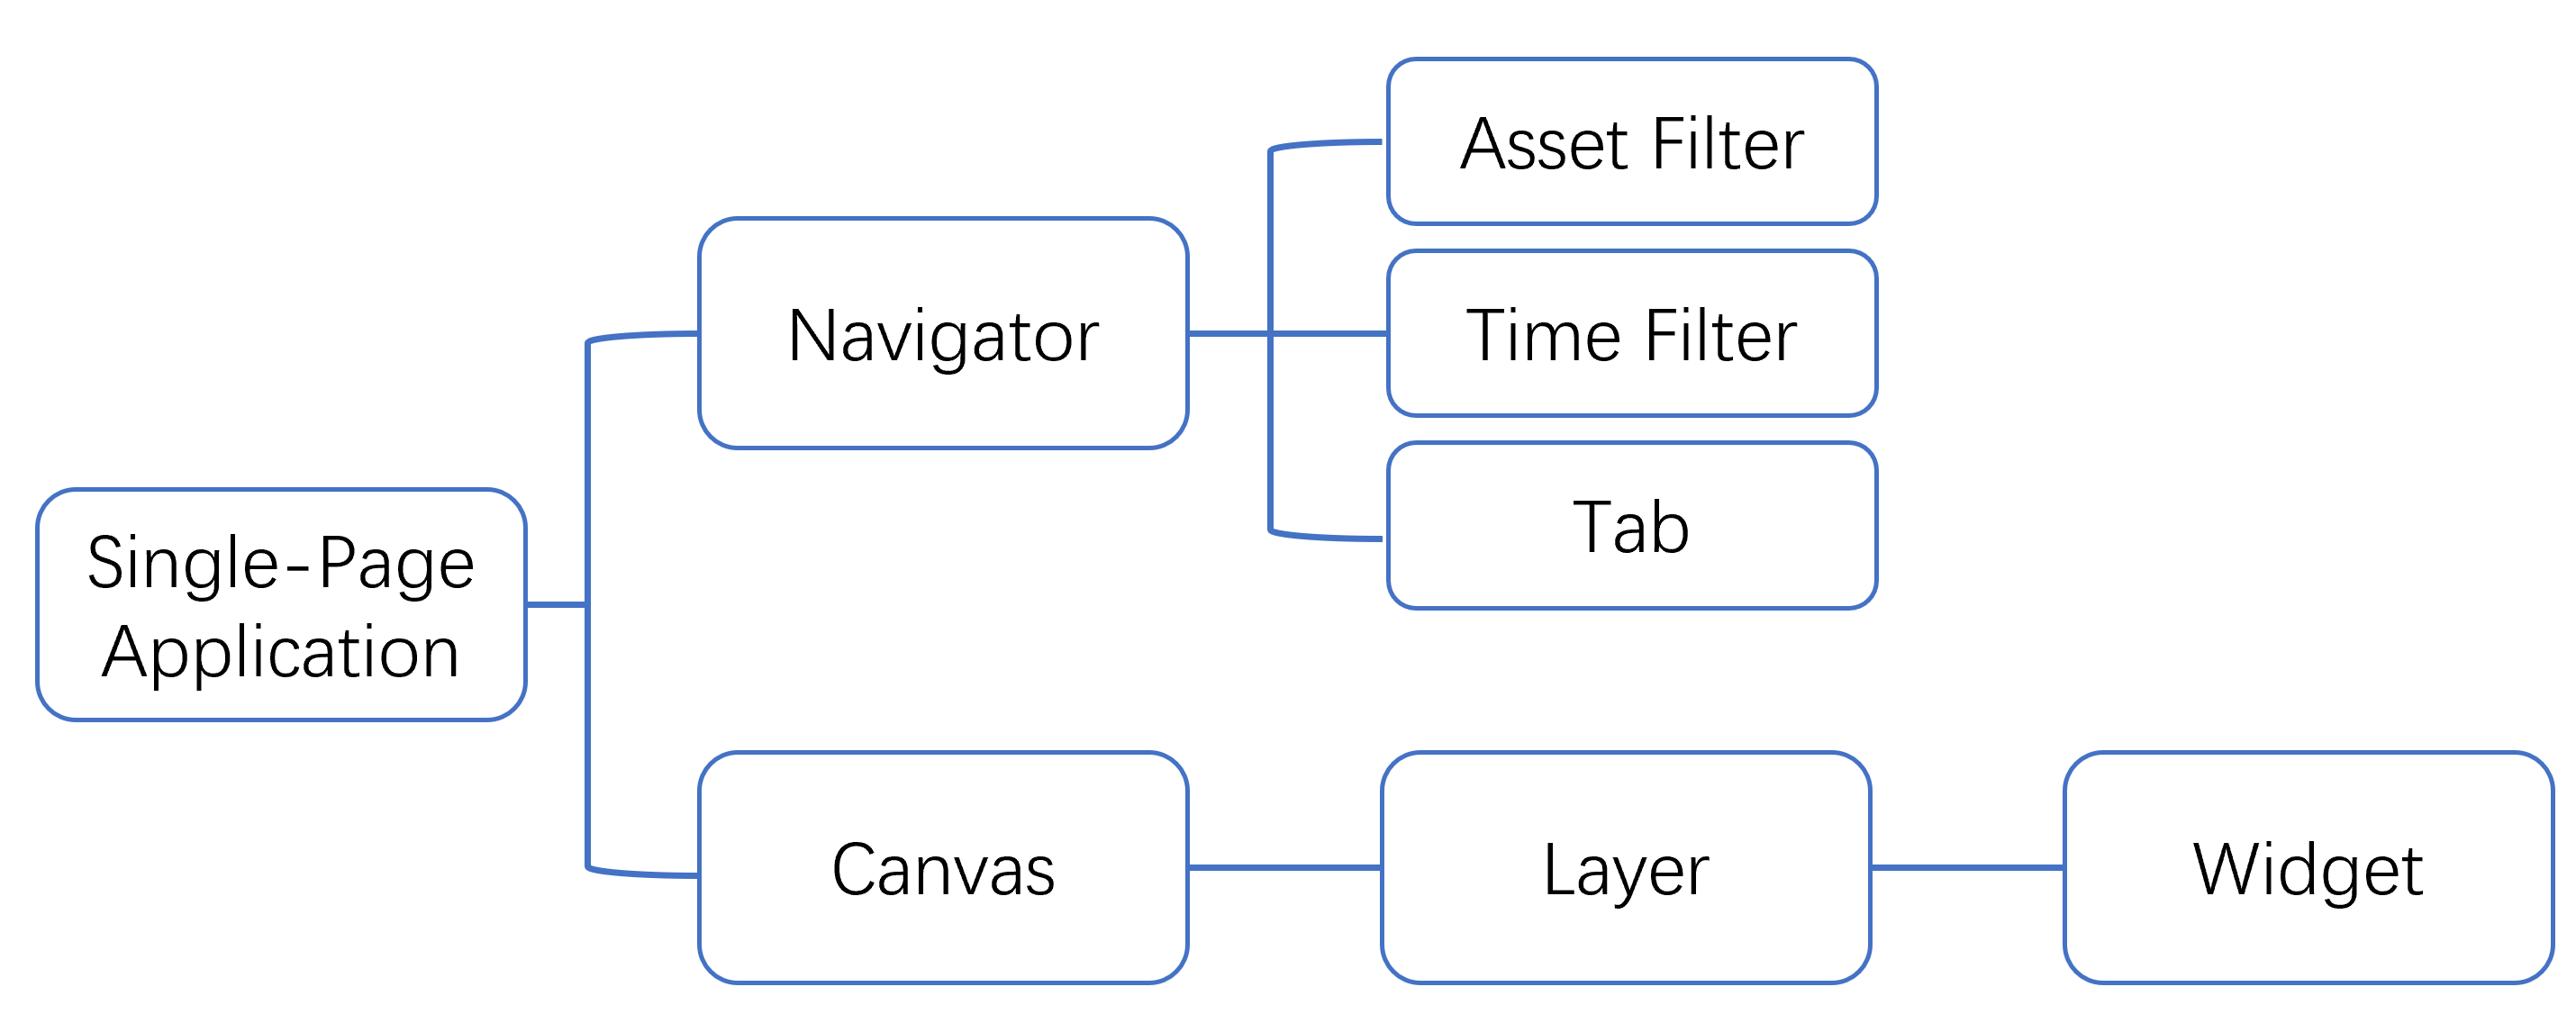
Their location on the page is as follows:
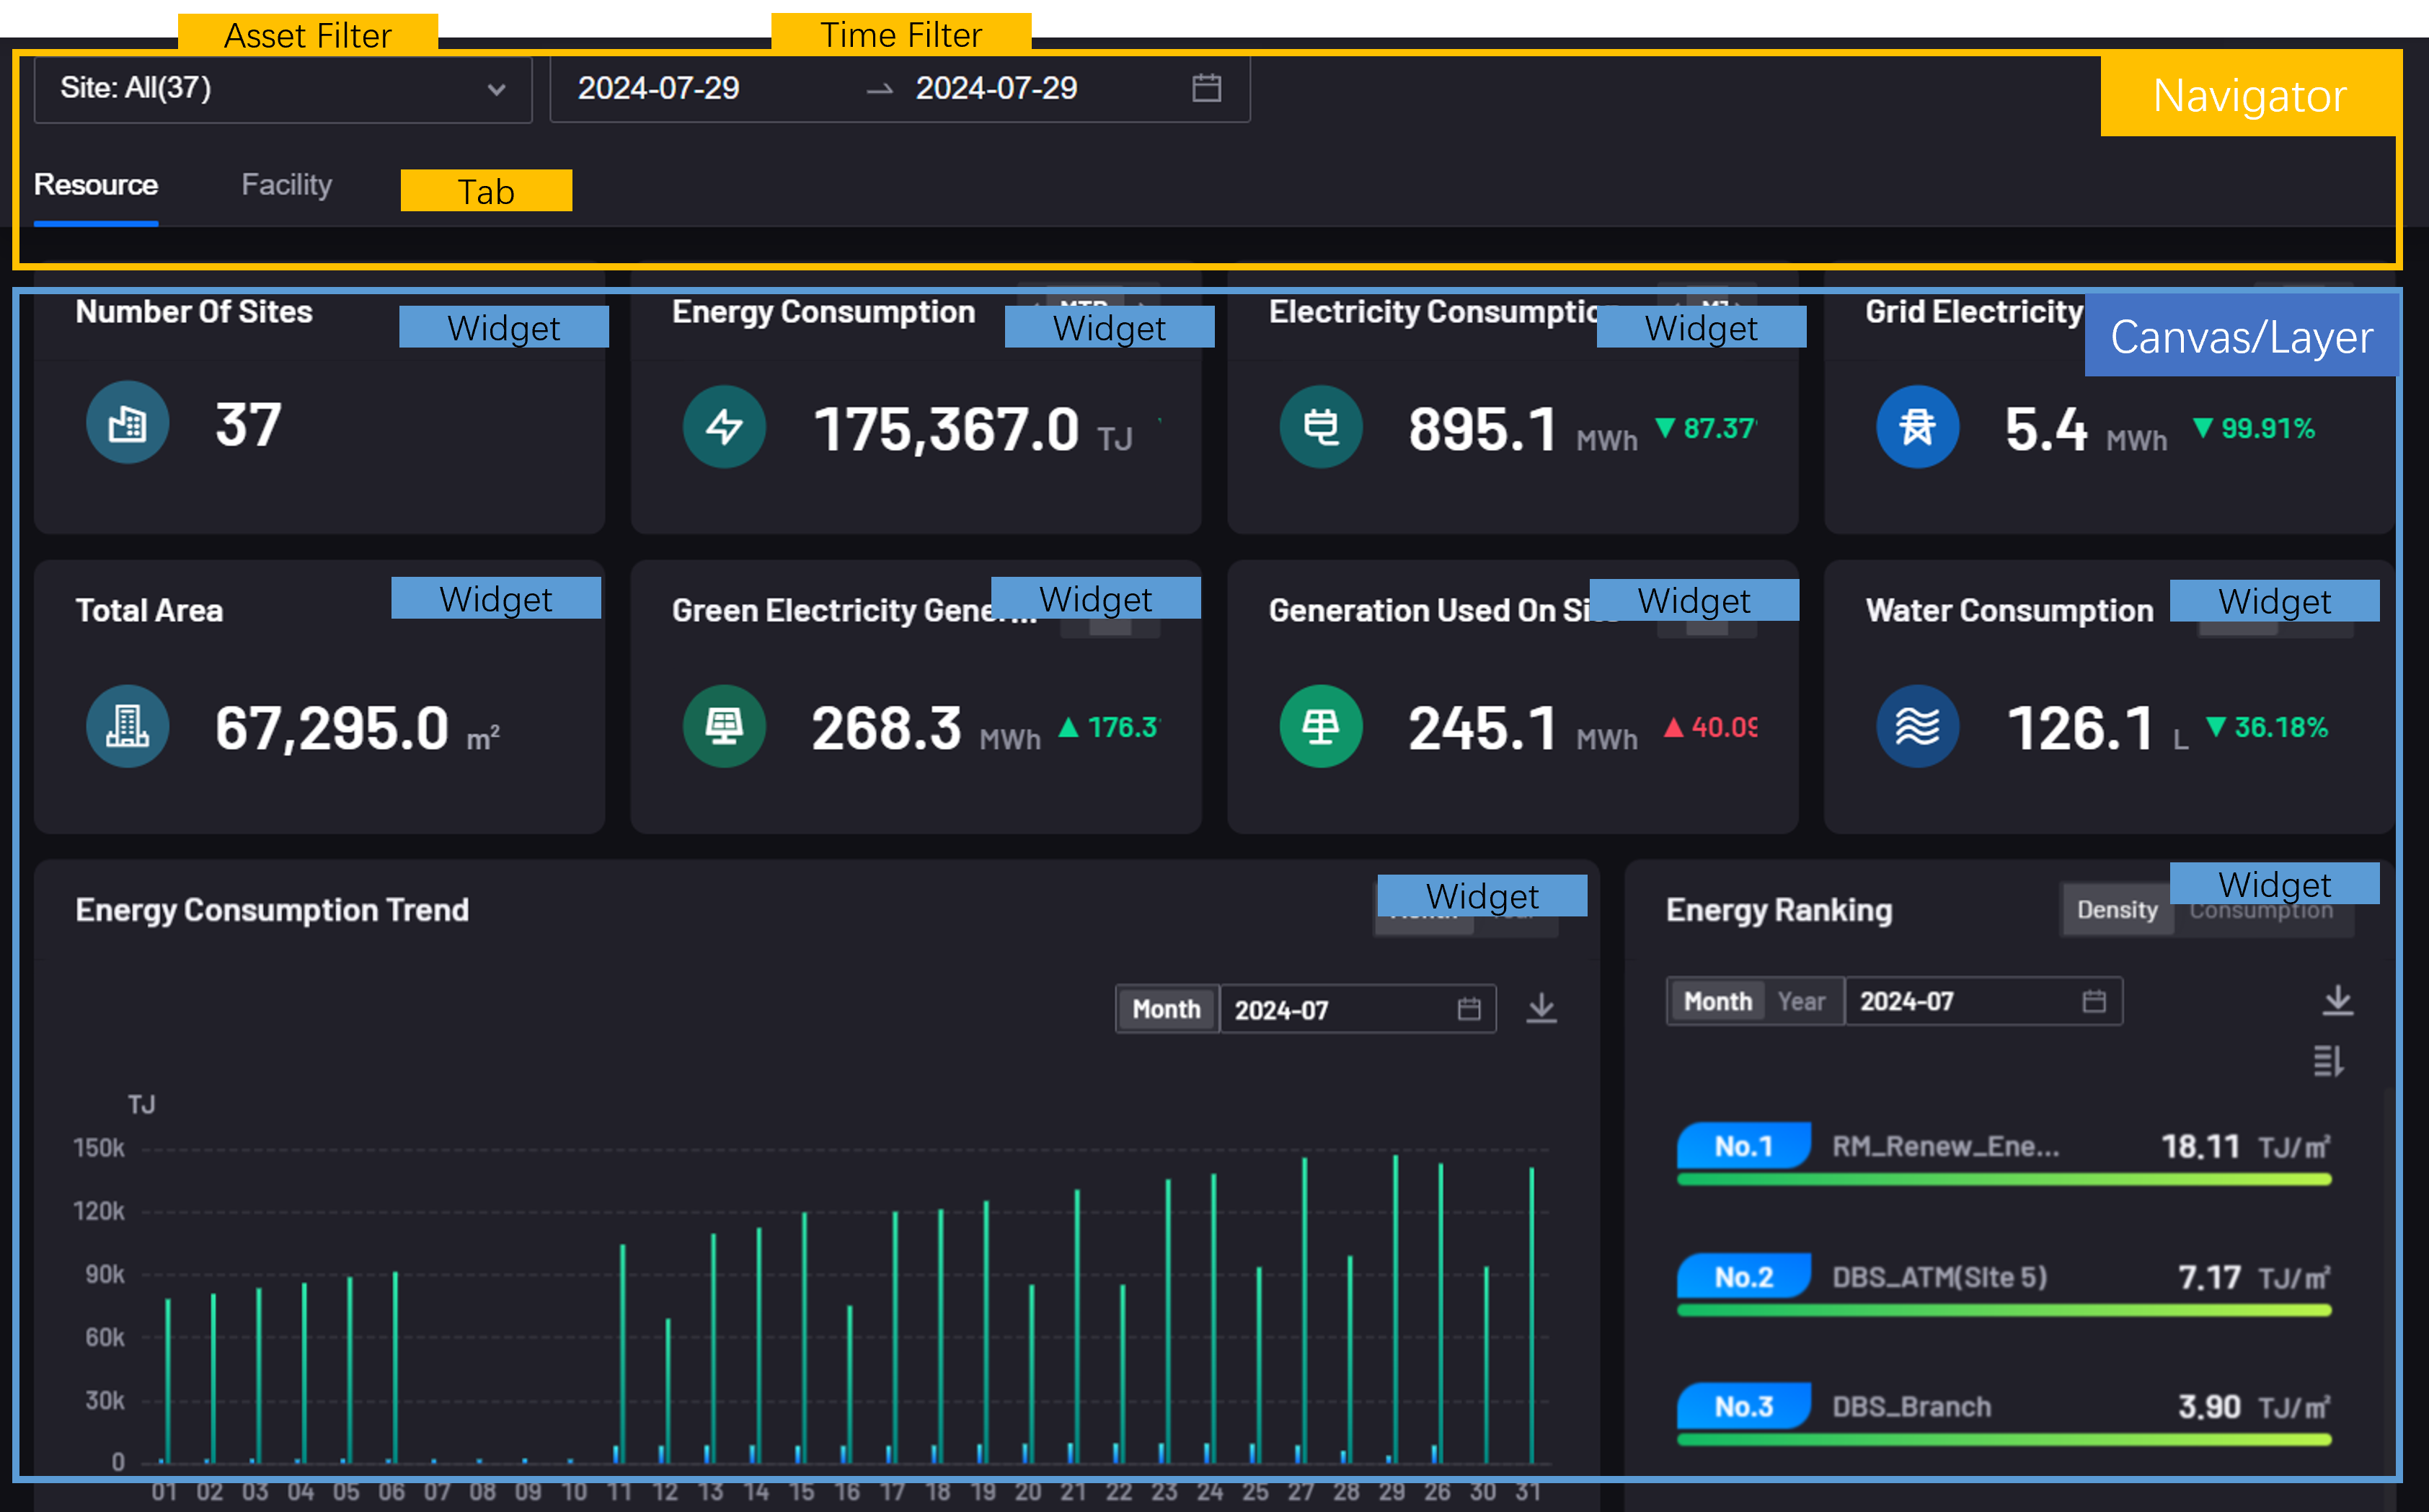
Canvas
The canvas is the basic level of a single-page application. It is like a blank drawing at the bottom of the screen. You can place multiple layers on the canvas and add multiple widgets or elements within the layers. When users switch filter conditions and tabs, they can switch canvases to obtain a more three-dimensional and comprehensive information insight.
The following 2 canvas types are now supported:
Single Layer Canvas: Similar to the dashboard page, all widgets are on the same layer.
Multi-layer canvas: Widgets in the canvas are displayed and managed in layers, and can be used to build map monitoring type pages. For example, layer 1 serves as the map layer and layer 2 serves as the data visualization layer. When the user clicks on a certain area on the map, the data is filtered based on this area and displayed in layer 2.

Layer
Layers are hierarchical management units for widgets, elements, and other content, which are invisible to users of the application. Layers divide page content into different levels, and each level can independently display and manage different widgets. for example:
The first layer is geographical location information, such as device distribution map
The second layer is data visualization of equipment operating status
Layers must be placed on the canvas, and a maximum of 2 layers can be placed on a canvas. The location range of content on the layer is determined by Layer Layout. The following layer layouts are now supported:
Full-screen panel: It can be designed as a common dashboard page, or a map widget can be placed as a device distribution map at the bottom of the page.
Left or right panel: Suitable for pages composed of multiple layers. It is placed on the upper layer of the page and displays data according to the user’s filtering conditions.
You can define the contents of each panel on a layer as follows:
When the panel is embedded in the editor, widgets can be added to build custom pages.
Insert external links in the panel and display existing pages on the panel.
Widget
Widgets are the core of data visualization, displaying data in various charts and styles. Widget sources are divided into:
Base: The same standard widget library as the dashboard page.
Customized: User-defined dashboard widgets within the OU.
Template: The widget template that the current account in the OU has the right to use.
Widgets need to be placed on the layer, and the placement range is determined by the layer layout. Supports adding widgets in the following ways:
Drag from the widget library on the left to the layer panel.
Introduce widgets and configurations of existing dashboard pages. Only panels that fill the full screen are supported.
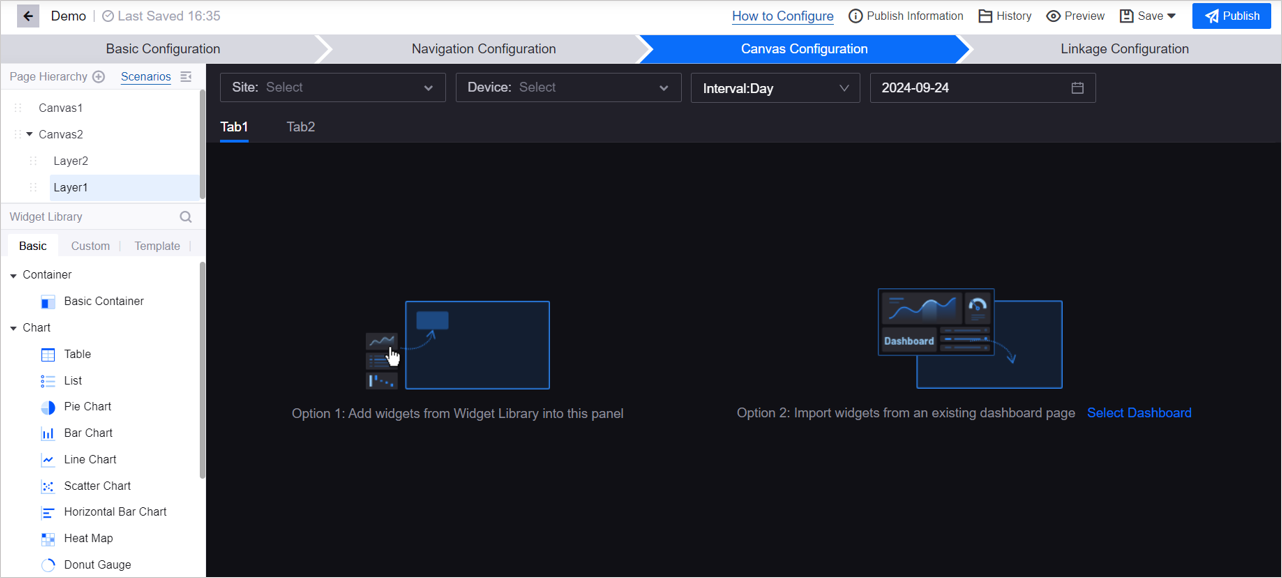
Linkage Configuration
In a single-page application, you can configure associations for the above objects to allow users to flexibly switch between different pages and data. Association configuration is divided into two categories: Canvas Linkage and Parameter Configuration.
Canvas Linkage
Associated canvas refers to associating the navigator and the canvas, which can achieve the following effects: when the user specifies a certain condition in the navigator, canvas A is displayed. When the user specifies another condition, display the B canvas. For specific operations, see Configuring Single-Page Application.
There are different configuration methods for associating the canvas depending on the type of navigator:
Navigator type |
Configuration required to associate canvas |
Effect |
|---|---|---|
Site Filter |
|
When the user specifies an asset in the filter, and the attribute value of any asset is consistent with the value listed in the condition, the corresponding tab is displayed, and the canvas can be switched through the tab. Only the default canvas is displayed when the asset’s property value is empty or does not meet the criteria. |
Site filter + tab |
|
When the user specifies an asset in the filter, and the attribute value of any asset is consistent with the value associated with the tab, the corresponding tab is displayed, and the canvas can be switched through the tab. Only the default canvas is displayed when the asset’s property value is empty or does not meet the criteria. |
Site and Equipment Filters |
|
When the user specifies an asset in the filter, and the attribute value of any asset is consistent with the value listed in the condition, the corresponding tab is displayed, and the canvas can be switched through the tab. Only the default canvas is displayed when the asset’s property value is empty or does not meet the criteria. |
Station and equipment filter + tab |
|
When the user specifies an asset in the filter, and the attribute value of any asset is consistent with the value associated with the tab, the corresponding tab is displayed, and the canvas can be switched through the tab. Only the default canvas is displayed when the asset’s property value is empty or does not meet the criteria. |
Time Filter |
Associates a canvas with a time interval value. |
Display the canvas at intervals specified in the filter. |
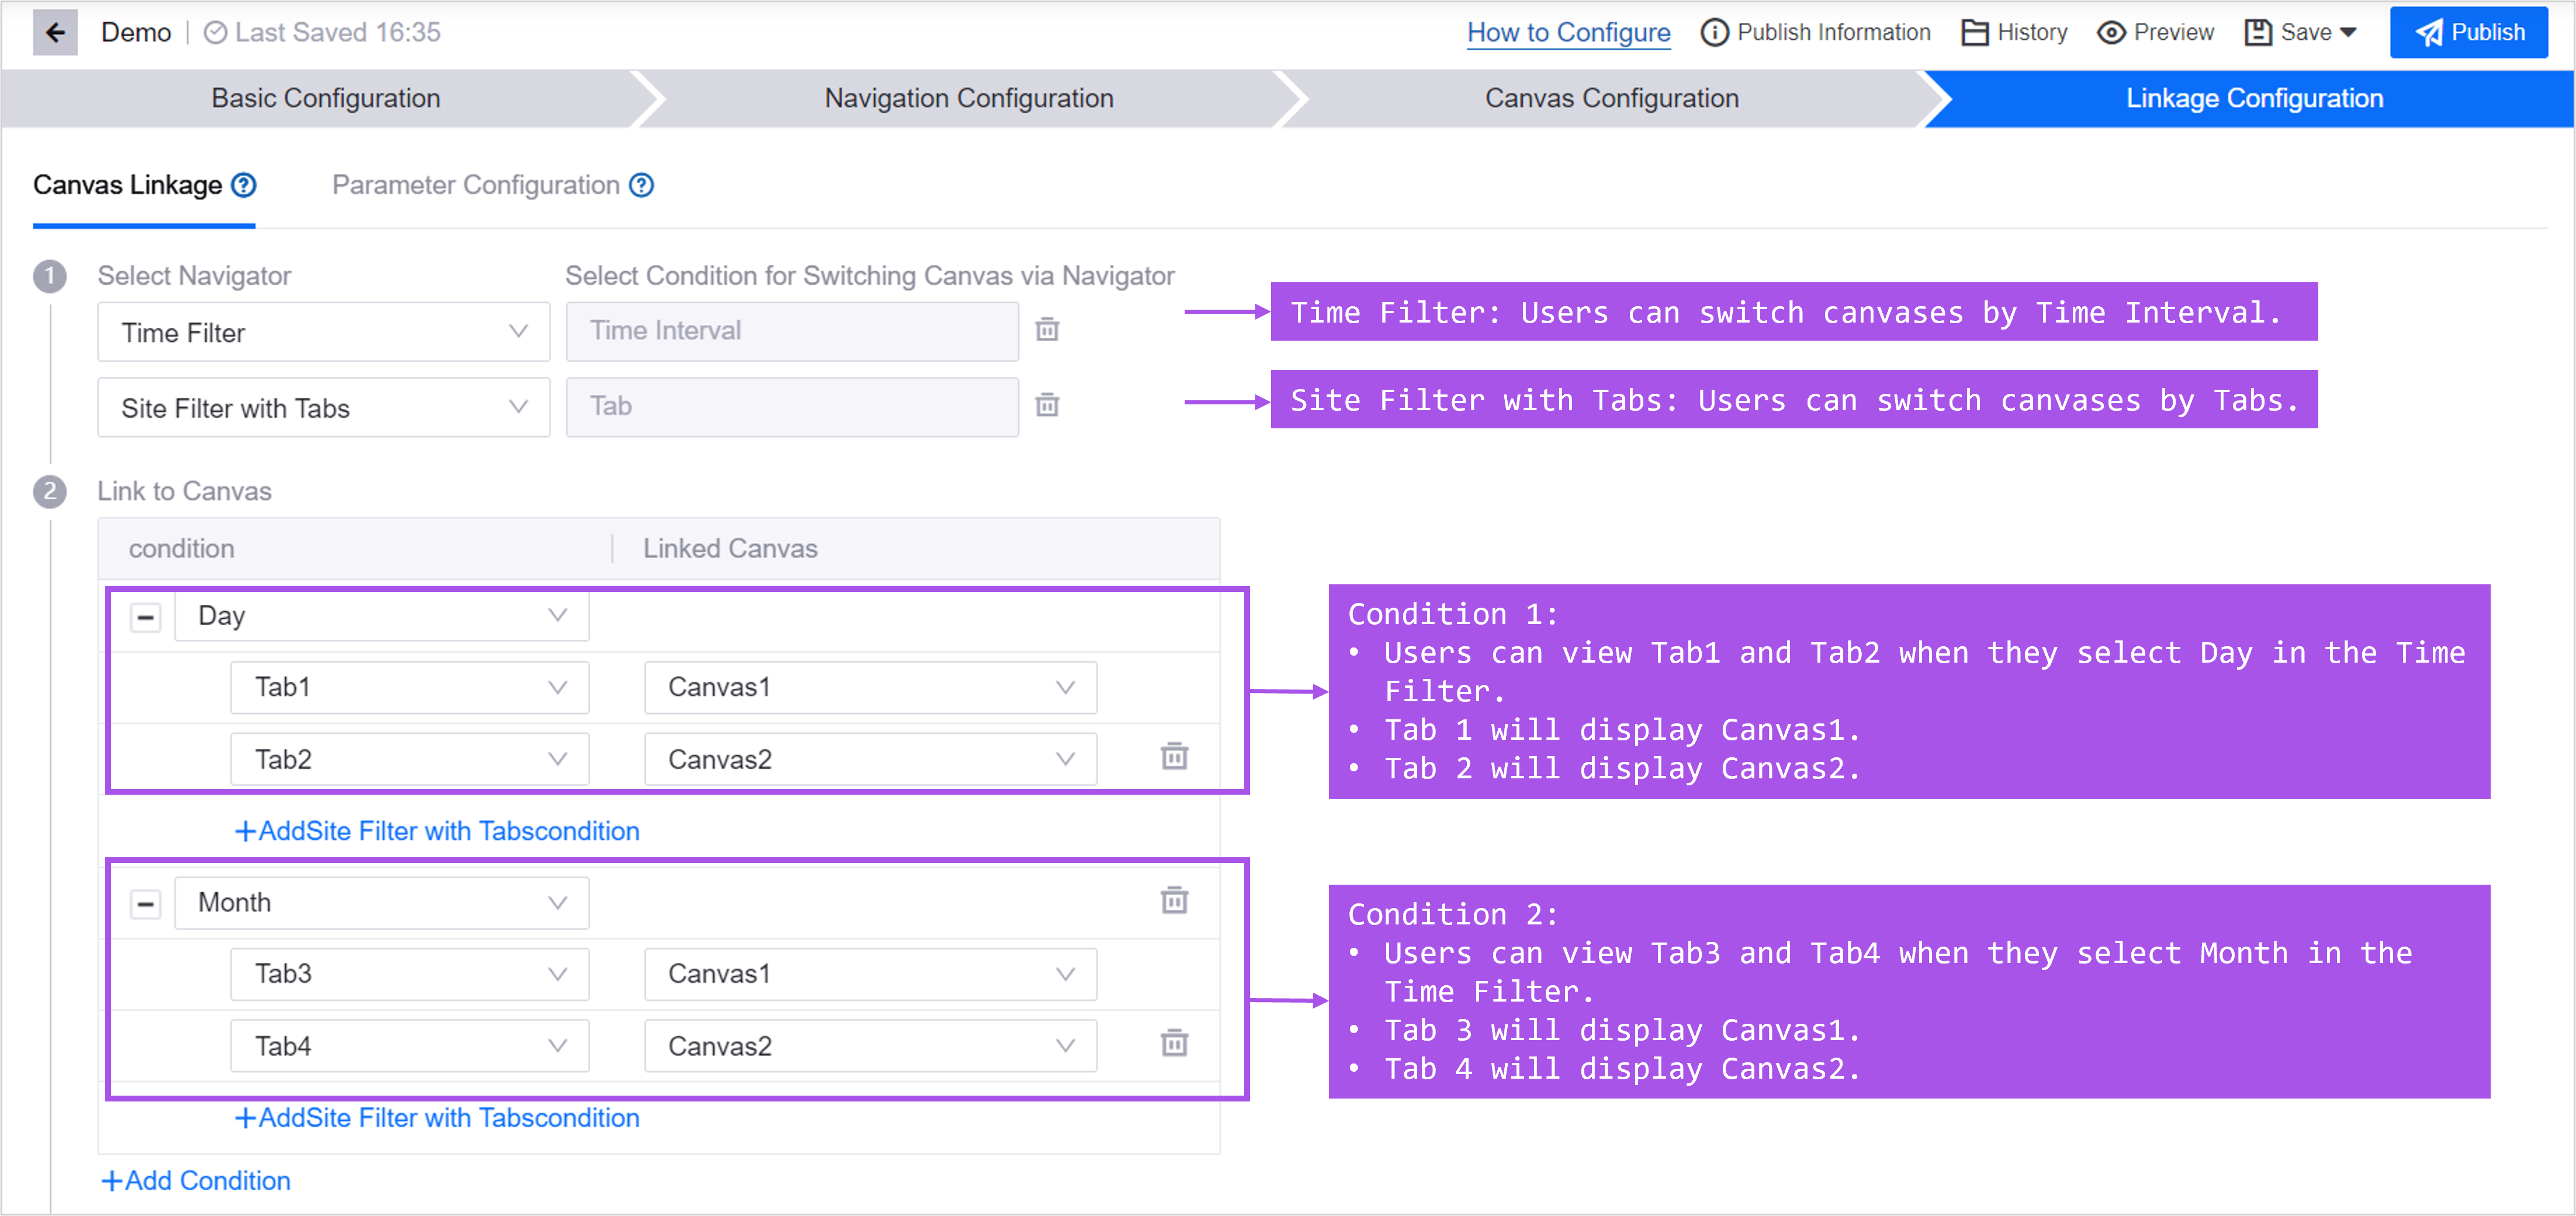
Example 1: Time filter + site filter + tab
When 2 navigators are added to the page: time filter (including time interval filter and time range filter), site filter + tab,

You can follow the following configuration to associate filters, tabs, and canvases:
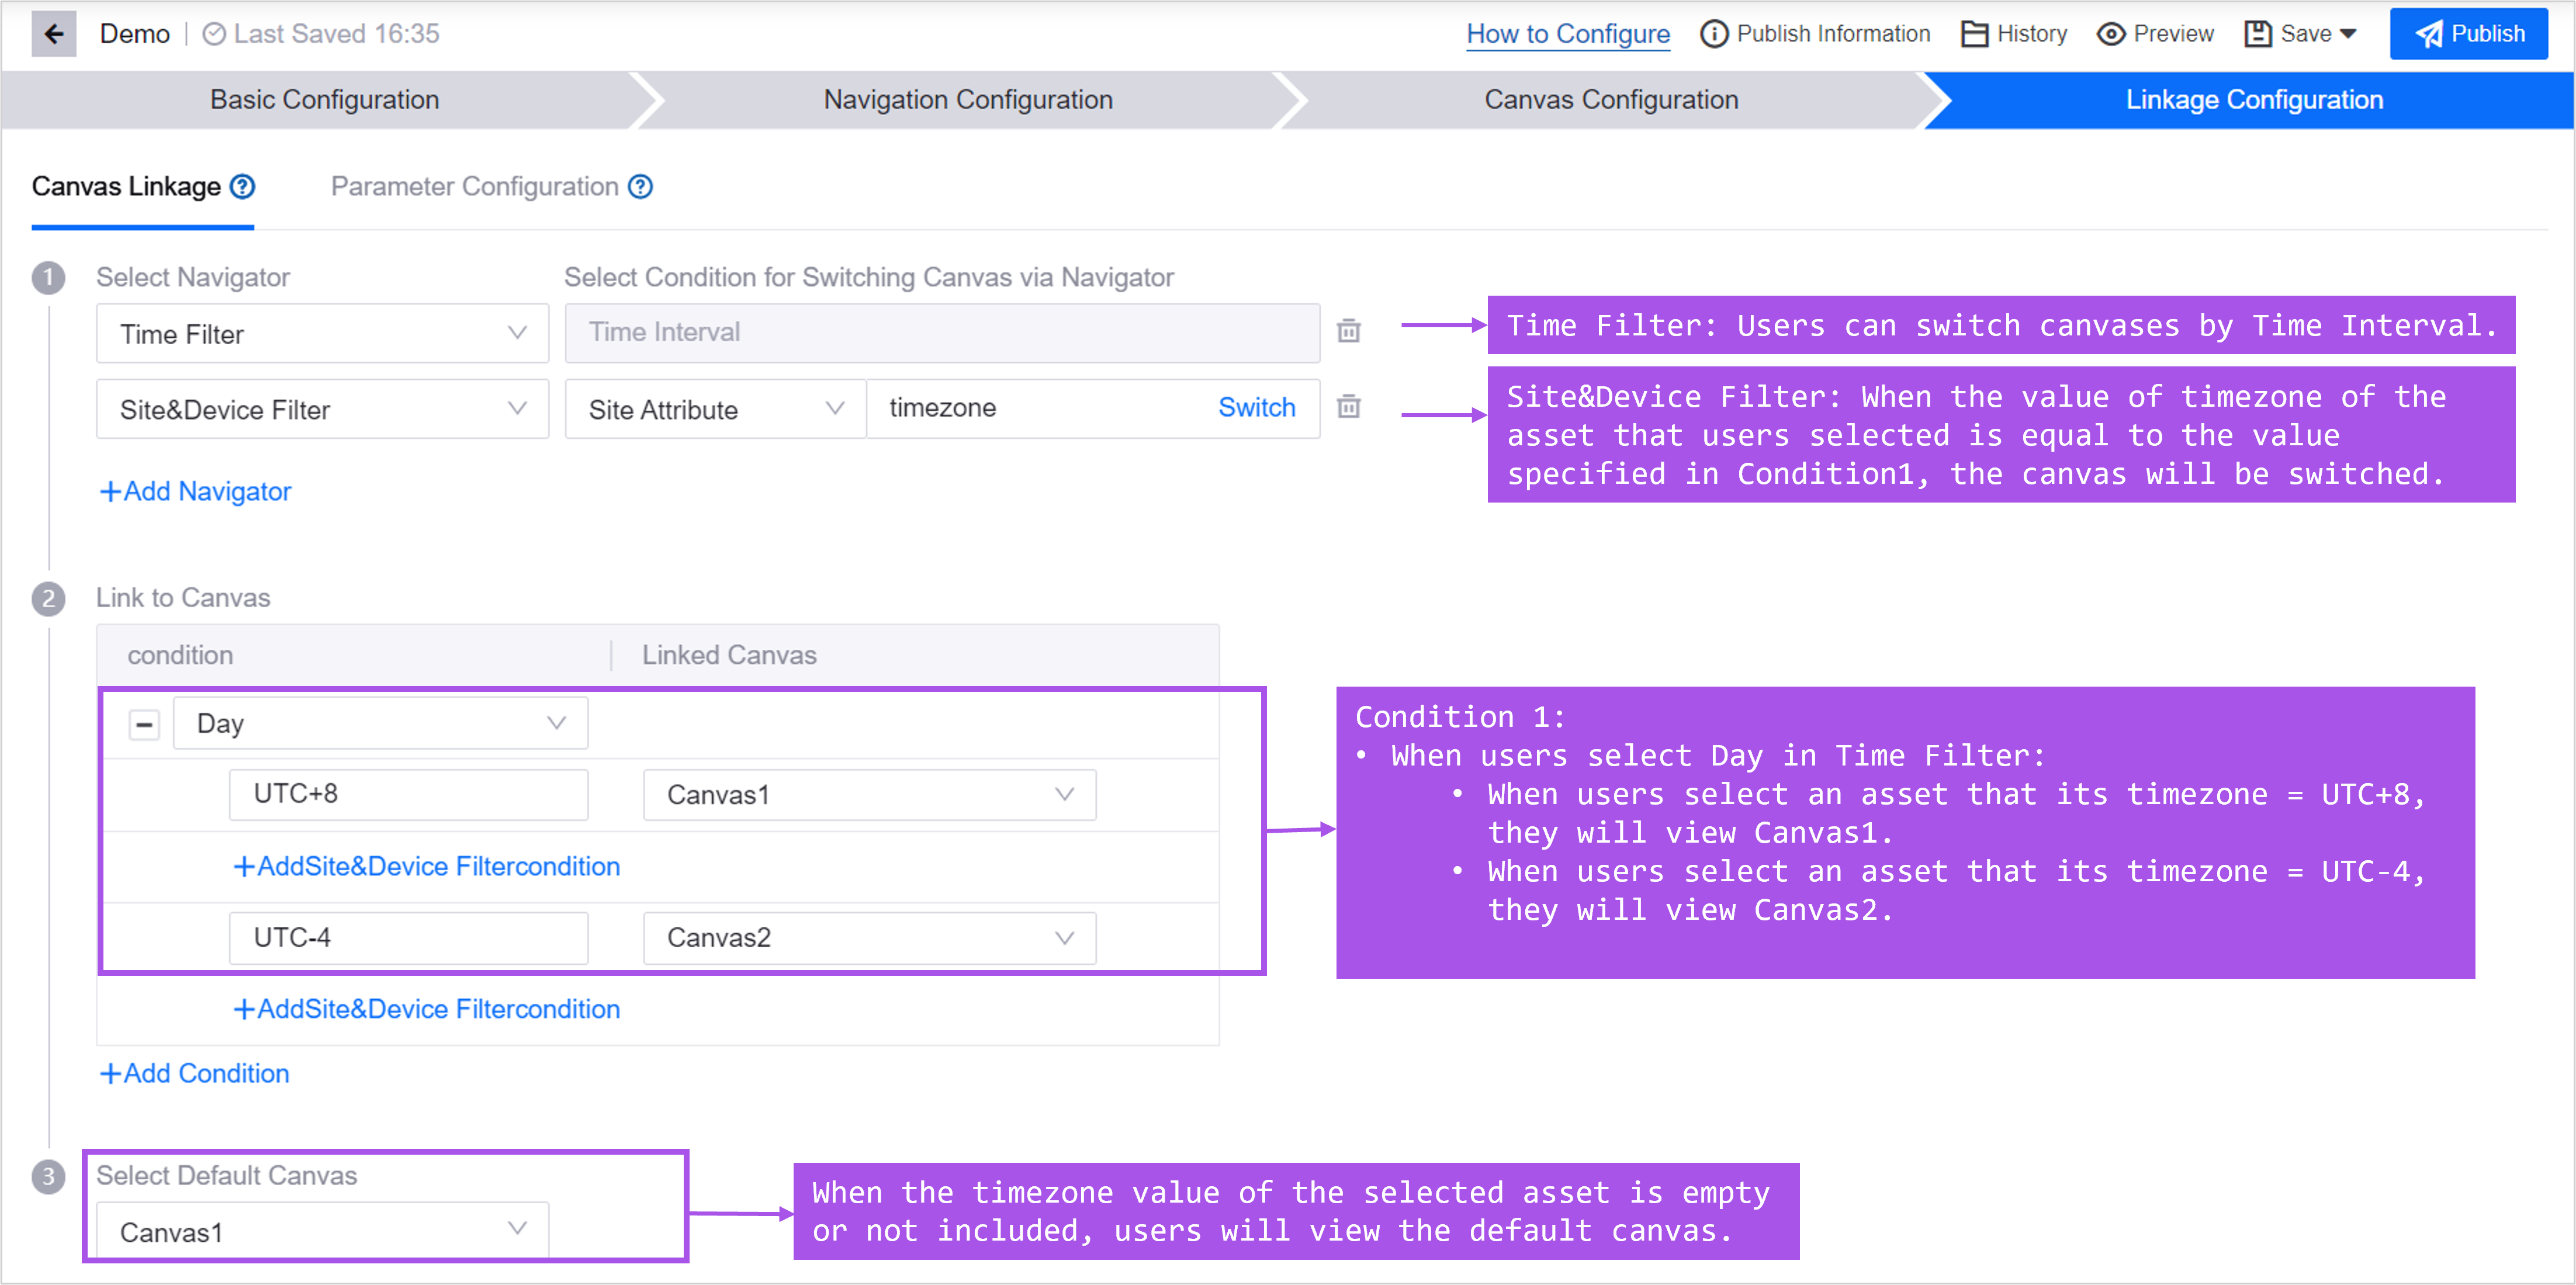
Example 2: Time filter + Station and equipment filter
When 2 navigators are added to the page: time filter, station and equipment filter,

You can follow the following configuration to associate filters, tabs, and canvases:
Parameter Configuration
Parameter configuration refers to the association between configuration navigator parameters and widget data items. Select the parameters that the widget needs to use from the parameters provided by the navigator, as well as the linkage conditions between the navigator parameter values and the widget data. When the user switches filter conditions in the navigator, the widget will use this parameter to request data from the data source and display only asset data that meets the conditions. For specific operations, see Configuring Single-Page Application.
For example, configure the following configuration for data linkage between the navigator and widgets:
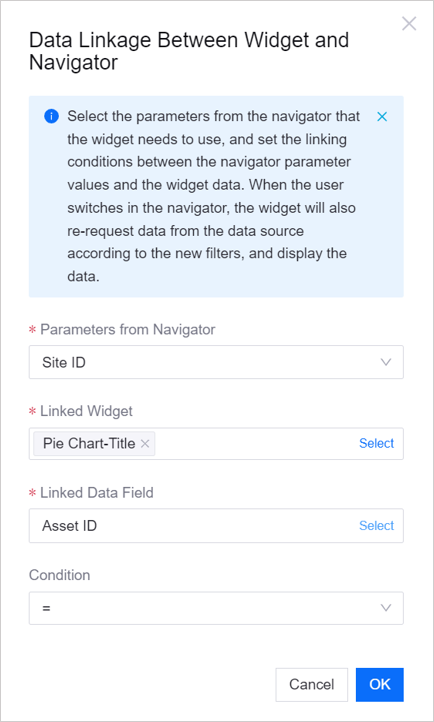
When the user selects the site whose site ID is mdmId1 in the filter, only the asset data with asset ID = mdmId1 will be displayed in the Multi-metric Card widget.