Visualizing Common Data Service Data
Overview
EnOS Digital Twin Visualization (DTV) is a model-based low-code application development tool that provides rich widgets and flexible configuration capabilities, empowering citizen developers to quickly build visualization applications and improve development efficiency.The unified API service of EnOS Common Data Service (CDS) provides standardized and one-stop data access for data consumers, accessing data including asset, measuring points, properties, metrics, records, etc., and also having the ability to customize data based on lightweight computations. DTV supports configuring visual dashboards using data from CDS.
Taking building visualization application pages as an example, this page explains how to visualize asset point data stored in CDS through DTV. The products involved are shown in the table below:
Product Name |
Mandatory/Optional |
Dependent Function Descriptions |
|---|---|---|
EnOS Device Connectivity & Management (DCM) |
Mandatory |
To connect the required assets |
EnOS Common Data Service |
Mandatory |
To configure business metric data |
EnOS Application Portal |
Optional |
To host DTV |
Scenario
This page guides you to quickly build a demo page that visually displays carbon emissions-related data, including total carbon emissions, carbon emission density, carbon emission trends in different ranges, and other carbon emission-related metrics.
Sample Visualization Page Based on the CDS Data:
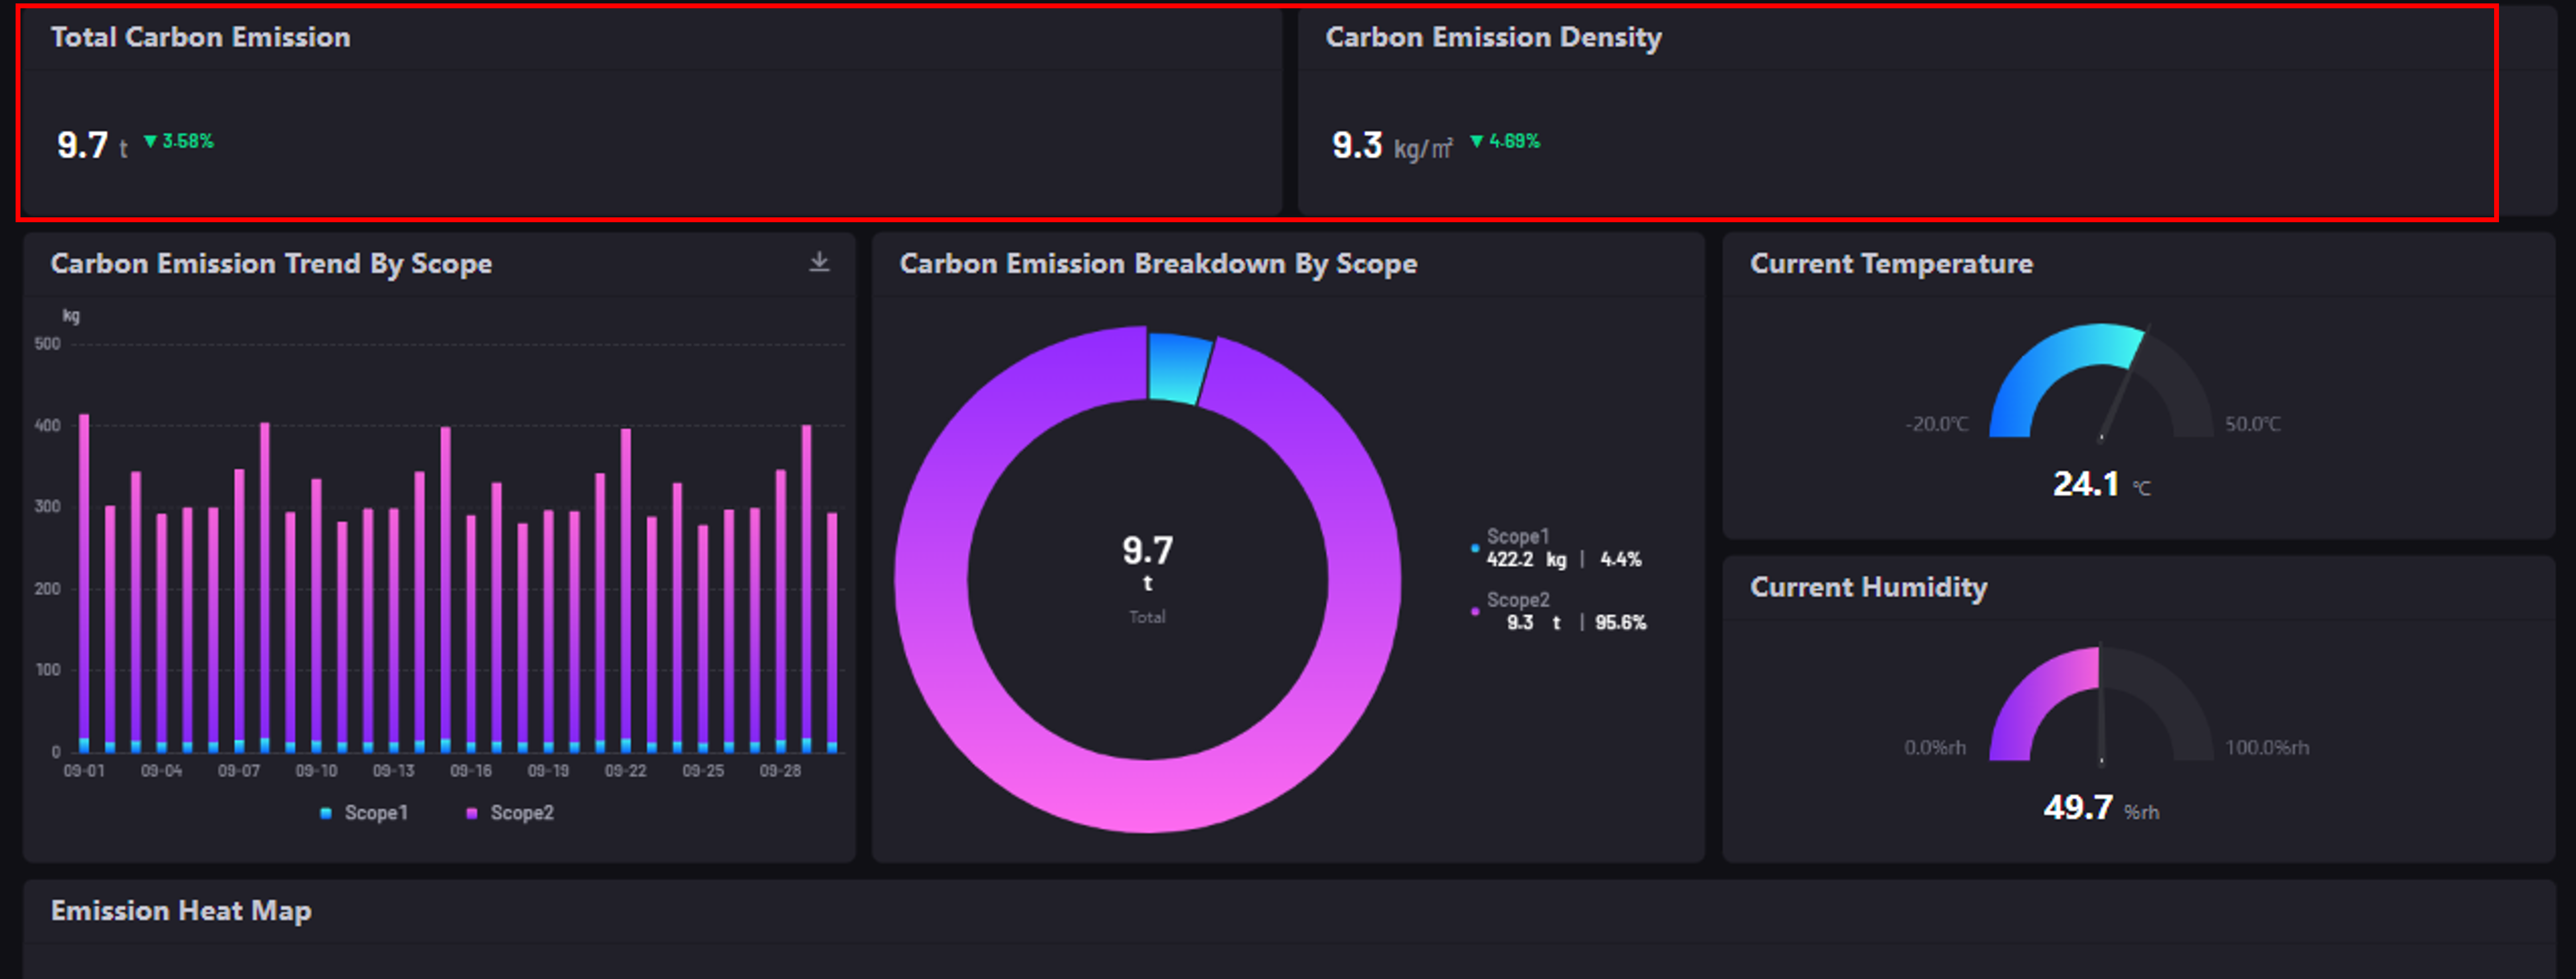
Widget List:
Widget |
Style |
Data Source |
Description |
|---|---|---|---|
Total Carbon Emission |
Metric Card with Ratio |
Timeseries |
To display the total carbon emission and the growth percentage by month |
Carbon Emission Density |
Metric Card with Ratio |
Timeseries |
To display the total carbon emission and the growth percentage by month |
Data Source List:
Data Source |
Data source type |
Description |
|---|---|---|
Timeseries |
CDS |
Obtain time series data from CDS |
For more information about CDS data source, see Common Data Service Data Source.
Workflow
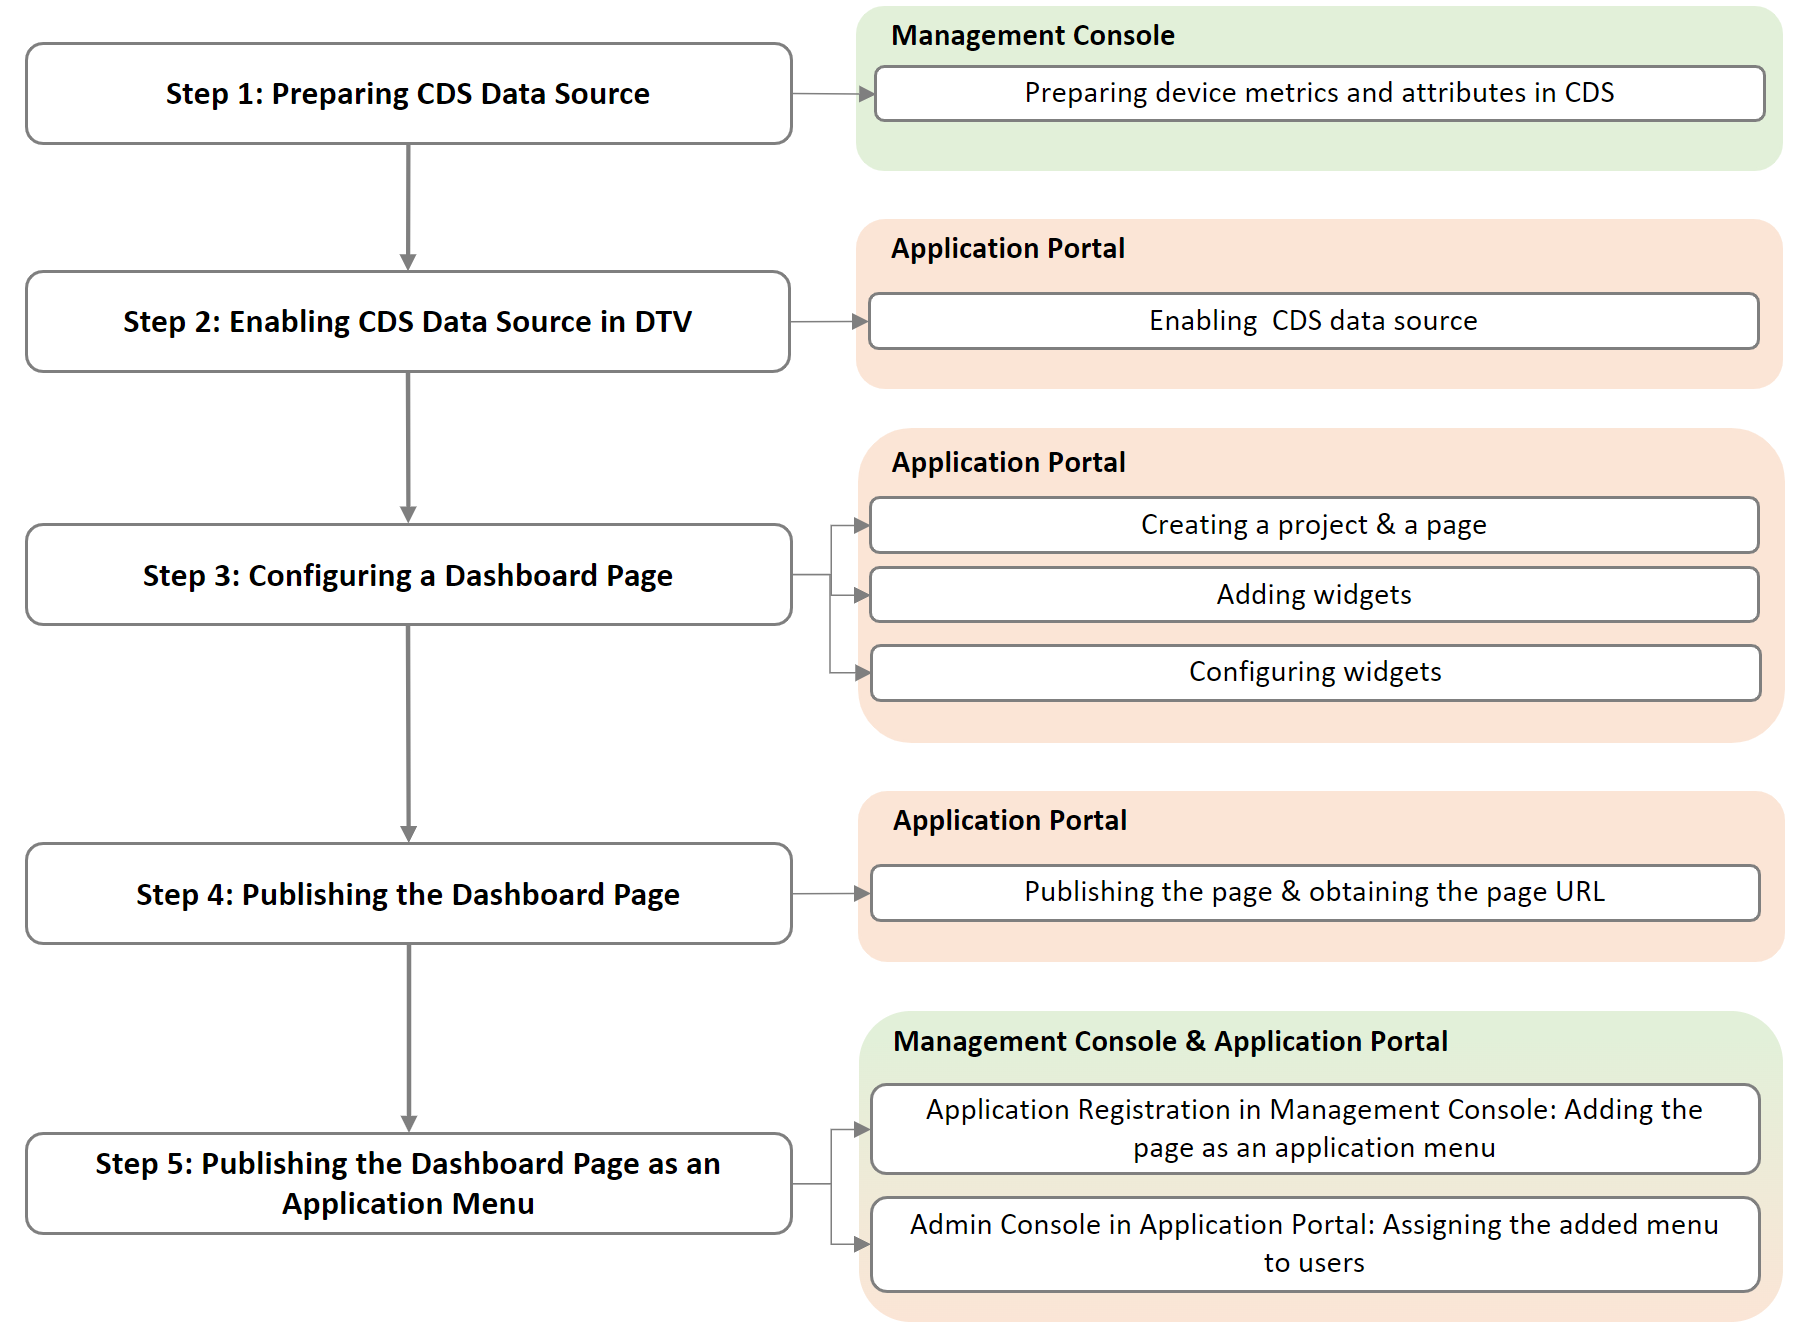
Prerequisites
Before you start, make sure of the following items:
The required assets are connected to DCM and you have access to the assets in Application Portal.
You have admin permissions in Application Portal > Developer Console (contact the system admin for permissions) and you have access to the following menus in Application Portal > Developer Console:
Menu |
Mandatory/Optional |
Description |
|---|---|---|
Device Management > Device Assets |
Mandatory |
Check if the required assets are connected to DCM. |
To obtain access to the above menus, contact the OU administrator.
You have access to the following EnOS Industry Application Common Building Blocks (CBB):
CBB |
Mandatory/Optional |
Description |
|---|---|---|
DTV |
Mandatory |
Create visualization pages using the CDS data. |
To obtain access to the above CBB, contact the OU administrator.
Design Mode
This section describes how to configure dashboard pages in DTV to visualize the CDS data.
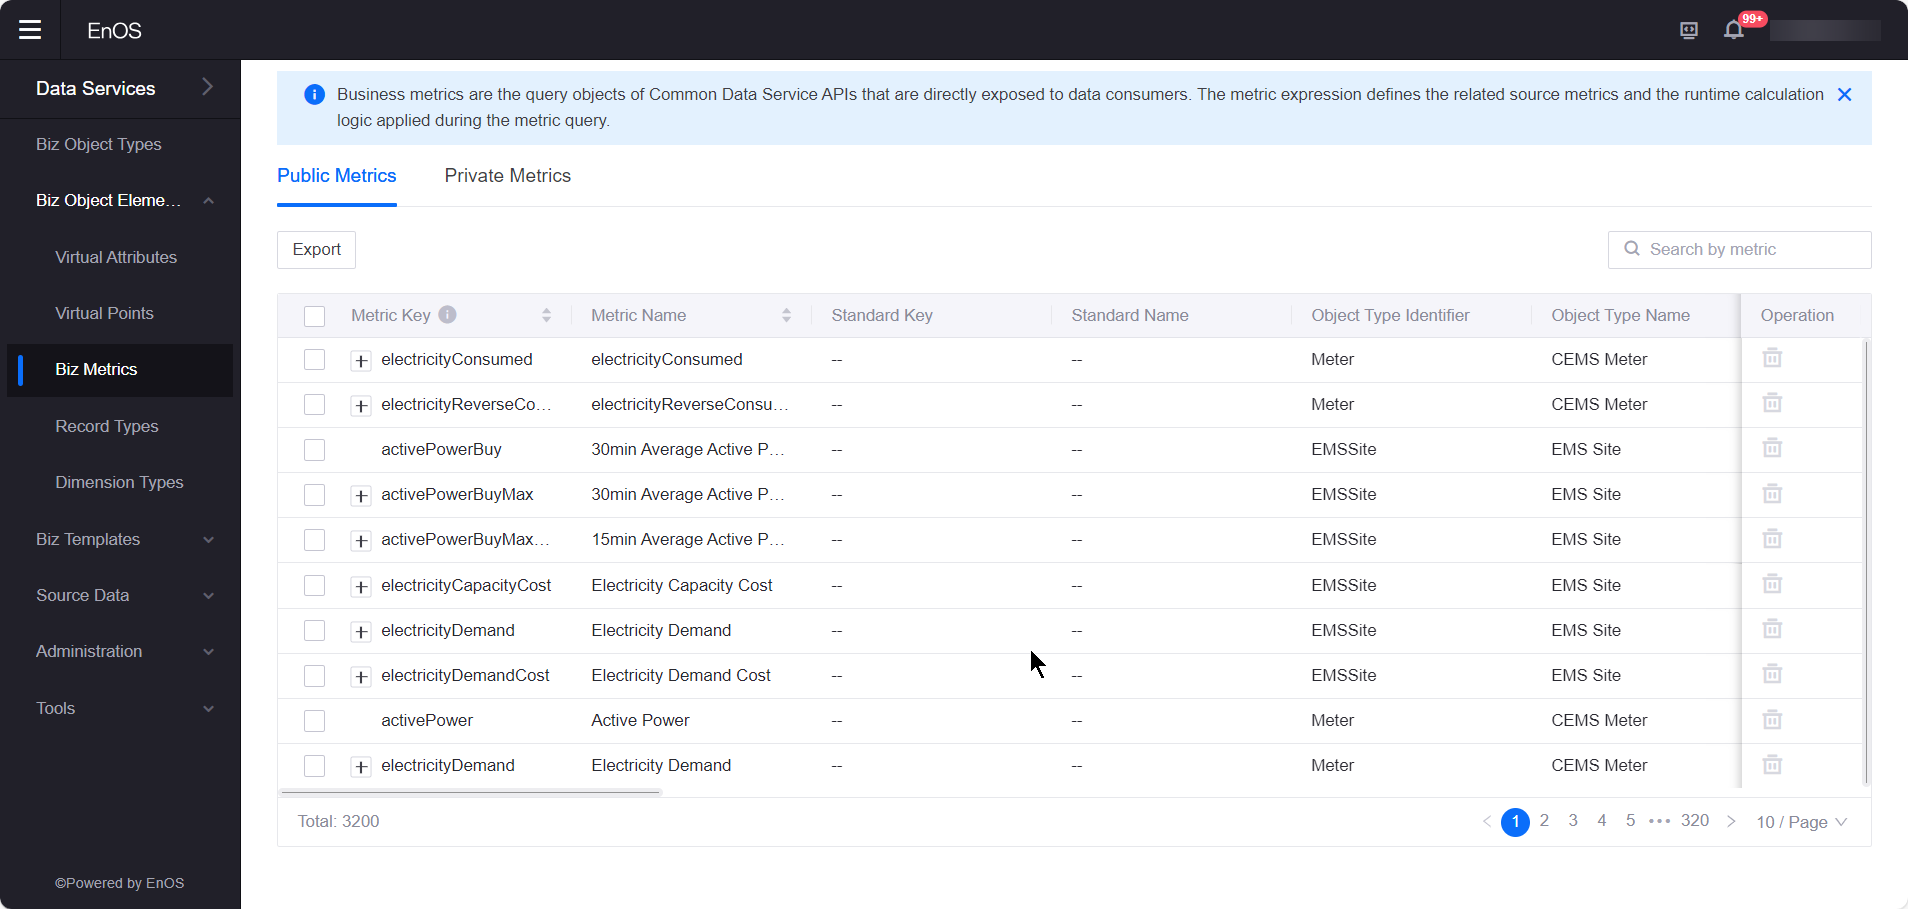
Step 1: Preparing the CDS Data Source
Go to Common Data Service in Application Portal, configure the required metrics and attributes:
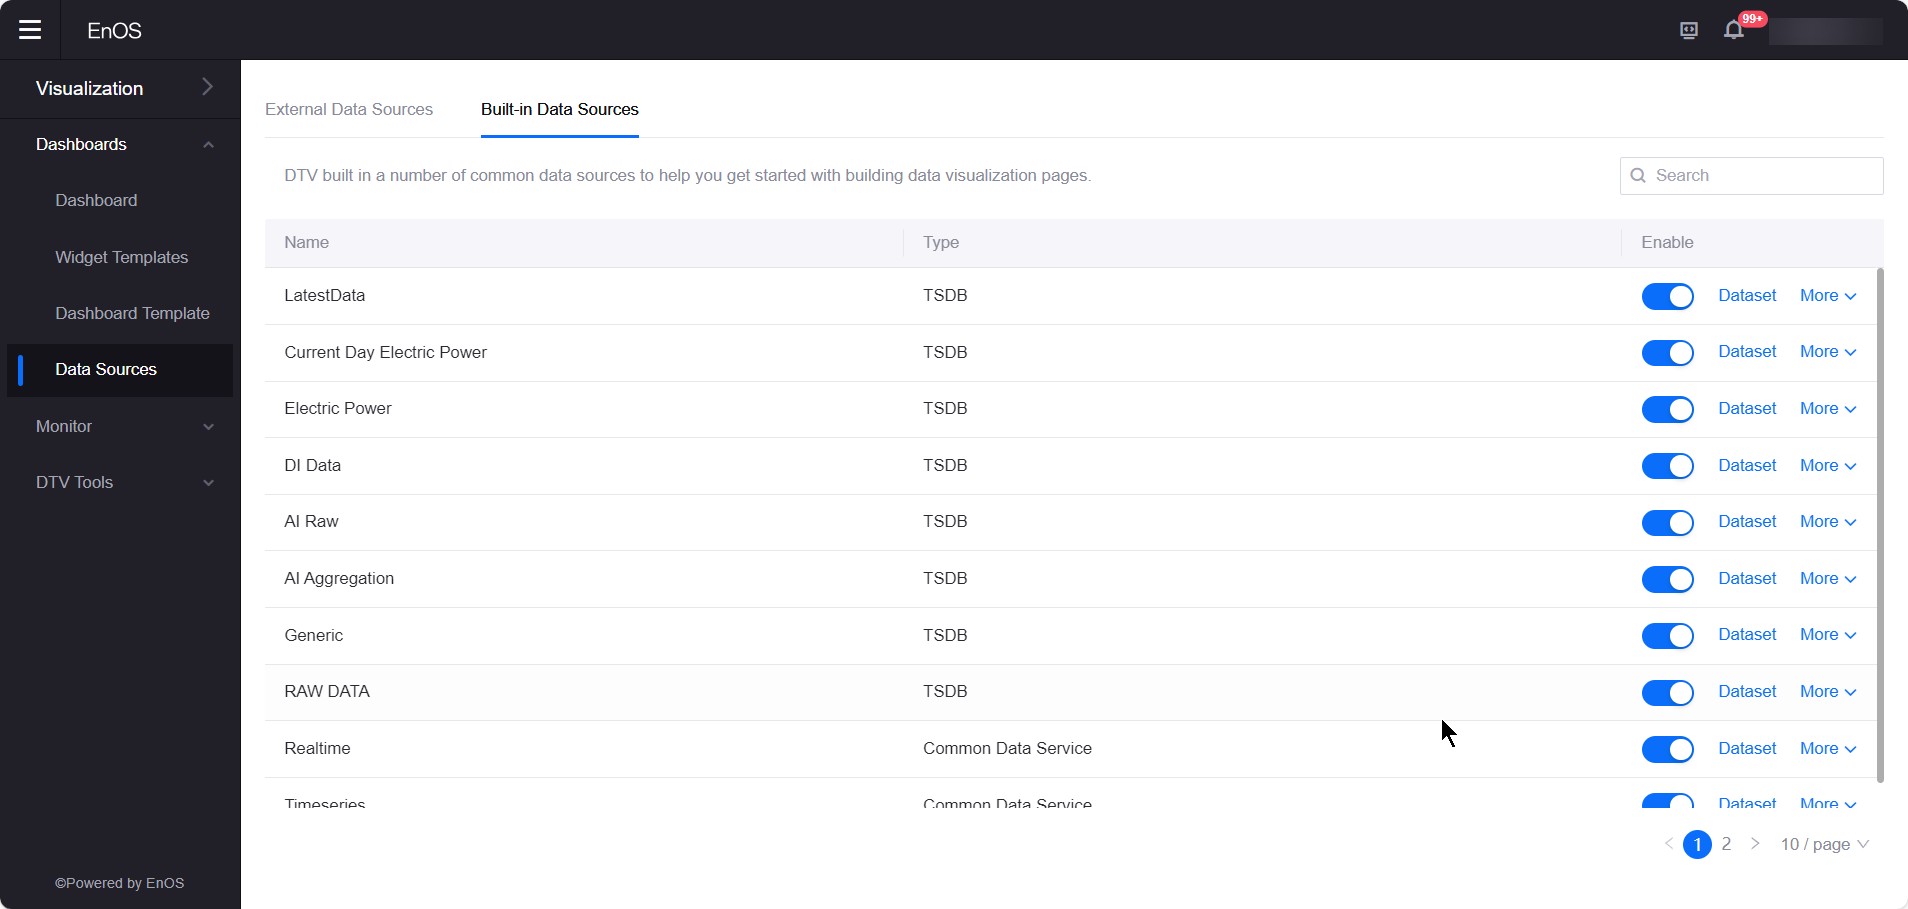
Step 2: Enabling the CDS Data Source
Go to Digital Twin Visualization > Data Sources > Built-in Data Source in Application Portal, and enable the CDS data source.
Step 3: Configuring a Dashboard Page
DTV organizes visualization widgets through dashboard pages. Create a dashboard to display visualization widgets and asset data with the following steps:
Select Digital Twin Visualization > Dashboards in Application Portal.
Select New Page and enter the page name, e.g., “Carbon emissions details.”
Select Page Settings and configure as follows:
Configuration Item |
Mandatory/Optional |
Example |
Description |
|---|---|---|---|
Theme |
Optional |
dark |
The theme color of the dashboard. DTV currently supports three theme colors: light, green, and dark. |
After creating the dashboard, add the Total Carbon Emission widget and Carbon Emission Density widget to the dashboard page with the following steps:
Select Add > Component/Container > Component and select the target widget type in the popup window to add the following widgets to the page.
Name |
Type |
Description |
|---|---|---|
Total Carbon Emission |
Metric Card |
Select Metric Card > Multi-metric card (Same Change Rate) in the pop-up window. |
Carbon Emission Density |
Metric Card |
Select Metric Card > Multi-metric card (Same Change Rate) in the pop-up window. |
2. Hover over the upper right corner of the widgets, select Edit from the drop-down list, and configure the following widget information:
Total Carbon Emission
Category |
Configuration Item |
Example |
Description |
|---|---|---|---|
Basic |
Title |
Enter ‘Total Carbon Emission’ |
Enter the title of the widget. |
Data |
Data Source |
Select ‘Timeseries’ |
After the data source is selected, the following data source parameters need to be configured: 1.Category: Select the corresponding model as category to display the data from the model in the widget. 2.Aggregation: Select ‘true’ to aggregate data when requesting data from the data source. 3.Start Time. 4.End Time. 5.Aggregation Type:select avg, which means to aggregate by average. 6.Aggregation Granularity:select day, which means to aggregate by days dimension. 7.Automatic Asset Acquisition:select true to specify automatic asset acquisition. |
Data |
Measurement |
Select ‘IAQ_zone_air_temp’ |
Select ‘Add Data Field’ and select ‘ Total Carbon Emission’ in the pop-up window to display the temperature data. |
Data |
Extension |
Select ‘Total Carbon Emission SPLM Growth Rate(DTV)’ |
Select ‘Total Carbon Emission SPLM Growth Rate ‘ in the pop-up window to display data. |
Style |
Measurement Style |
/ |
Measurement Style determines how the selected measurement data is displayed in the widget. Configure the following style information: 1.Metric style: including icon, icon colour, font and other settings. 2. Metric card style: including layout, left/right spacing, line height and other settings. |
Carbon Emission Density
Category |
Configuration Item |
Example |
Description |
|---|---|---|---|
Basic |
Title |
Enter ‘Carbon Emission Density’ |
Enter the title of the widget. |
Data |
Data Source |
Select ‘Timeseries’ |
After the data source is selected, the following data source parameters need to be configured: 1.Data Source: Select Timeseries. 2.Category: Select the corresponding model as category to display the data from the model in the widget.3.Aggregation: Select ‘true’ to aggregate data when requesting data from the data source. 4.Start Time. 5.End Time. 6.Aggregation Type:select sum, which means to aggregate by summing up. 7.Aggregation Granularity:select day, which means to aggregate by days dimension. 8.Automatic Asset Acquisition:select true to specify automatic asset acquisition. |
Data |
Measurement |
Select ‘Carbon Density SPLM Growth Rate(DTV)’ |
Select ‘Add Data Field’ and select ‘ Carbon Density SPLM Growth Rate(DTV)’ in the pop-up window to display the data. |
Data |
Extension |
Select ‘Total Carbon Emission SPLM Growth Rate(DTV)’ |
Select ‘Total Carbon Emission SPLM Growth Rate ‘ in the pop-up window to display data. |
Style |
Measurement Style |
/ |
The chart style is the same as the Total Carbon Emission widget. |
For more information on Metric cards, see Metric Cards.
Step 4: Publishing the Dashboard Page
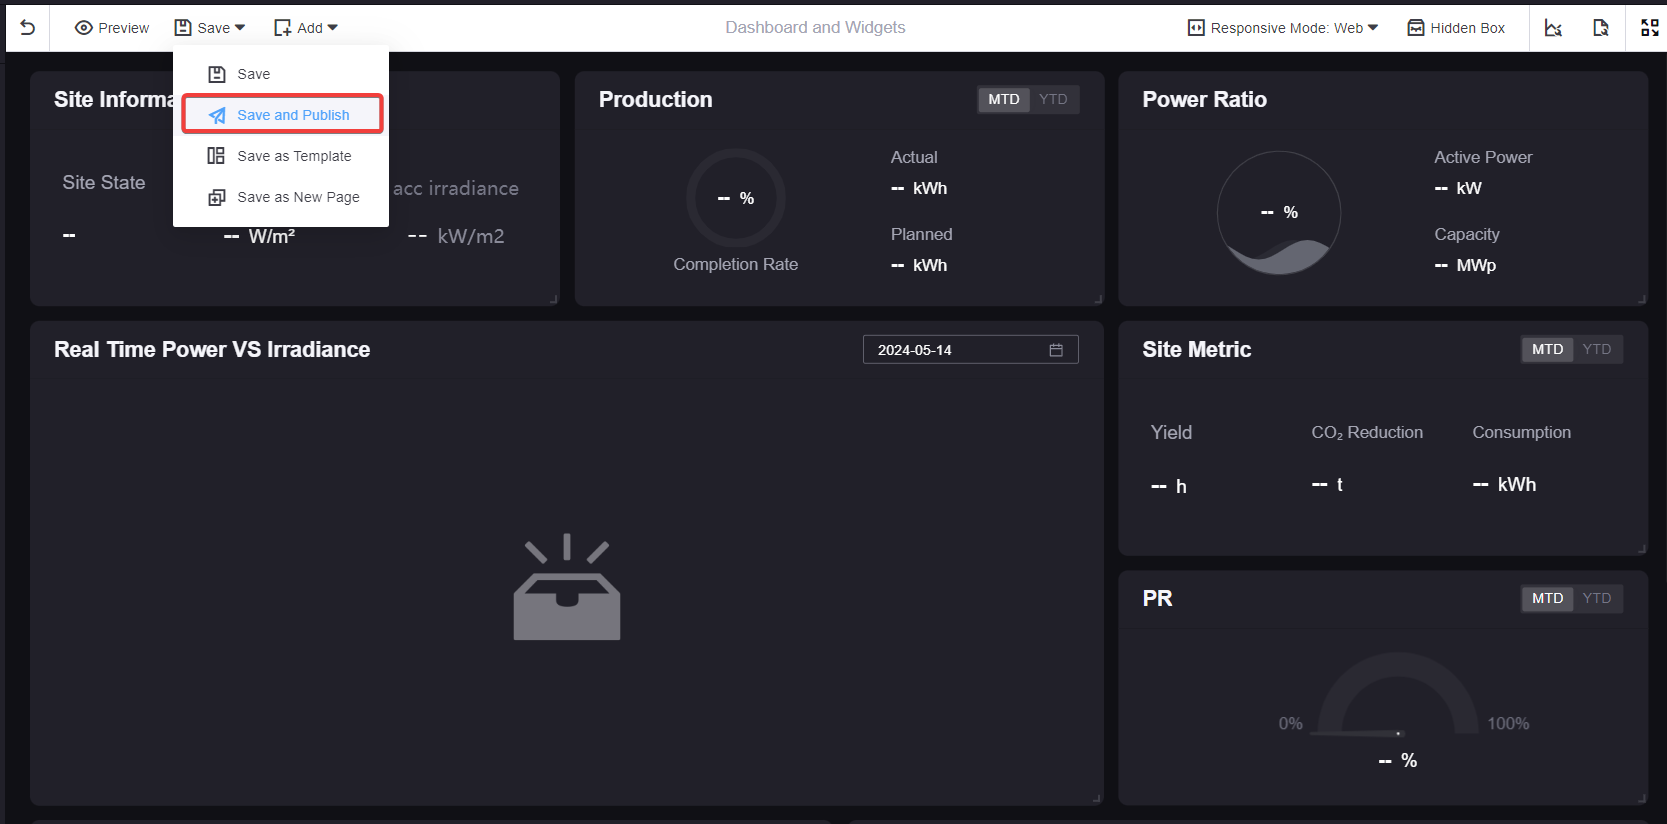
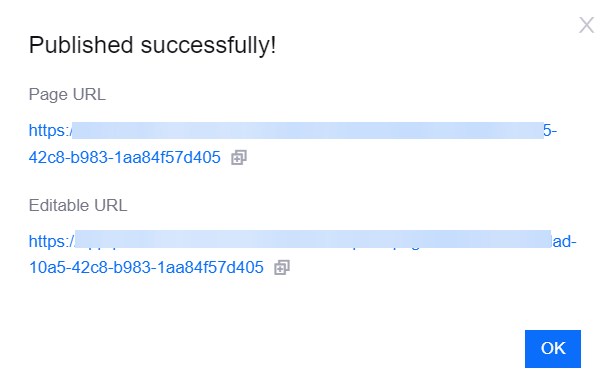
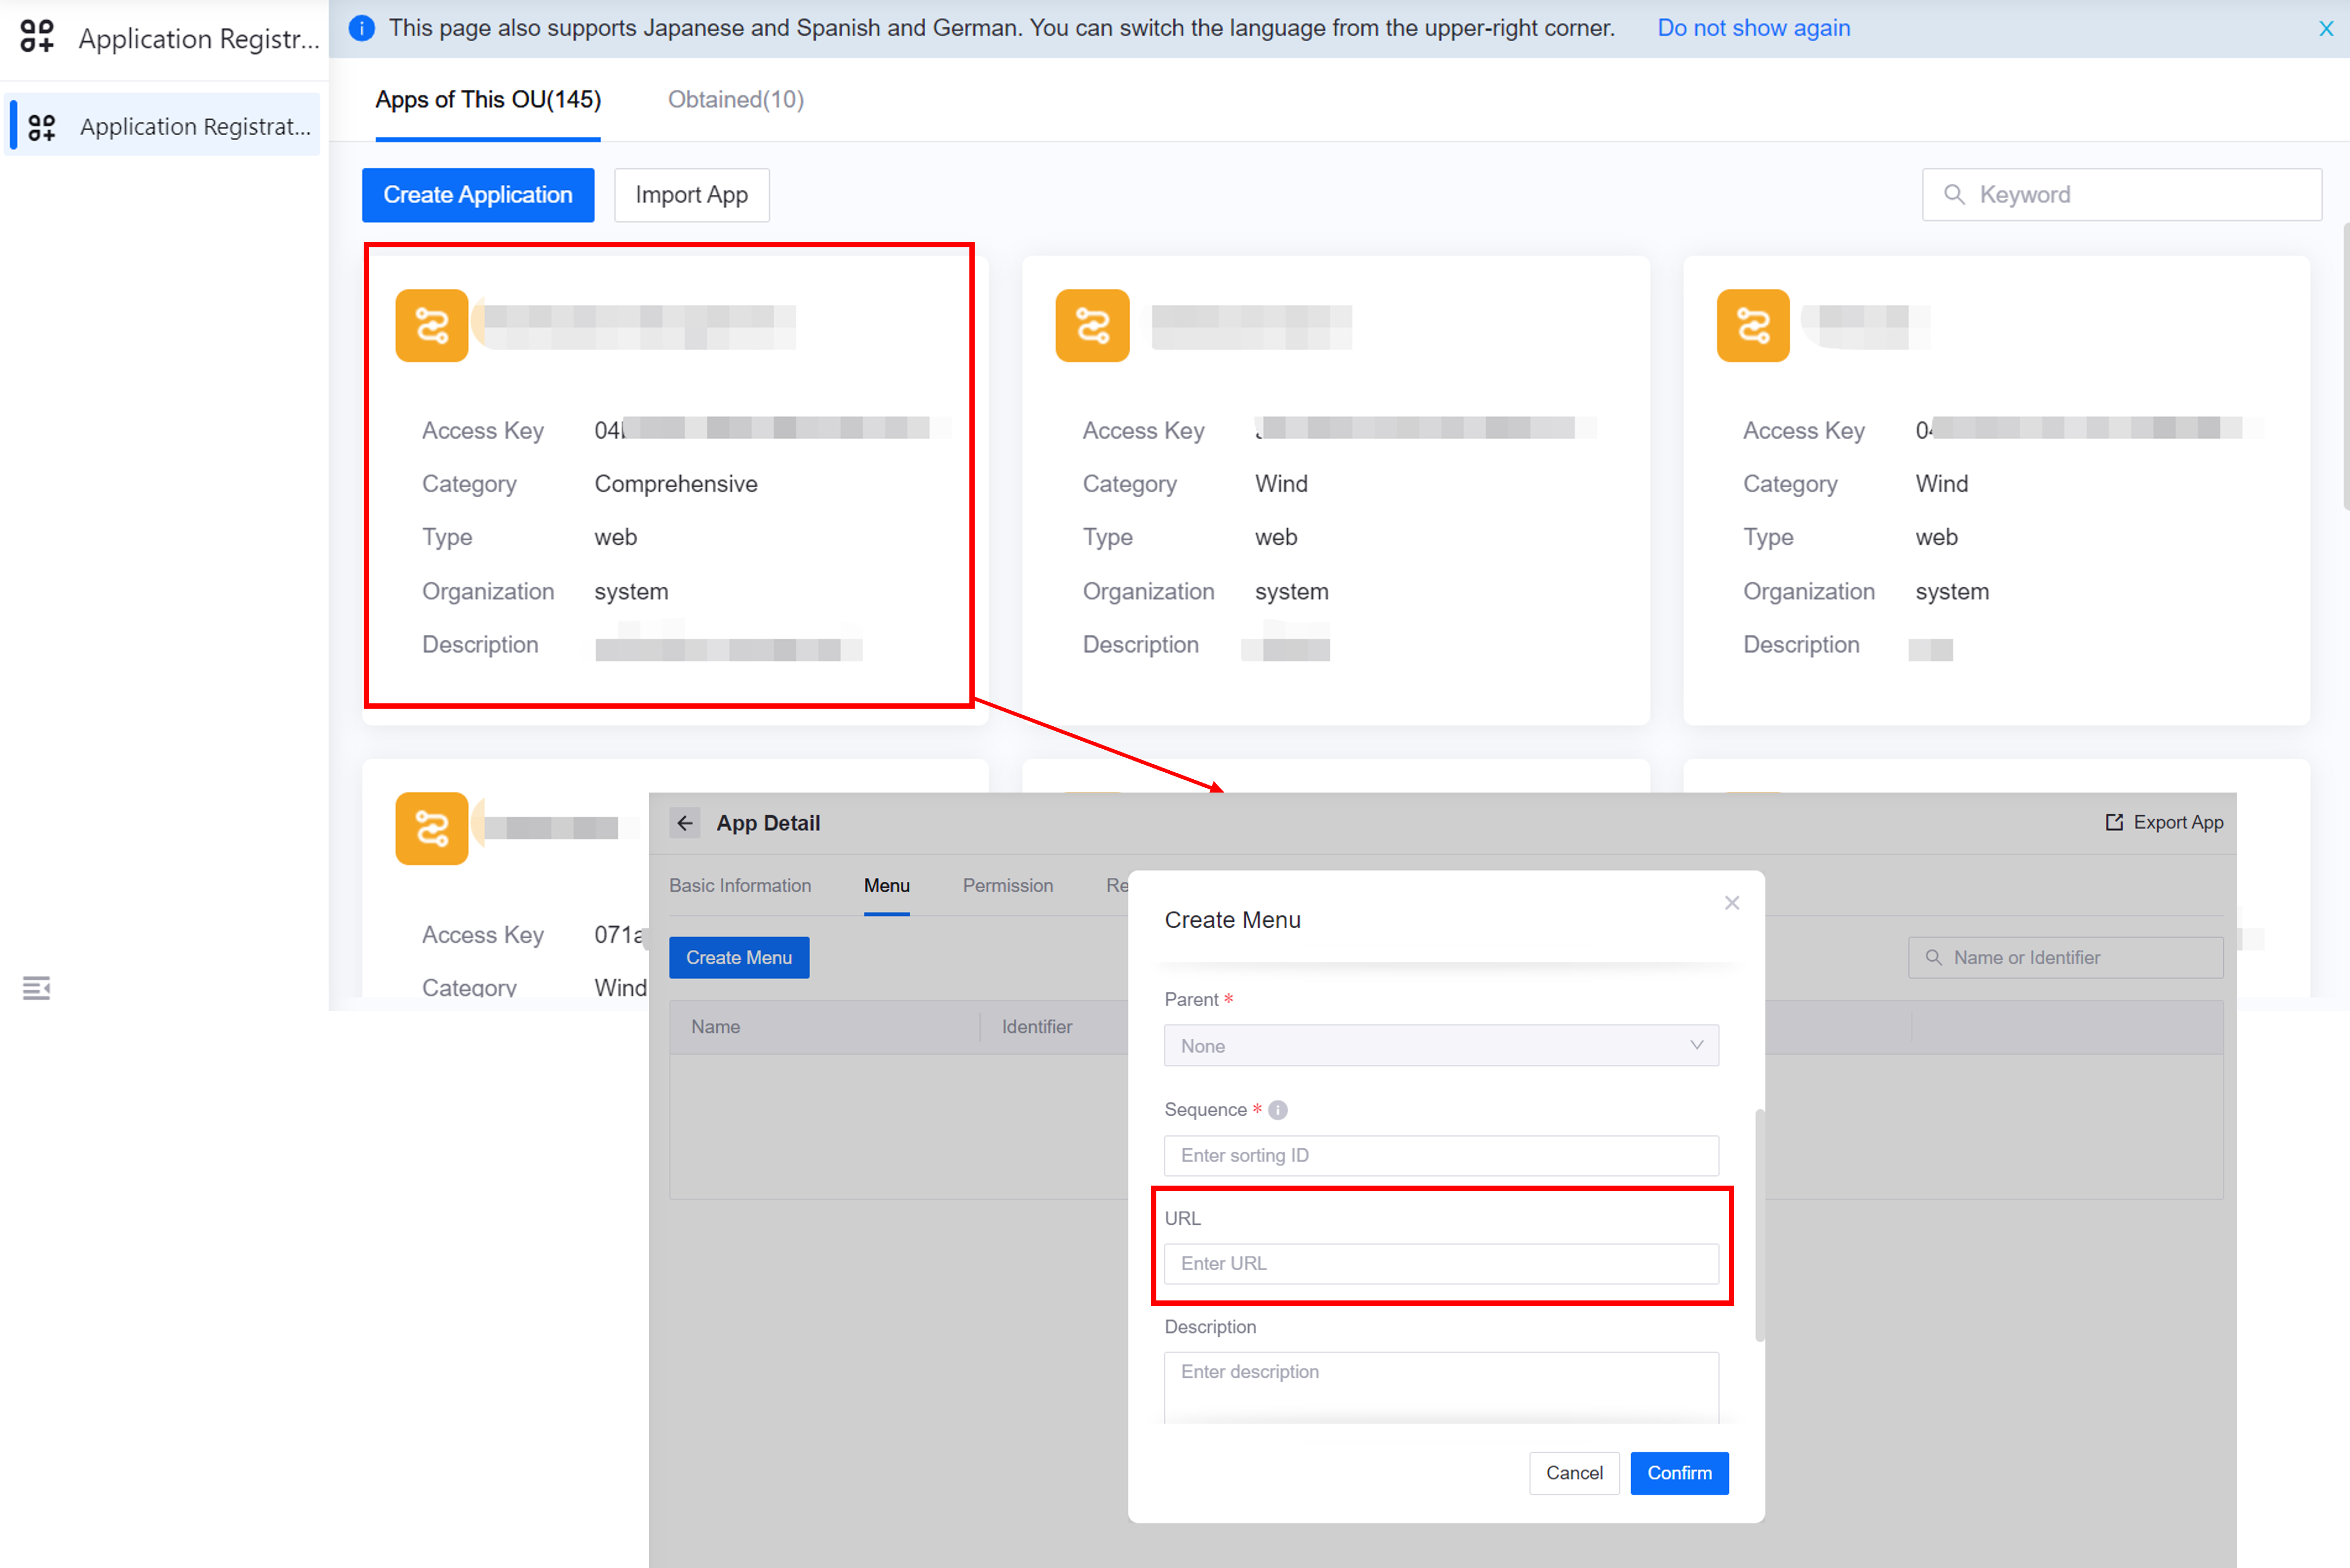
After configuring the dashboard page, you need to publish the page and obtain the page URL for future integration into an application menu.
Running Mode
Viewing the Visualization Page Built with CDS Data
After the above configuration is completed, you can go to the application to which the dashboard page is added in Application Portal to view the page.
FAQ
Q: Why can’t I select Timeseries Data Source when configuring the widget?
A: It may be because the Timeseries Data Source is not enabled in DTV. Select Digital Twin Visualization > Data Sources > Built-in Data Sources in Application Portal, and simply turn on the switch for the Timeseries data source.
Q: Why can’t I see the configured page menu in Application Portal?
A: This may be because your account does not have access permissions to the relevant menu group. To obtain menu group access permissions, contact the OU administrator.
