Unit 5: Configuring Data
After the asset is connected, the data uploaded to EnOS Cloud needs to be stored and configured so as to be available to applications and recognizable to users.
Before You Start
Before start, ensure the following items:
Application creators and system administrators need to be assigned the required permissions.
The current OU has requested for the time series database resource to configure data storage policies. If not, see Managing Resources.
Application creators have decided a list of required metrics based on the functional requirements of the application.
(Optional) Task 1: Simulating Data
Performed By |
Performed In |
|---|---|
Application Creator |
EnOS Management Console |
If no physical devices are connected to the application, such as the application for testing or demonstration, you need to use EnOS device simulators to verify the configuration of measurement points and metrics. For more information, see Device Simulator.
Procedure
Log in to EnOS Management Console and select Device Management > Simulators in the left navigation bar.
Click New Simulator, check all connected devices on the Add Simulator page, and click OK.
In the simulator list, click Edit Sample
 corresponding to the device and download the template in the pop-up window. Fill in the simulation data and upload the template.
In the simulator list, click Start
 corresponding to the device, check the Always Enable option in the pop-up window, and click OK.
Results
Once started, the simulators send the set measurement point values to EnOS Cloud at the defined time.
Task 2: Configuring Data Storage Policies
Performed By |
Performed In |
|---|---|
Application Creator |
EnOS Management Console |
After connecting to EnOS Cloud, devices continuously generate massive data that need to be written to storage before they can be queried and used by the application. Time Series Database (TSDB) provides data storage and management services. You can define how to store data by configuring TSDB storage policies. For more information, see Configuring TSDB Storage.
Procedure
Select Time Series Data Management > Storage Policies in the left navigation bar of EnOS Management Console.
Select the Formatted Recode tab, click the plus icon
 in the upper right corner of the page, and select Create Group.
On the Create Group page, name the group, check the models used by the application, and click OK.
Click the tab corresponding to the group created in the previous step, hover over the “AI Raw Data” data bucket card and click Edit
 in the upper right corner of the card.
On the Edit Storage Policy page, configure the following fields and click OK.
Storage Time: Set based on business needs.
Select Points: Model.
Group Model: Check the model used by the application.
Follow steps 4-5 to configure the “AI Normalized Data”, “DI Data”, “PI Data”, and “General Data” data bucket cards, set data storage time, and add the required models to storage policies.
Results
After the configuration is completed, the measurement point data of the corresponding models are stored according to the configured policies. You can log in to EnOS Management Console > Time Series Data Management > Storage Policies to view policy details.
Task 3: Tagging Asset Trees
Performed By |
Performed In |
|---|---|
Application Creator |
EnOS Management Console |
EnOS identifies asset trees and obtains the asset information and data of asset trees by tags. Onboarding Tool automatically creates asset trees and synchronizes them to EnOS Management Console after assets onboarding. You need to add the following tags to the synchronized asset trees.
Tags |
Tagging Objects |
Tag Functions |
|---|---|---|
EnosCDS:true |
Asset tree |
Ensure Common Data Service obtains data from the corresponding asset tree and provides the data for applications. |
auth_unit:true |
Site-level node |
Ensure the data of the corresponding asset tree is synchronized between EnOS Management Console and EnOS Application Portal. |
Procedure
Select Asset Trees in the left navigation bar of EnOS Management Console.
Click the asset tree used by the application at the page top. By default, the asset tree has the same name as the topology rule used in the OU template.
Select the root node in the asset tree navigation on the left, click Edit
 next to Asset Tree Tag, and add the
 EnosCDS:truetag in the pop-up window.Select the site-level node in the asset tree navigation on the left, click Edit
next to Asset Tags, and add the auth_unit:truetag in the pop-up window.Once the tags are added, contact the system administrator to enable the “CDS calling AMC” service. You only need to enable the service once in the same environment.
Results
After the service is enabled, Common Data Service can obtain asset types and asset data from the asset tree and provide the data for the application.
Task 4: Registering Metrics
Performed By |
Performed In |
|---|---|
Application Creator |
EnOS Application Portal |
Metrics are numerical values that reflect business conditions, such as production, production loss, and failure rate. Metric data must be registered on EnOS before it can be used by the application.
Procedure
EnOS supports registering metrics by using Common Data Service or Metric Management.
Registering Metrics by Common Data Service
Log in to EnOS Application Portal and select Common Data Service from the application list.
Refer to the Common Data Service setup guide to register data source APIs, source metrics, and standard metrics.
Registering Metrics by Metric Management
Log in to EnOS Application Portal and select Metric Management from the application list.
Refer to the Metric Management tutorial to configure dimension tables and fact tables, and develop metrics.
Results
Once metrics are registered, the application can use the registered metrics and display the relevant data.
(Optional) Task 5: Configuring Visualization Groups
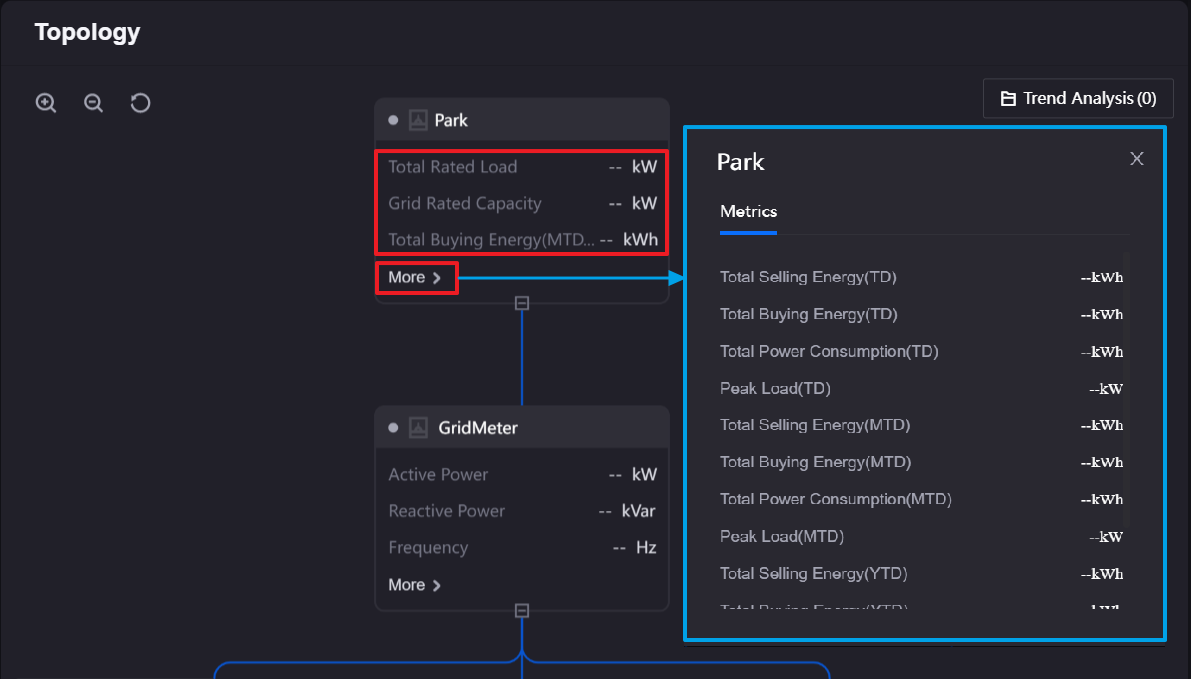
If the application needs to use Digital Twin Visualization to build the topology widgets or use the monitoring and data query pages of Unified Monitoring (for example, use the data groups in Asset List or Common KPI Inquiry, the data displayed in the floating cards of Asset Map, and the display content related to asset status), the system administrator needs to configure visualization groups to decide the display order and groups of metric data in the specific visualization widgets and pages. For example, in the following figure, the metric data displayed directly in the topology and in the topology pop-up window are decided by the “Common Fields” and “More Information” visualization groups respectively.
Application creators can configure visualization groups with the following steps:
Contact the system administrator to synchronize the metrics registered in the previous task as Asset Elements in the OU template to ensure that the application can acquire and use the grouped metrics.
Contact the system administrator to configure display fields for the corresponding asset types.
Task 6: Mapping Measurement Point Dimensions
Dimensions in Configuration Center can be used to define the business semantics of the enumeration values of measurement point data. For example, by using dimensions in Configuration Center, the raw data (0 and 1) returned by the “Switch State” measurement point in the Switch model can be interpreted as the “Disconnected” or “Connected” states respectively.
Application creators can define and map the dimensions of measurement points with the following steps:
Contact the system administrator to configure the dimensions of the measurement points used by the application to define their business semantics.
Contact the system administrator to associate the defined dimensions with the corresponding measurement points in the models.