Using Charting Tool
This page describes how application users monitor and analyze the trend of asset data on a Charting Tool page. An example of a Charting Tool page displays as below.
For more information about the elements on a Charting Tool page, see Exploring Charting Tool.
Note
The layouts and functions in your applications might be different from the contents introduced in this article, because of the customization on layouts and functions for Unified Monitoring pages. Contact your application creators for more information.
Prerequisites
Before you start, make sure that you are assigned with the required asset permissions, operational permissions, and a menu group containing the Charting Tool page. If not assigned, contact your application administrators.
Editing Charts
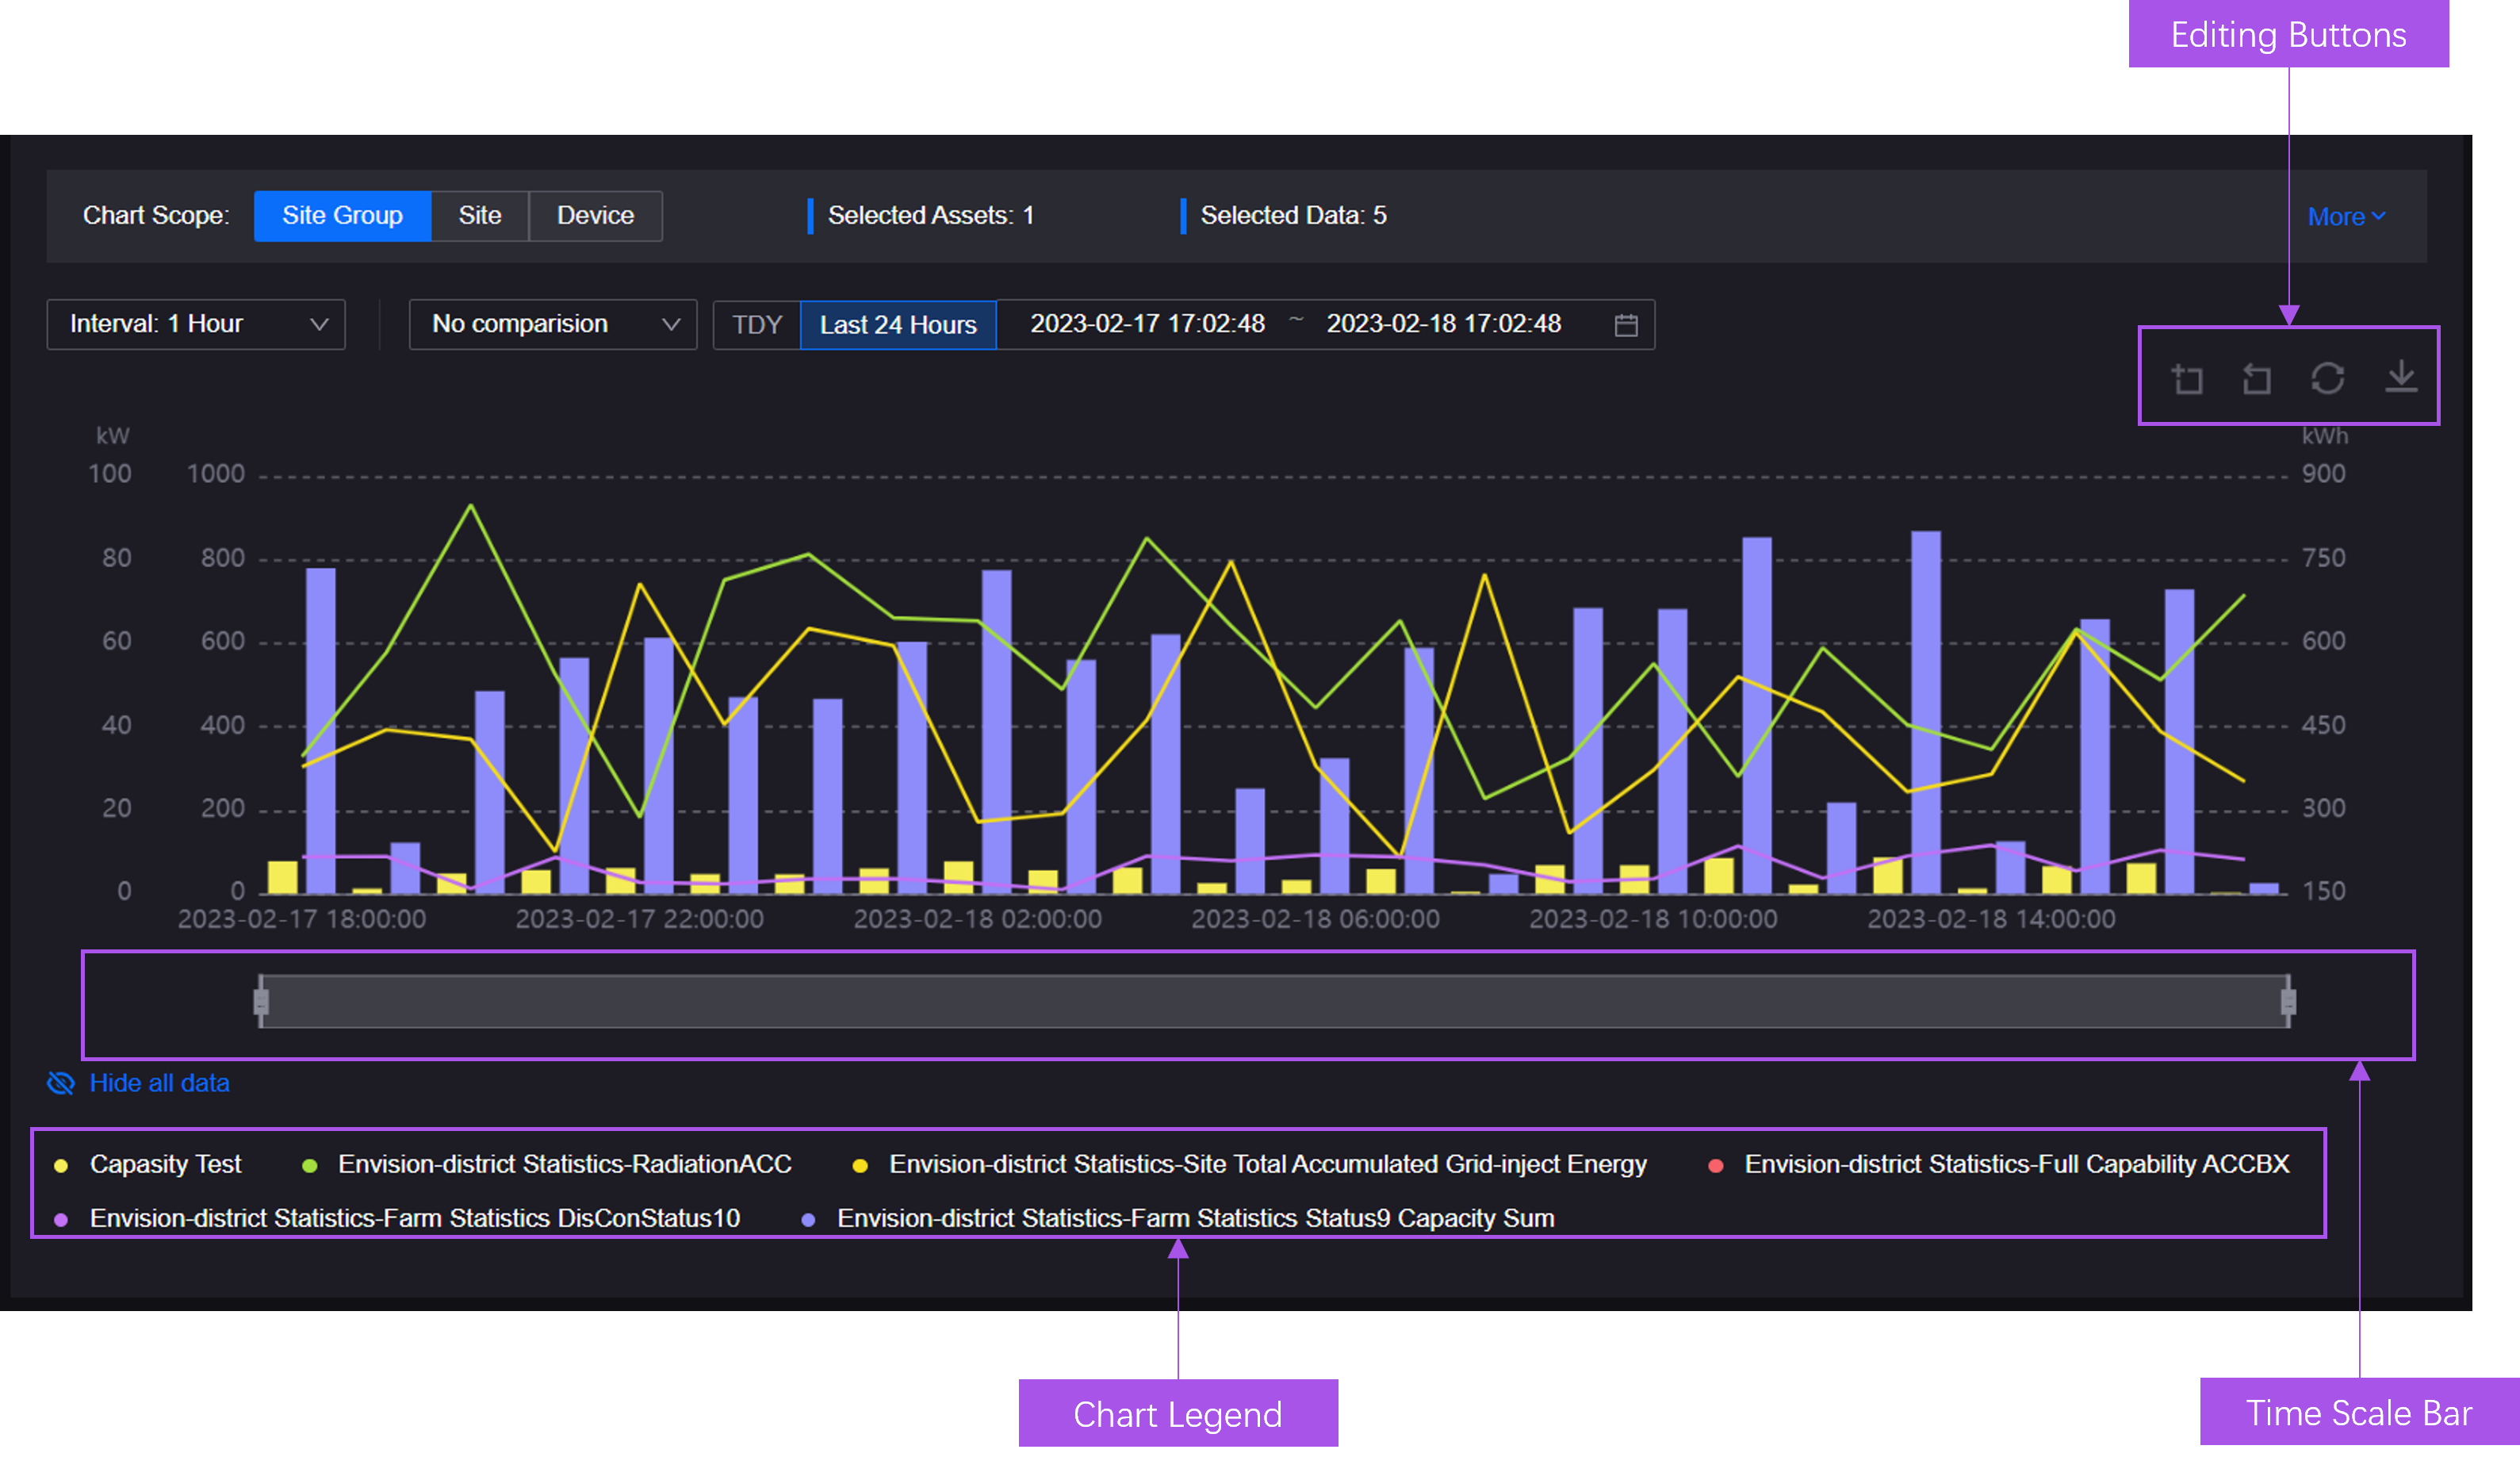
You can edit the current chart by the editing buttons, time scale bar, and the chart legend, as shown below.
Displaying Data Tables
If you need to monitor the exact value of each data field on the chart, display the data on the chart as a data table below the chart area by the following steps:
Select Charting Tool from the left navigation pane.
Note
The menu name in your applications might be different from the name in this article, because of the customization on menu names for Unified Monitoring pages. Contact the application administrator for more information.
Select Show Data Table
 , the data on the chart will display as a table below the chart as shown below.
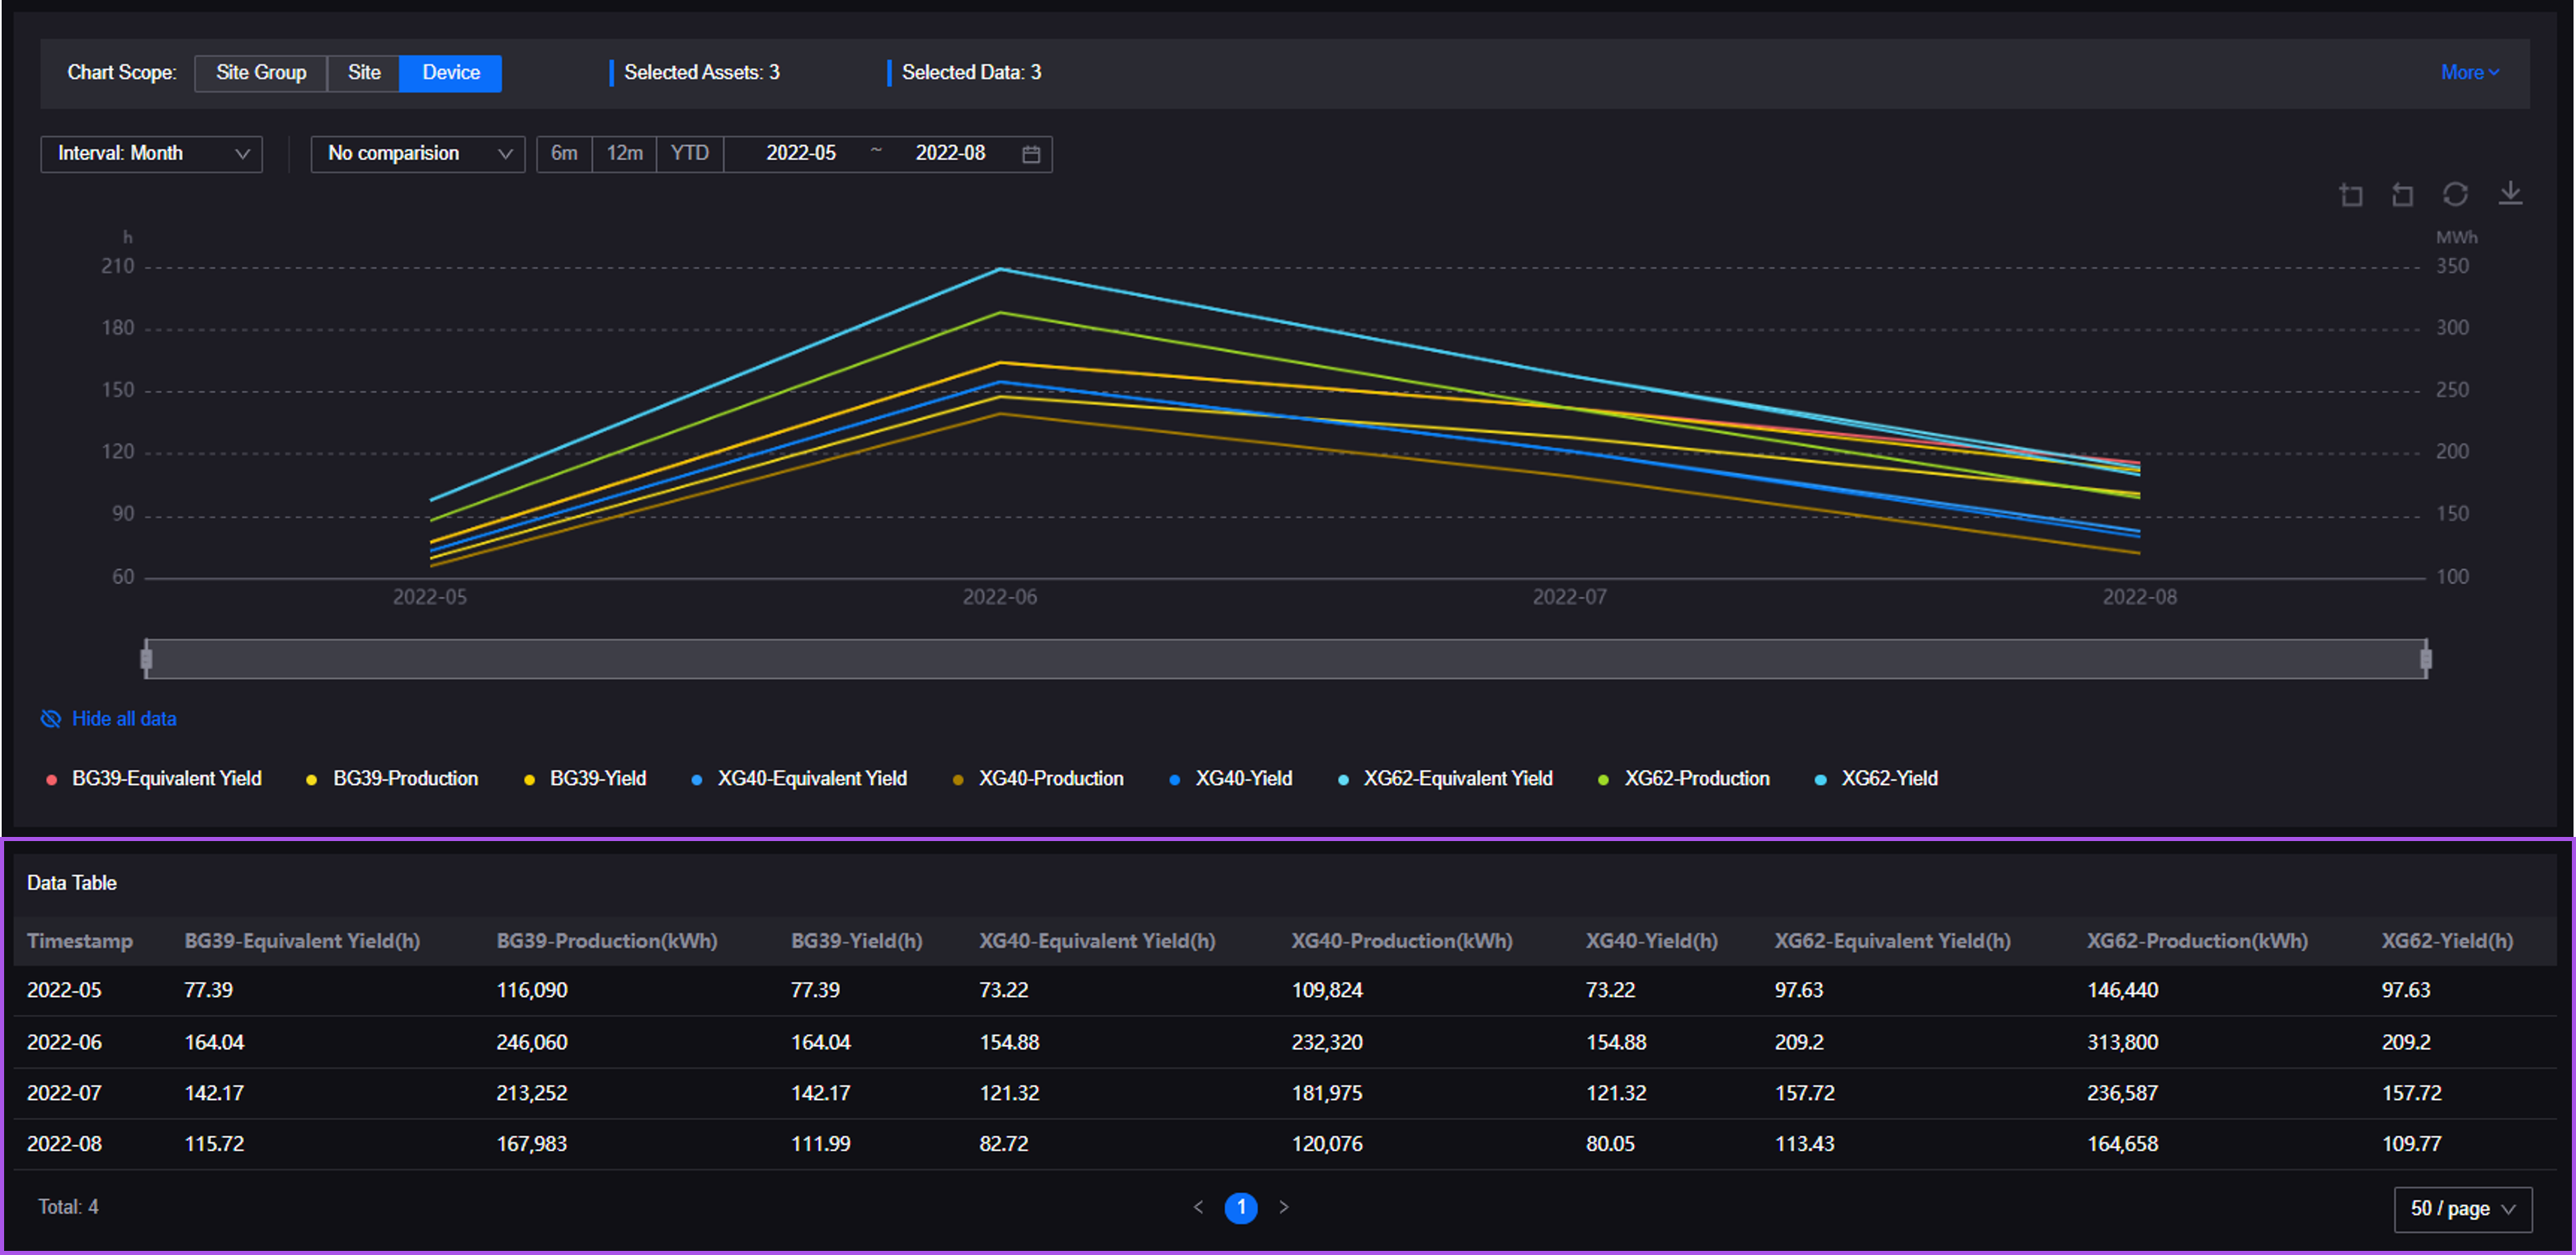
(Optional) If the time interval of data in the chart is the raw data interval, you can turn on the Data Quality switch in the upper right corner of the data table to view data quality information.
Select the Show Data Table button again to hide the data table.
Zooming in Charts
If you need to focus the specified parts on the chart, zoom in the chart by the following steps:
Select Charting Tool from the left navigation pane.
Select Zoom In
 .
.In the chart area, select the part you want to zoom in.
To cancel the zoom-in operation, select Undo  .
.
Enabling Screenshot Mode
If you need to capture the current chart for purposes such as reporting, presenting, and archiving, you can enable the screenshot mode by the following steps to hide page elements including the time scale bar, operational buttons, and chart legend:
Select Charting Tool from the left navigation pane.
Hover over the setting button
 and select Screenshot Mode from the dropdown list.
To disable the screenshot mode, hover over the setting button and select Exit Screenshot Mode.
Hiding Data Fields
Select Charting Tool from the left navigation pane.
To hide the data fields on the chart:
Select Hide All Data to hide all data items and the vertical coordinates.
Select one or more data fields on the chart legend to hide the data fields on the chart.
To display hidden data fields, select Show All Data or the hidden data fields on the chart legend as shown below.
Filtering Data
You can use filtering on the Charting Tool page to filter the data
The Charting Tool provides multiple filters to filter chart data, which are shown as below.

The following table shows the filters and respective functions in Charting Tool.
Field |
Description |
|---|---|
Site Filter |
Filter assets by site. |
Device Type Filter |
Filter by device type. |
Device Filter |
Select devices displayed in the chart. |
Time Interval Filter |
Specify the query interval for measurement points or metrics in the chart. This time interval represents the intersection of intervals of all measurement points or metrics and the raw interval. |
Comparison Filter |
Specify the comparison cycle to display the data of measurement points or metrics in the previous cycle. |
Time Range Filter |
Specify the start time and end time of chart data. |
Select the time range for data in the asset data chart by the following steps:
Select Charting Tool from the left navigation pane.
Select the corresponding filter to configure the filter conditions.
Select Query.
Analyzing Data
To analyze chart data and display the analyzing results in the current chart, configure the information such as analyzing formula, name and unit, and display style with custom analysis tool by the following steps:
Select Charting Tool from the left navigation pane.
Select Custom Analysis
 .
.Select New Target to add a new analysis target or select an existing target from the analysis target list to edit the target.
Enter the following information in the popup window.
Field
Description
Formula
Configure the analysis formula by selecting data fields and operators.
Name
Enter the name of the analysis data, which displays on the chart legend and data table.
Unit
Enter the unit of the analysis data.
Style
Select the chart style for the analysis data, supporting
Line Chart,Bar ChartandStacked Column Chart.Color
Select the color of the analysis data displayed on the chart.
Select Apply.
Applying Chart Templates
The templates of Charting Tool contains multiple configuration items such as:
Asset dimension and asset type
Object and data field
Chart style
Time interval and time range
Custom analysis items
Apply a Charting Tool template by the following steps:
Select Charting Tool from the left navigation pane.
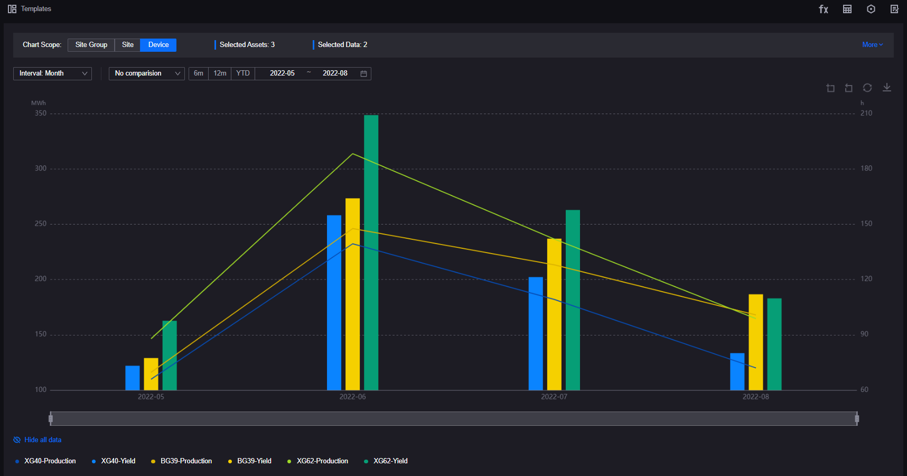
Select Templates to open the template panel from the top left corner.
Select template names in Recent Templates or the Template List below to apply the template.
Exporting Data on Charting Tool
To view or modify the current Charting Tool page offline or for other purposes such as archiving or presenting, export the data on the chart as a data table by the following steps:
Select Charting Tool from the left navigation pane.
Hover over the export button
 .
.From the dropdown list, select CSV or EXCEL to export
csvorxlsxfiles.