Topology
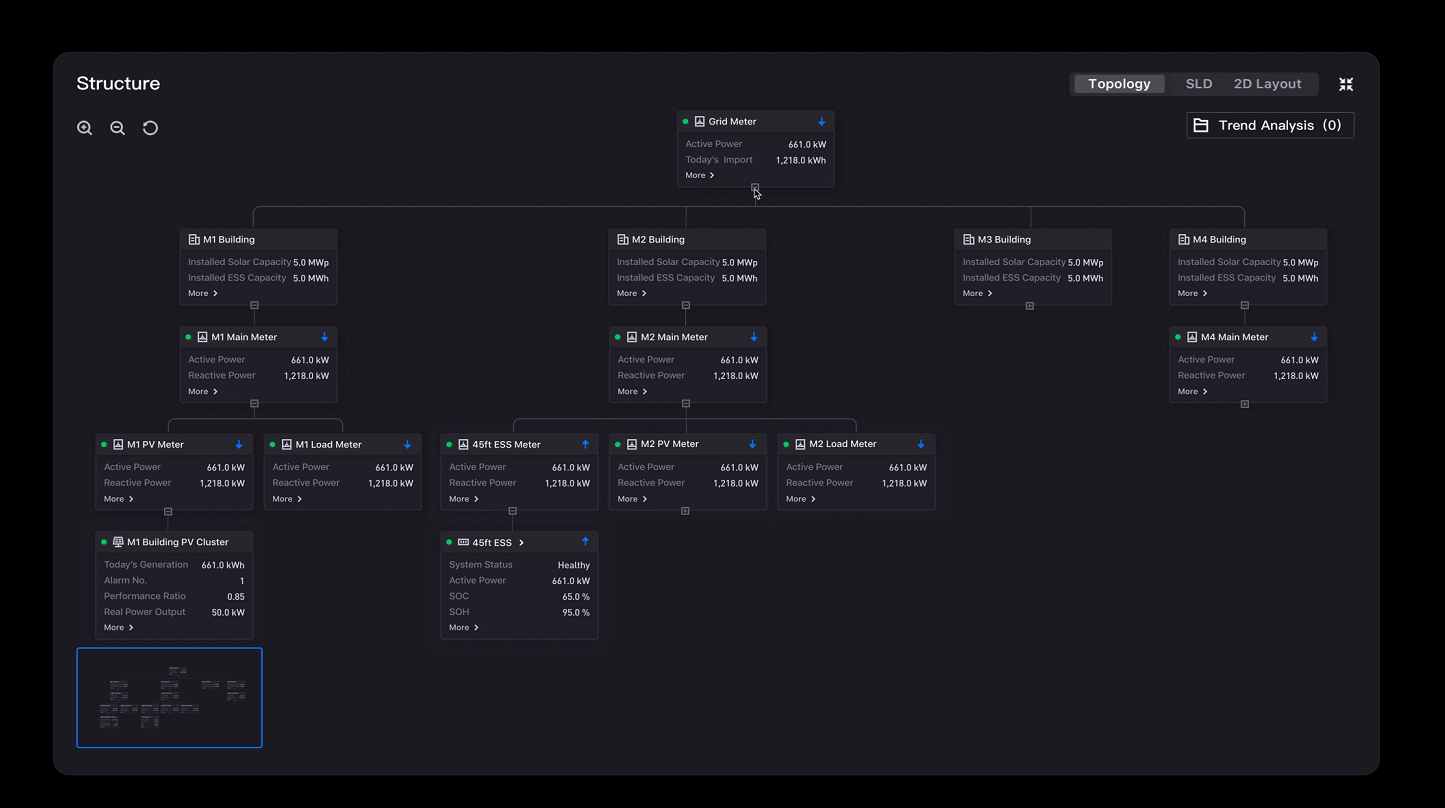
Topology widget is used to display information in a hierarchical structure. It is generally used to monitor connected assets of a site.
Node
The most basic unit of Topology is called a node, which is displayed as a card.
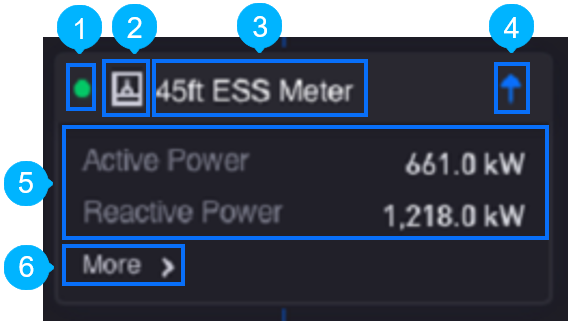
A node card can represent an asset and display the following elements for the asset:
| No. | Element | Description |
|---|---|---|
 |
Status | Indicates the connection status of the asset. It shows a green dot if there is incoming data within 20 minutes. Otherwise, a grey dot is shown. |
 |
Icon | Represents the type of component |
 |
Title | Shows the name of the component |
 |
Current Flow | Indicates the direction of electrical current. An up arrow indicates current flowing into the asset, while a down arrow indicates current flowing out of the asset. |
 |
Content | Shows a list of measurement point values |
 |
More Information | Displays additional data values in a separate dialog box. |
Node Display Functions
By default, only the first three layers including the root node are shown, the rest are hidden.
To expand or hide child nodes, select the + and - buttons located at the bottom of the parent node. If there are no child nodes, the button will not be displayed. To reset to the map’s default state, select  located at the top left.
Data Fields
The data fields required are:
| Field | Quantity |
|---|---|
| Dimension | 0 - 2 |
| Measurement | Unlimited |
Note
Only supports Common Data Service (CDS) Topology type data sources.
Chart Style
Node Style
Format the node appearance.
Header
| Field | Description |
|---|---|
| Title | Specify the data field that holds the header title. |
| Font | Style the title label. |
| Jump Configuration | Set select measurement to jump to links. The configuration is the same as the title jump, see Title Jump. URL address supports placeholder implementation with passing parameters. For more information, see Configuring Page Parameters. |
| Jumpable Model | Enter the model types that support title jumping, and separate multiple assets with commas (,). Only card titles whose models in the card are configured as jumpable models are available for title jumping. |
| Icon | Specify the data field that holds the icon. |
| Status | Specify the data field that holds the status of each node. |
| Current Flow | Specify the data field that holds the direction of current flow. |
Content
| Field | Description |
|---|---|
| Name Font | Style the name labels. |
| Value Font | Style the value labels. |
| Decimal Places | Round up the displayed chart data to the specified decimal places. |
| Convert Unit | Select this to enable unit conversion based on magnitude of data value. |
| Unit Font | Style the unit labels. |