| Jump Configuration |
Select it and configure the title jump in the pop-up window. Read more in Title Jump. |
| Name Font |
Style the indicator name labels. |
| Unit Name |
Specify the unit for chart data. The unit name will not be displayed if you chose to show data as percentage values. |
| Dynamic Unit |
Select this to automatically use the unit that suits your data values. |
| Unit Font |
Style the unit labels. |
| Unit Wrap |
Select this to display the percentage symbol or unit with the data value in two lines. |
| Value Font |
Style the value labels. |
| Axis Range |
Specify the data range. |
| Decimal Places |
Round up the displayed chart data to the specified decimal places. |
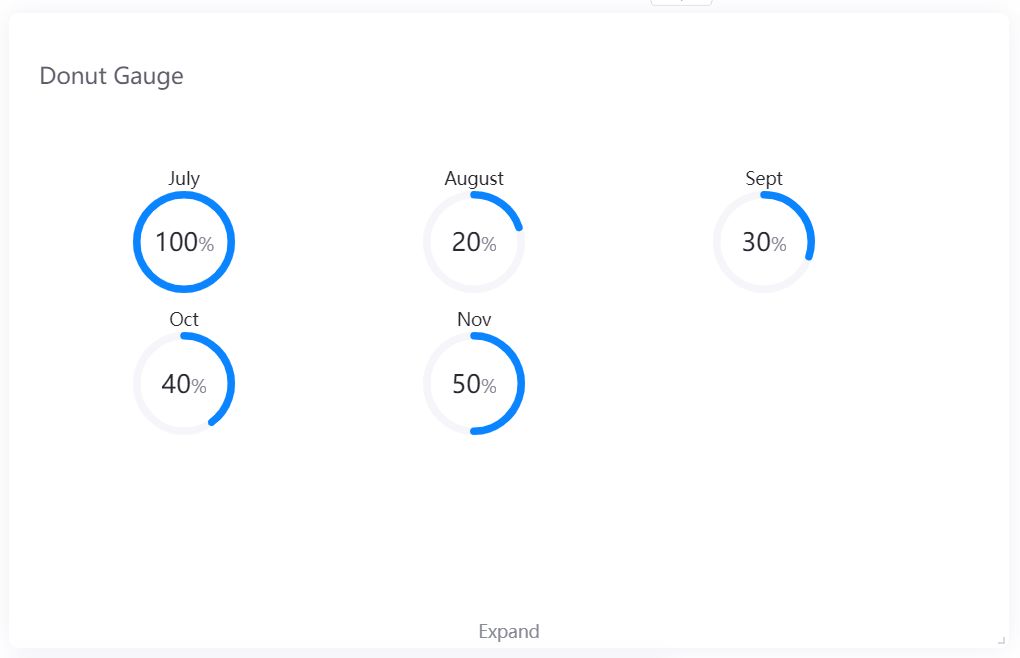
| Show As Percentage |
Display the chart data as percentage values. |
| Formatting Rules |
Set rules to display different color for different measurement values. |