Unit 3: Creating Your Dashboard in DTV
In this unit, you will learn how to create a widget that displays the change in battery current over time.
Step 1. Creating a Project and the Page
You need to create a project, and then a page to hold widgets.
Log in to EnOS Application Portal, and select the organization assigned to you.
Click Dashboard on the Navigation Pane.
Click New on the sidebar.
A dialog window is displayed.For Type, select Project.
For Project, select For Page.
For Name, specify a preferred name for your project.
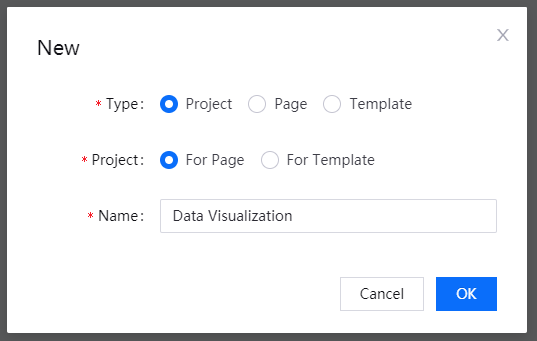
Click OK.
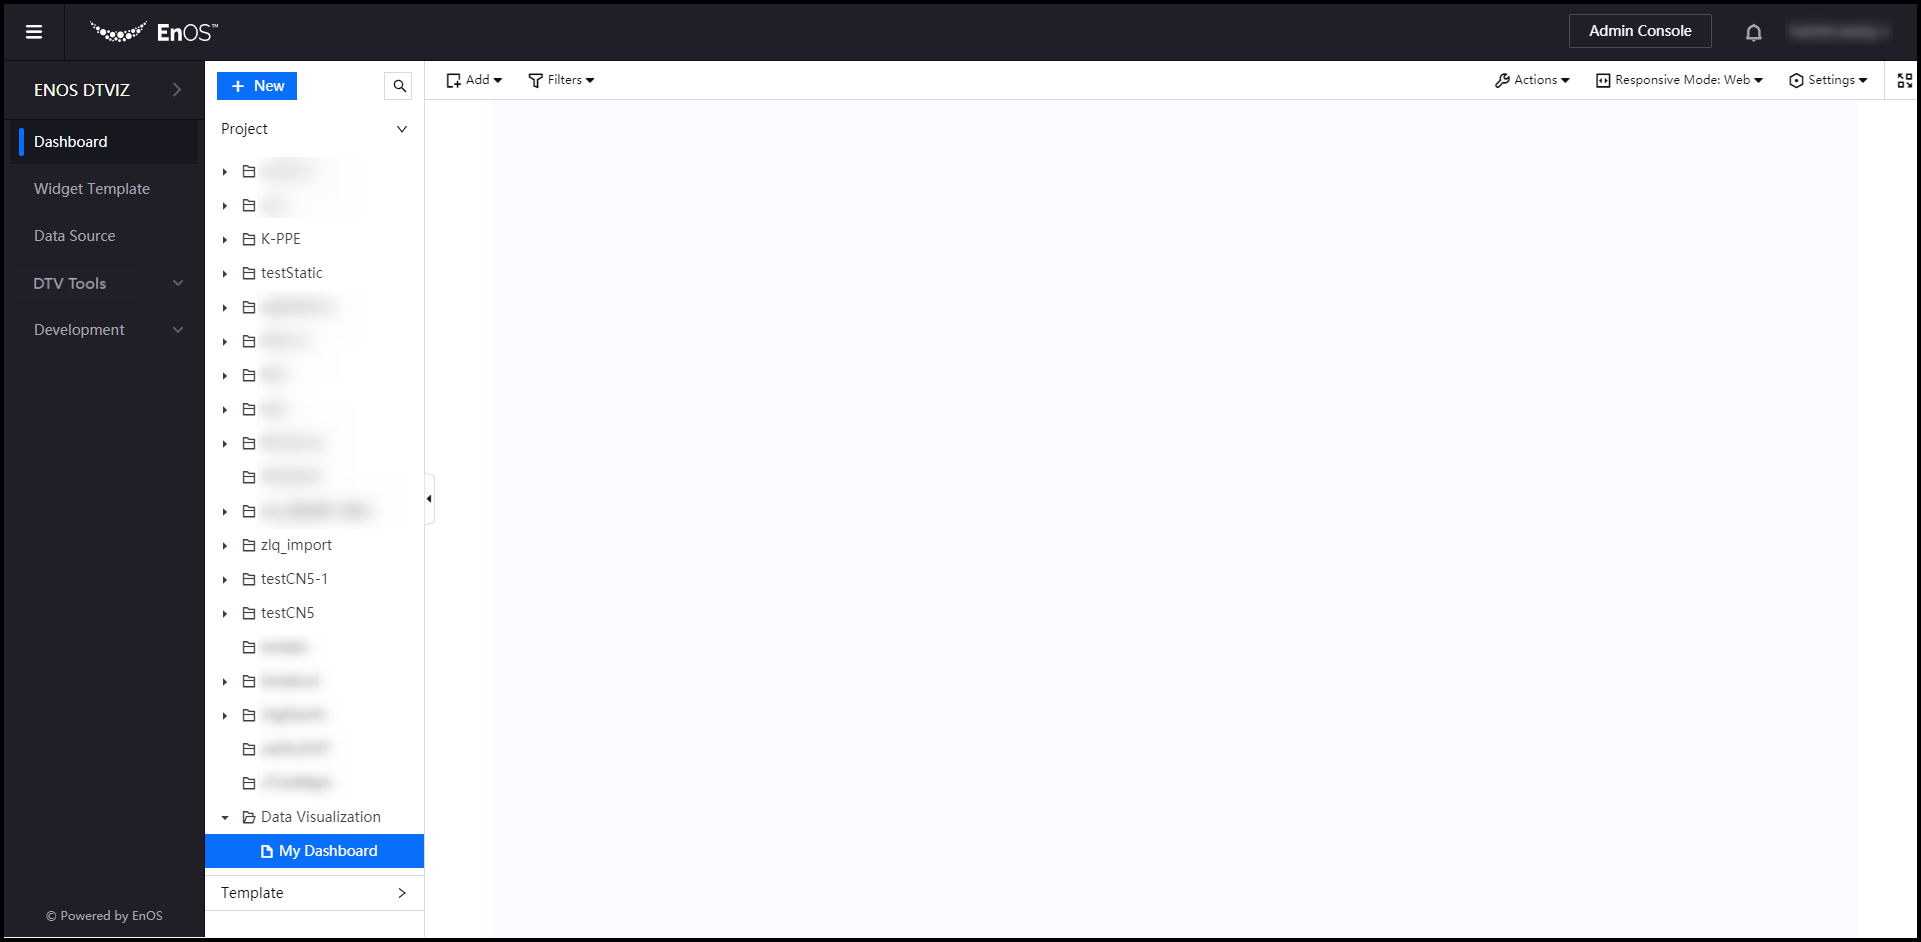
Your project is created and you can see it on the sidebar, under the Project category.To create the page, click New on the sidebar again.
The same dialog window is displayed.For Type, select Page.
For Name, specify a preferred name for your page.
For Project, select the name of the project that you just created.
Leave the Template box blank.
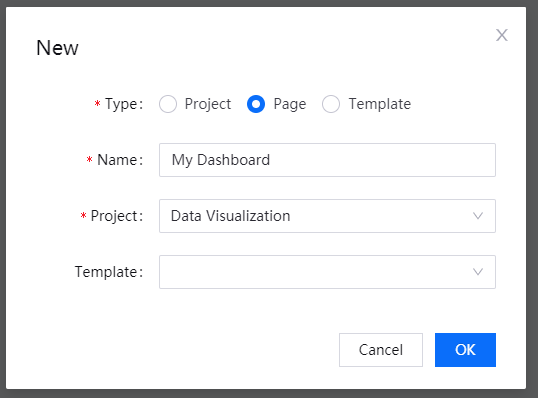
Click OK. Your page is created.
On the sidebar, expand your project, and click the page that you just created.
The Page Editor appears on the right pane.
You have successfully created a new project, and a new page that you will use for displaying your data.
Step 2. Creating a DTV Widget
Now, you will create a DTV widget that plots and displays the data measured.
There are many widgets for you to choose, and they have different purposes. For instance:
Liquid Fill, Donut Gauge are suitable for measuring progress.
Mix Chart is good for visualizing and comparing trends.
Table is good for displaying complex data in an organized tabulated form.
There are many other widgets on DTV which you can explore. You can read about them at Widgets.
Since we want to see how the battery current changes over time, we will use the Mix Chart widget.
In the Page Editor, hover over Add on the toolbar and select Widget (New). The Chart Editor appears on the same pane.
In the Chart Selection section, select Mix Chart
 .
.In the Basic Information > Basic Options panel, you can specify a title and a basic description for your widget.
Configure the Data Fields section as follows:
From the Data Source list, select AI Raw Data.
From the Category list, select SmartBattery_Model_a01, which is the model you created earlier.
Leave the Aggregation field as Raw Data.
For Dimension, add the timeOfDay or a relevant data field. This is the horizontal axis of the chart.
For Measurement, add the current or a relevant data field. This is the vertical axis of the chart.
In the Measurement Style section, from the Chart Type list, select Line. This plots your data on a line chart.
You can choose to style how your mix chart looks like in Chart Style. For information on styling options, you can refer to the Mix Chart documentation.
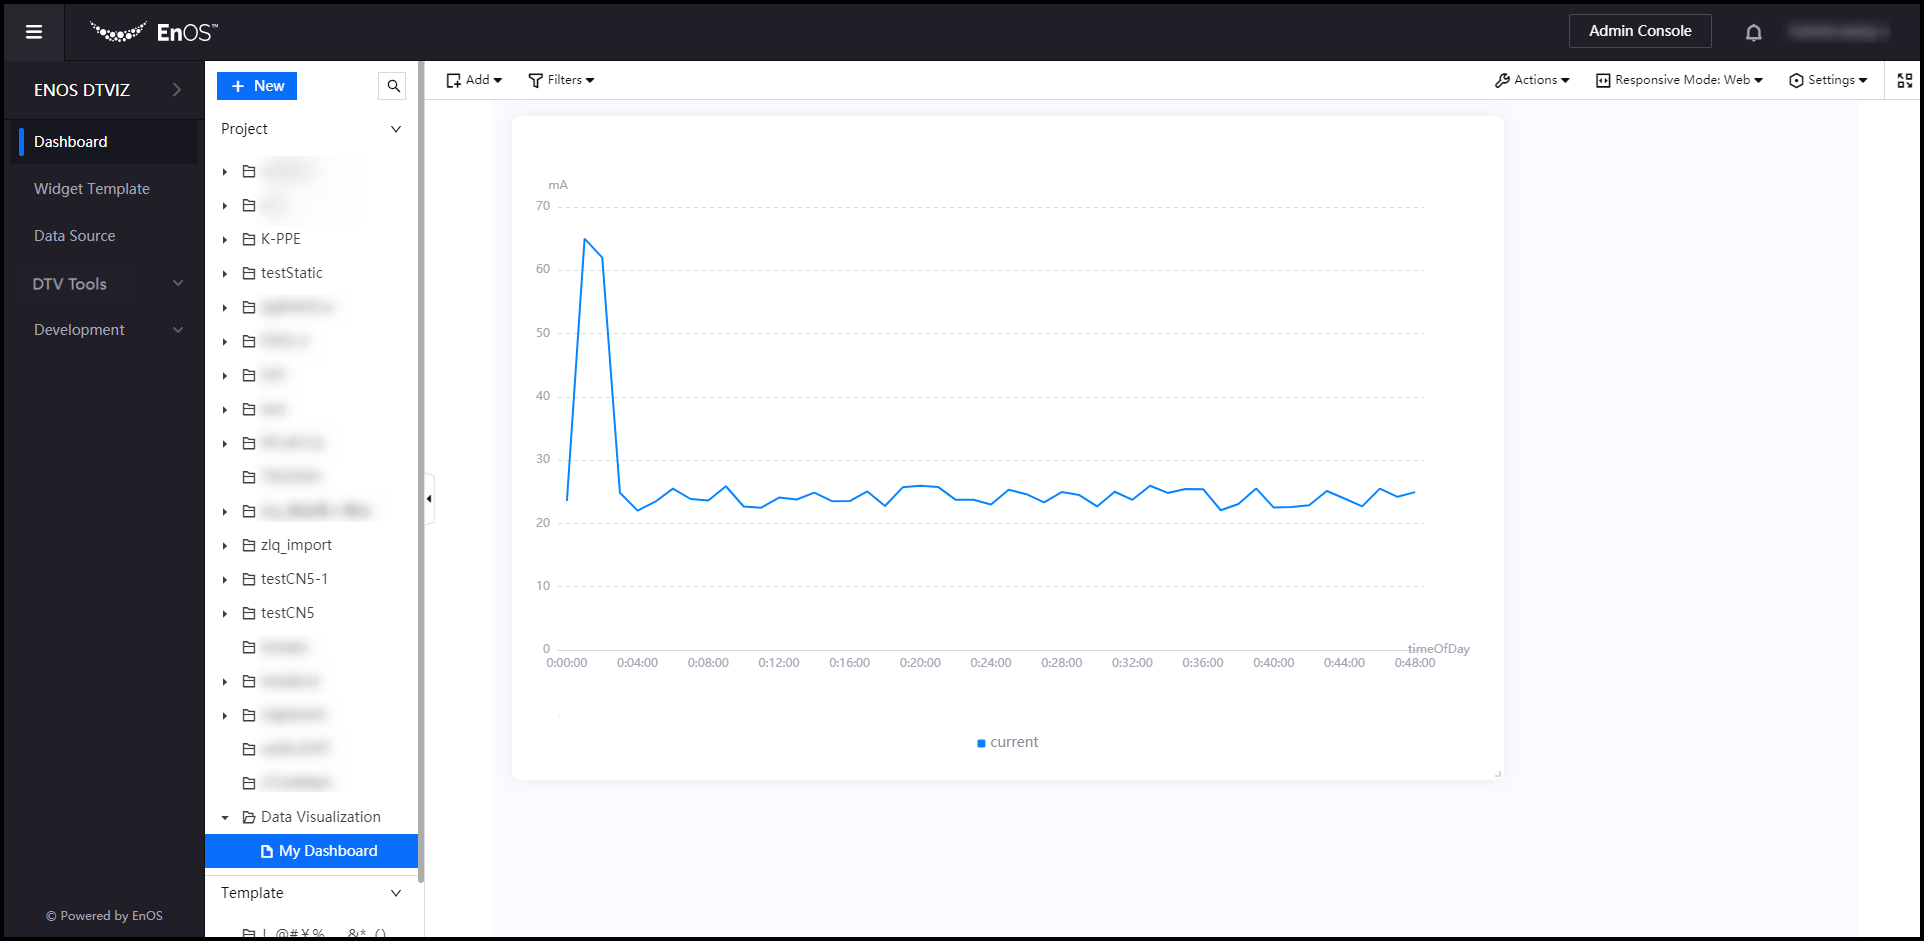
After you have finished, click Save, which is located below the chart.
To view your new widget on the dashboard, click the return arrow
 located on the toolbar.
Step 3. Exploring More Widgets
Now, you can create a page for monitoring the performance of your batteries with the following charts:
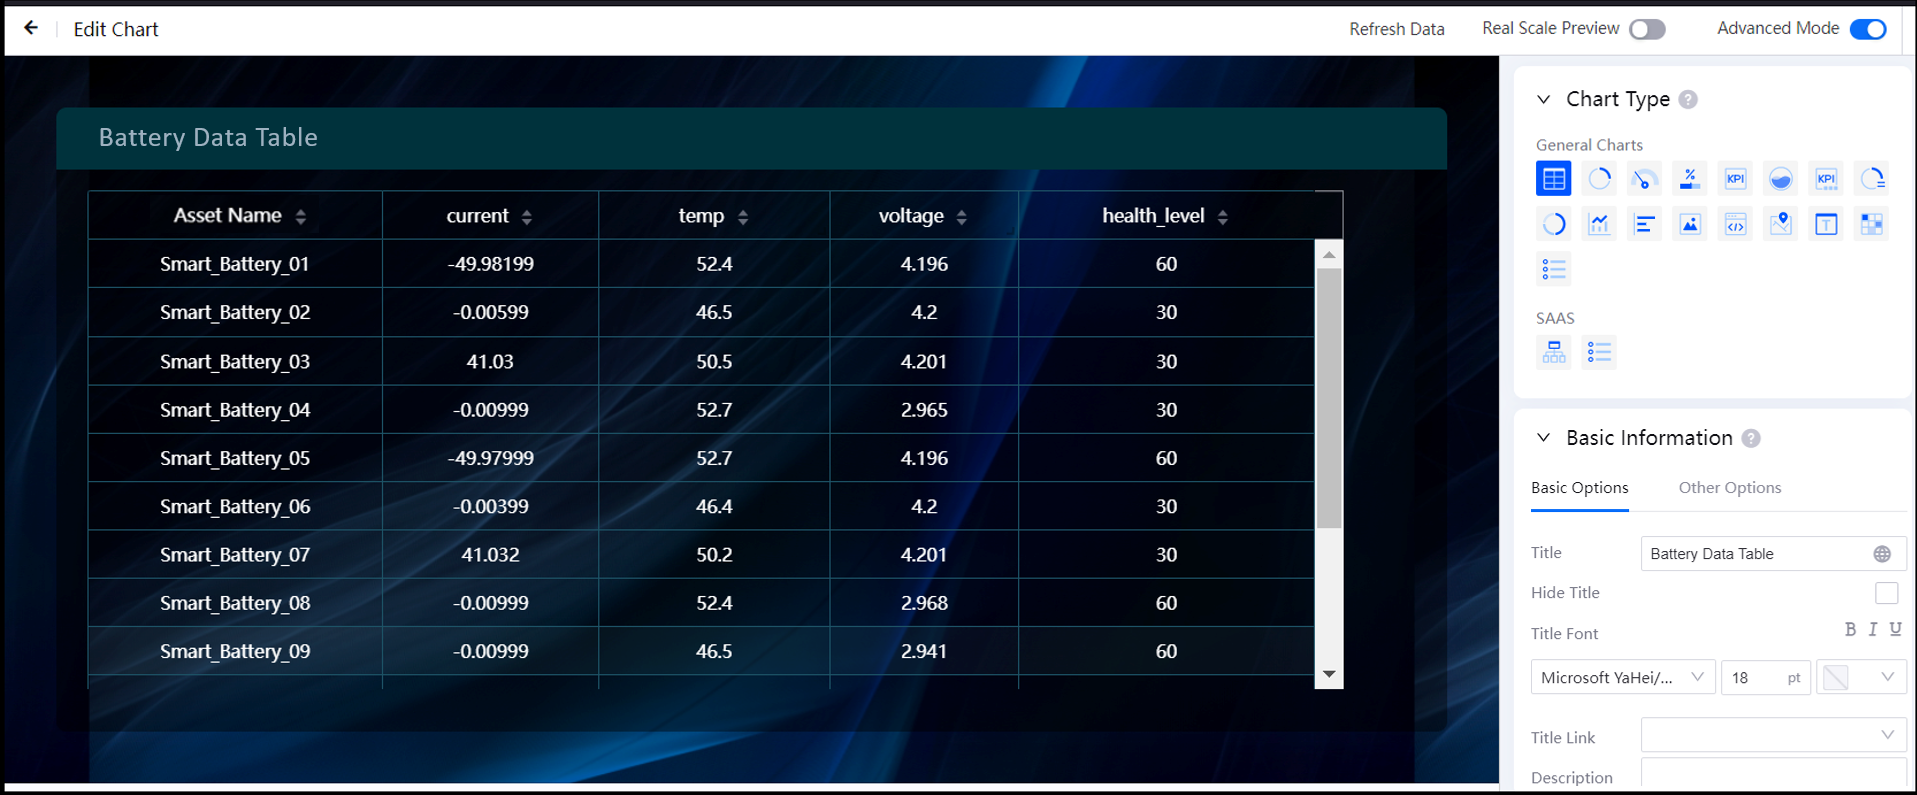
A Table that contains performance data of your batteries
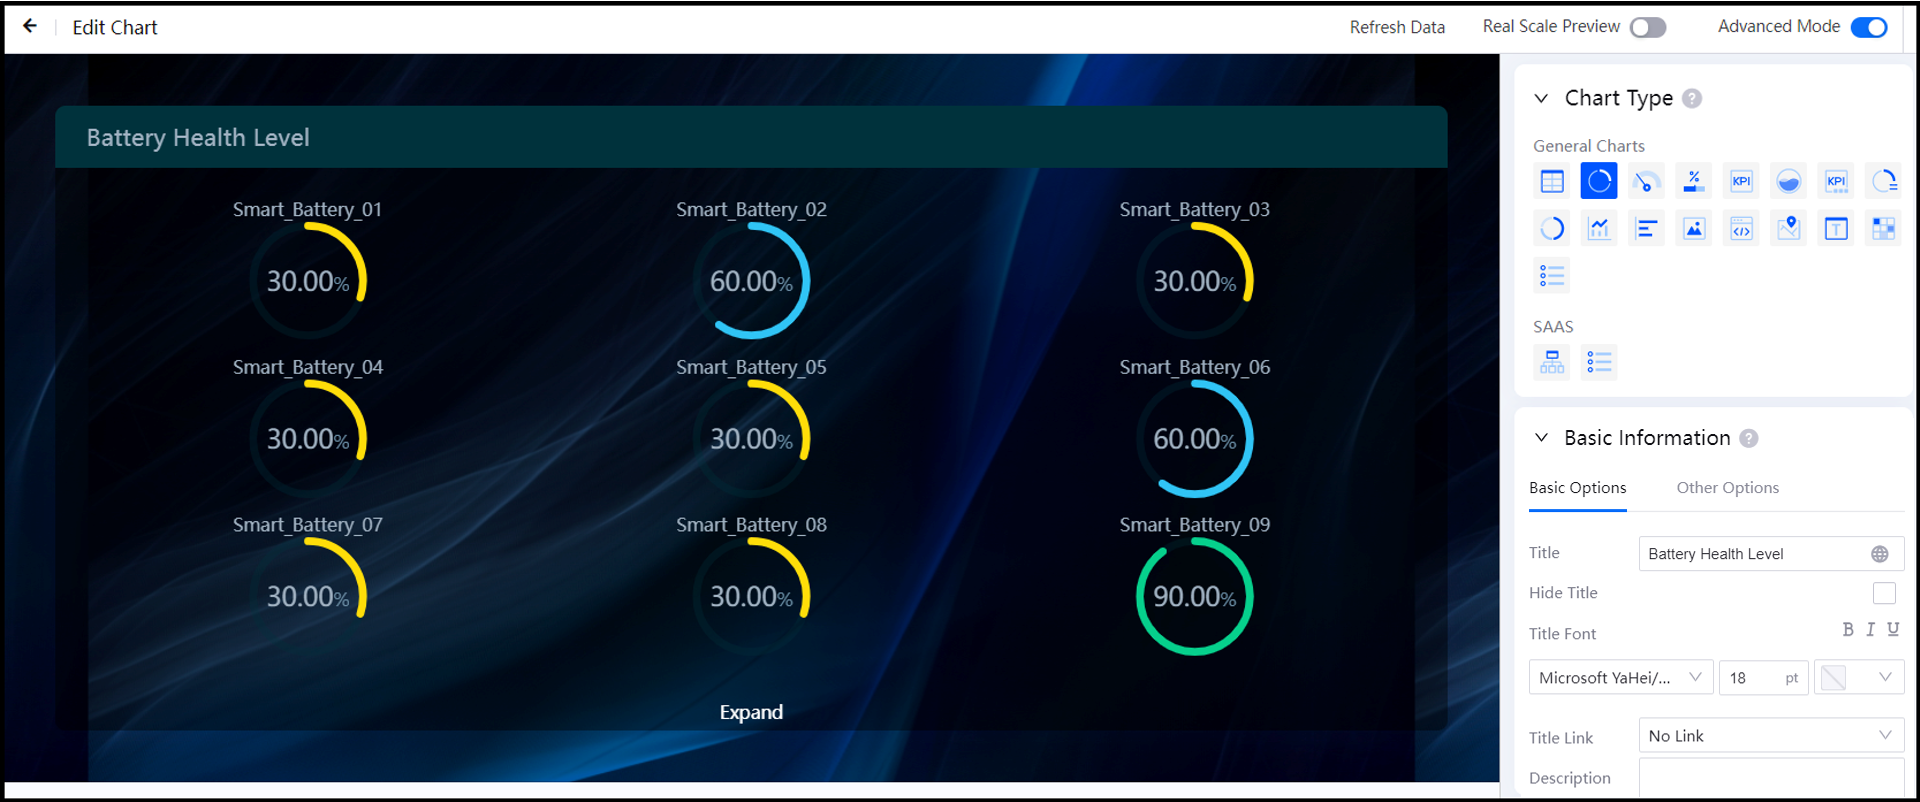
A Donut Gauge that displays the health level of your batteries
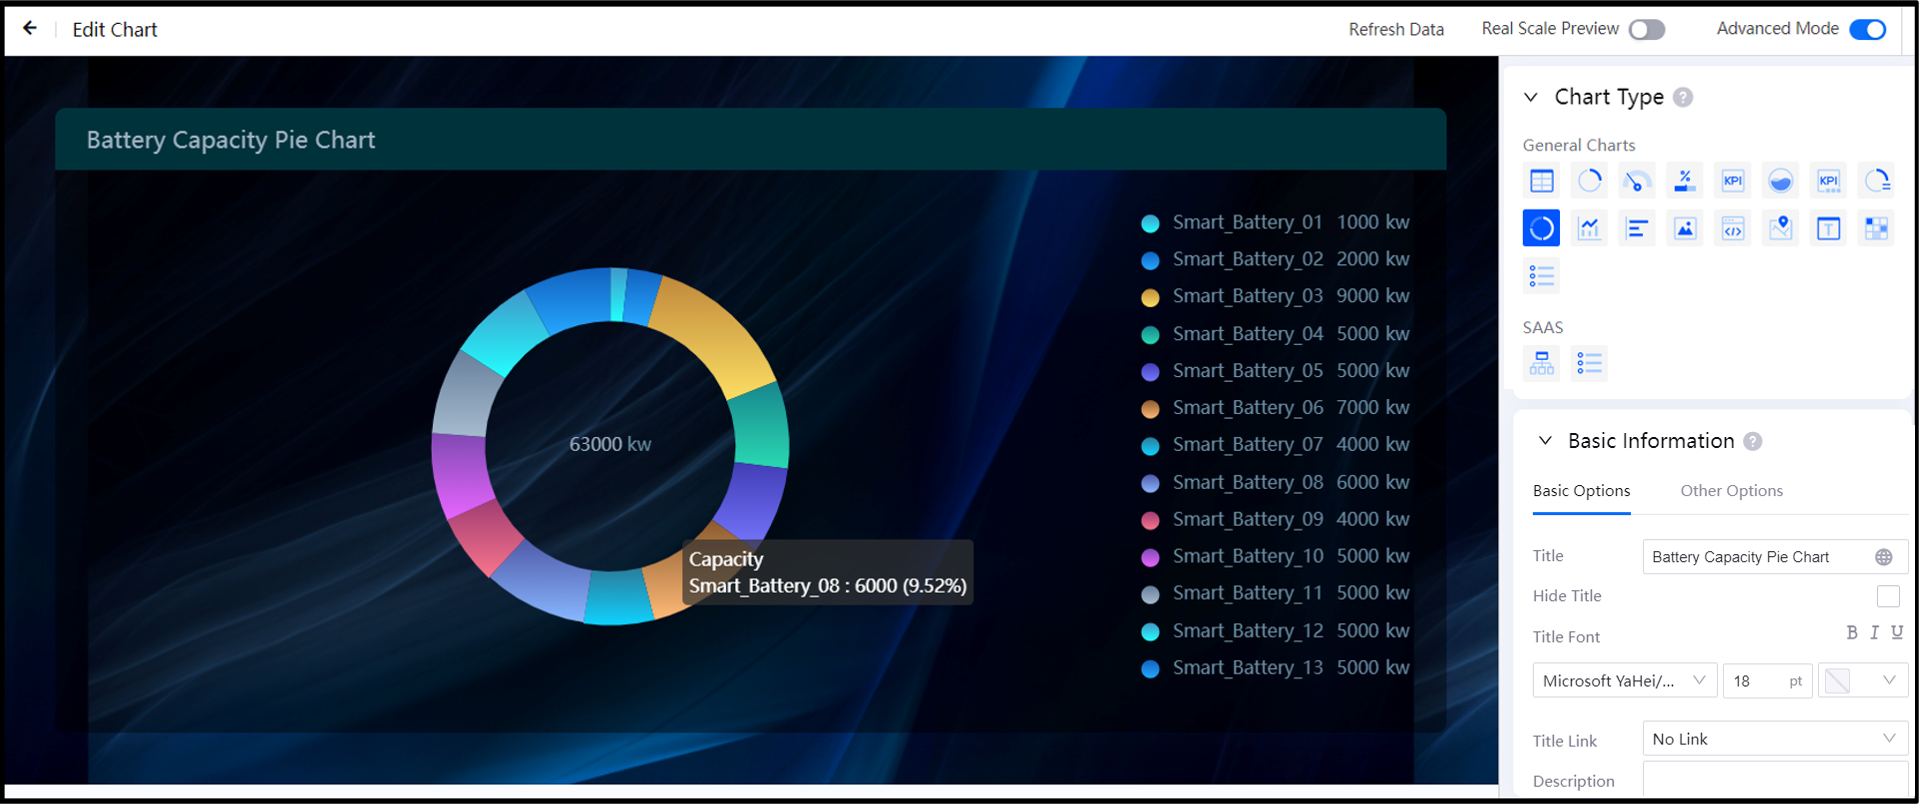
A Pie Chart that displays the capacity of your batteries
See the following examples:
Table Chart
Donut Gauge Chart
Pie Chart