Key Concepts
The user and permission system of EnOS Data Quality are inherited from EnOS Application Portal. Before you start, you need to learn about the key concepts of EnOS Application Portal.
Below are the key concepts of Data Quality.
Quality Dimensions and Data Quality Metrics
Quality dimensions are perspectives used to observe and analyze data quality.
Data Quality can assess data quality from the dimensions of completeness, validity, and timeliness.
Completeness rate, validity rate, timeliness rate, and coverage rate are the data quality indicators used to assess quality dimensions.
Credibility is the data quality indicator to assess metric data.
Completeness, Coverage Rate and Completeness Rate
Completeness is used to measure the integrity of data collection. If data is uploaded within a certain time range, the data is considered complete, and if no data is uploaded, it is considered missing. Data Quality supports configuring rules based on the missing data template to measure the data completeness.
Coverage rate and completeness rate are the numerical representation of completeness, where:
Coverage rate reflects the coverage of data access.
Completeness rate reflects the integrity of data.
Coverage rate = (Number of covered measurement points / Number of measurement points should be covered) x 100%, where:
The number of covered measurement points counts the measurement points that have finished data mapping or uploaded asset data.
The number of measurement points should be covered counts the measurement points that are supposed to be mapped or to upload asset data.
Based on different evaluation types, the following two logics exist for calculating the completeness rate:
When the evaluation type is Cycle:
Completeness rate = (Number of complete cycles per day/Total number of cycles per day) x 100%, where the number of complete cycles per day represents the sum of the cycles with data uploaded of the day, the total number of cycles per day = (24 hours/statistical period) indicating the total number of cycles of the day. The completeness rate is rounded forward when the division of the statistical period is not possible.For example, when the evaluation cycle is 10 minutes, the system determines every 10 minutes whether data has been uploaded in the current time period, and if so, the number of the complete cycle is recorded as 1. The number of periods with complete data accumulates as the number of complete cycles per day.
Total number of cycles per day = ((24 hours x 60 minutes)/10 minutes) = 144.The completeness rate of the measurement points of the device = (Accumulated value of complete data cycles/144) x 100%.When the evaluation type is Valid Time:
Completeness rate = (The number of valid time periods / The number of total time periods) x 100%. The number of total time periods is fixed to be288, andThe number of valid time periods = 288 - The number of 5-minute periods in the time periods with missing data issues.
Validity and Validity Rate
Validity is used to measure whether the data value is within the defined value range or whether the timestamp of the data is normal. Data Quality supports configuring rules based on the out of range template, stuck data template, jumped data template, and future timestamp template to measure the validity of data.
The validity rate is the numerical representation of validity, which quantitatively reflects the validity of the data.
Validity = (Valid points per day/Total uploaded points per day) x 100%, where the valid points per day represent the number of valid points uploaded by the device of the day, and the total uploaded points per day represents the number of all points uploaded by the device of the day.
Timeliness and Timeliness Rate
Timeliness reflects the time interval between when data is generated and when it can be viewed. Data Quality supports configuring rules based on the delayed data template to measure whether the data uploaded by the device is timely.
The timeliness rate is the numerical representation of the timeliness, which quantitatively reflects how quickly the data is synchronized.
Timeliness rate = (Undelayed points per day/Total uploaded points per day) x 100%, where the undelayed points per day represent the number of points uploaded by the device of the day that did not trigger the Delayed Data rule, and the total uploaded points per day represents all points uploaded by the device of the day.
Credibility
Credibility reflects how reliable the metric data are. Data Quality supports configuring rules based on ` <../howto/config_metric_quality.md>`_ to configure rules for the assessment on the credibilities of metric data.
Credibility = Metric completeness rate x Metric validity rate) x 100%. Metric completeness rate refers to the rate of metrics that have calculation results on specified dates, and metric validity rate refers to the rate of metrics of which the values fall into the specified valid range.
Monitoring Groups
A monitoring group is a collection of monitoring objects with some common characteristics. Data Quality currently supports configuring the device model in EnOS Device Connectivity & Management as the monitoring group, such as the public model: Wind Turbine Basic (EnOS_Wind_Turbine).
In Data Quality, if a certain model in EnOS Device Connectivity & Management is selected as the monitoring group:
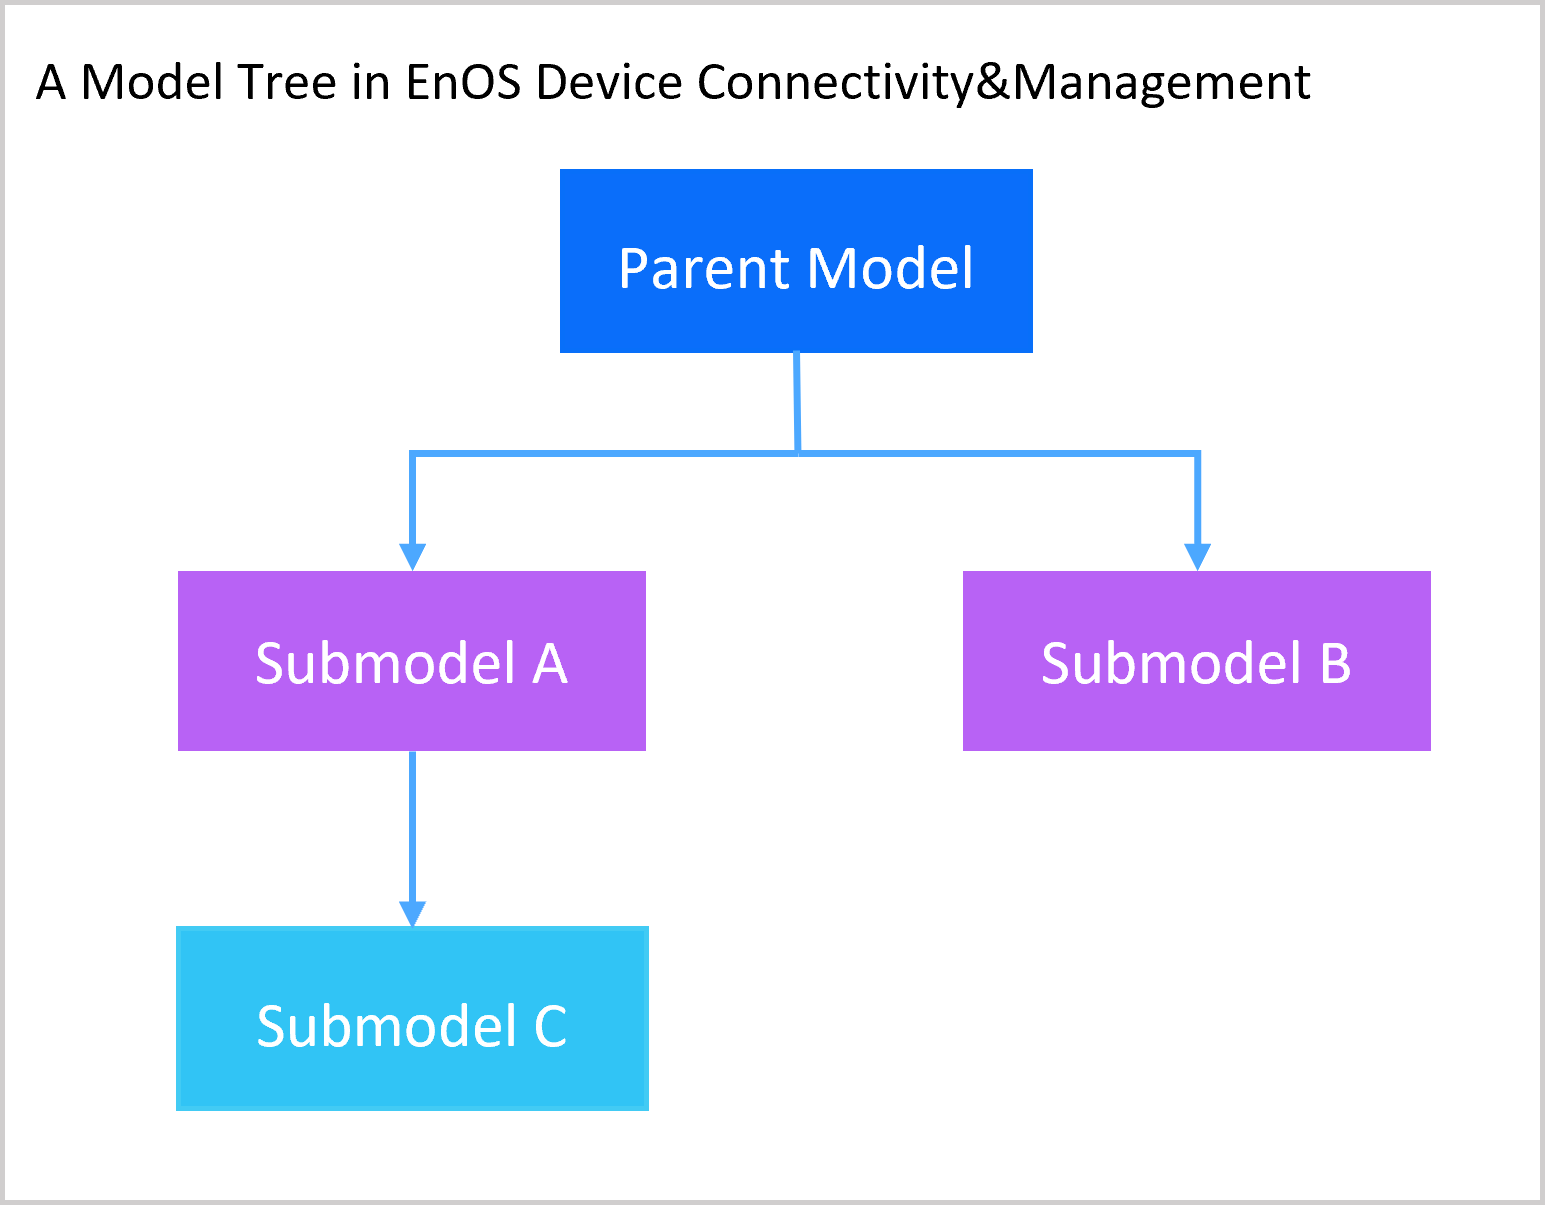
No submodel or parent model of this model can be set as a new monitoring group. For example, when
Submodel Ain the figure below is set as a monitoring group, neitherParent ModelnorSubmodel Ccan be set as the monitoring group.The peer model can be set as a monitoring group. For example,
Submodel Bcan be set as a monitoring group.
Monitoring Objects
A monitoring object is the most fine-grained monitoring unit in Data Quality. Data Quality currently only supports configuring the measurement point of the device model in EnOS Device Connectivity & Management as a monitoring object. For example, the measurement point WWPP.APProduction of the public model Wind Turbine Base (EnOS_Wind_Turbine) can be configured as a monitoring object.
In Data Quality, if a certain model in EnOS Device Connectivity & Management is selected as the monitoring group, the following measurement points can be configured as monitoring objects:
The measurement points of this model.
The measurement points of both the parent model of this model.
The measurement points of the sub-models of this model.
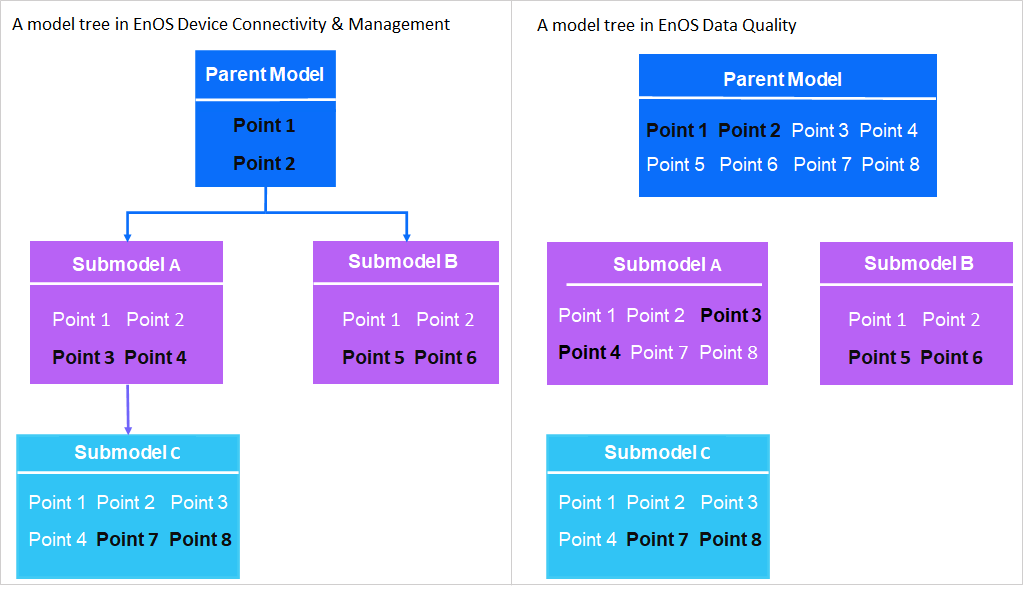
For example, the “model” is composed of “submodel A”, “submodel B”, and “submodel C”, and these models have the following measurement points:
Parent model: contains measurement points 1 and 2
Submodel A: contains measurement points 3 and 4
Submodel B: contains measurement points 5 and 6
Submodel C: contains measurement points 7 and 8
In EnOS Device Connectivity & Management, the following measurement points can be viewed based on the models:
Parent model: contains measurement points 1 and 2
Submodel A: contains measurement points 1, 2, 3, and 4
Submodel B: contains measurement points 1, 2, 5, and 6
Submodel C: contains measurement points 1, 2, 3, 4, 7, and 8
In Data Quality, if EnOS Device Connectivity & Management is selected as the data source, the following measurement points and models can be configured as the monitoring groups and objects:
When selecting the parent model as the monitoring group: measurement points 1, 2, 3, 4, 5, 6, 7, and 8 can be selected as the monitoring objects
When selecting the submodel A as the monitoring group: measurement points 1, 2, 3, 4, 7, and 8 can be selected as the monitoring objects
When selecting the submodel B as the monitoring group: measurement points 1, 2, 5, and 6 can be selected as the monitoring objects
When selecting the submodel C as the monitoring group: measurement points 1, 2, 3, 4, 7, and 8 can be selected as the monitoring objects
Core/Non-Core
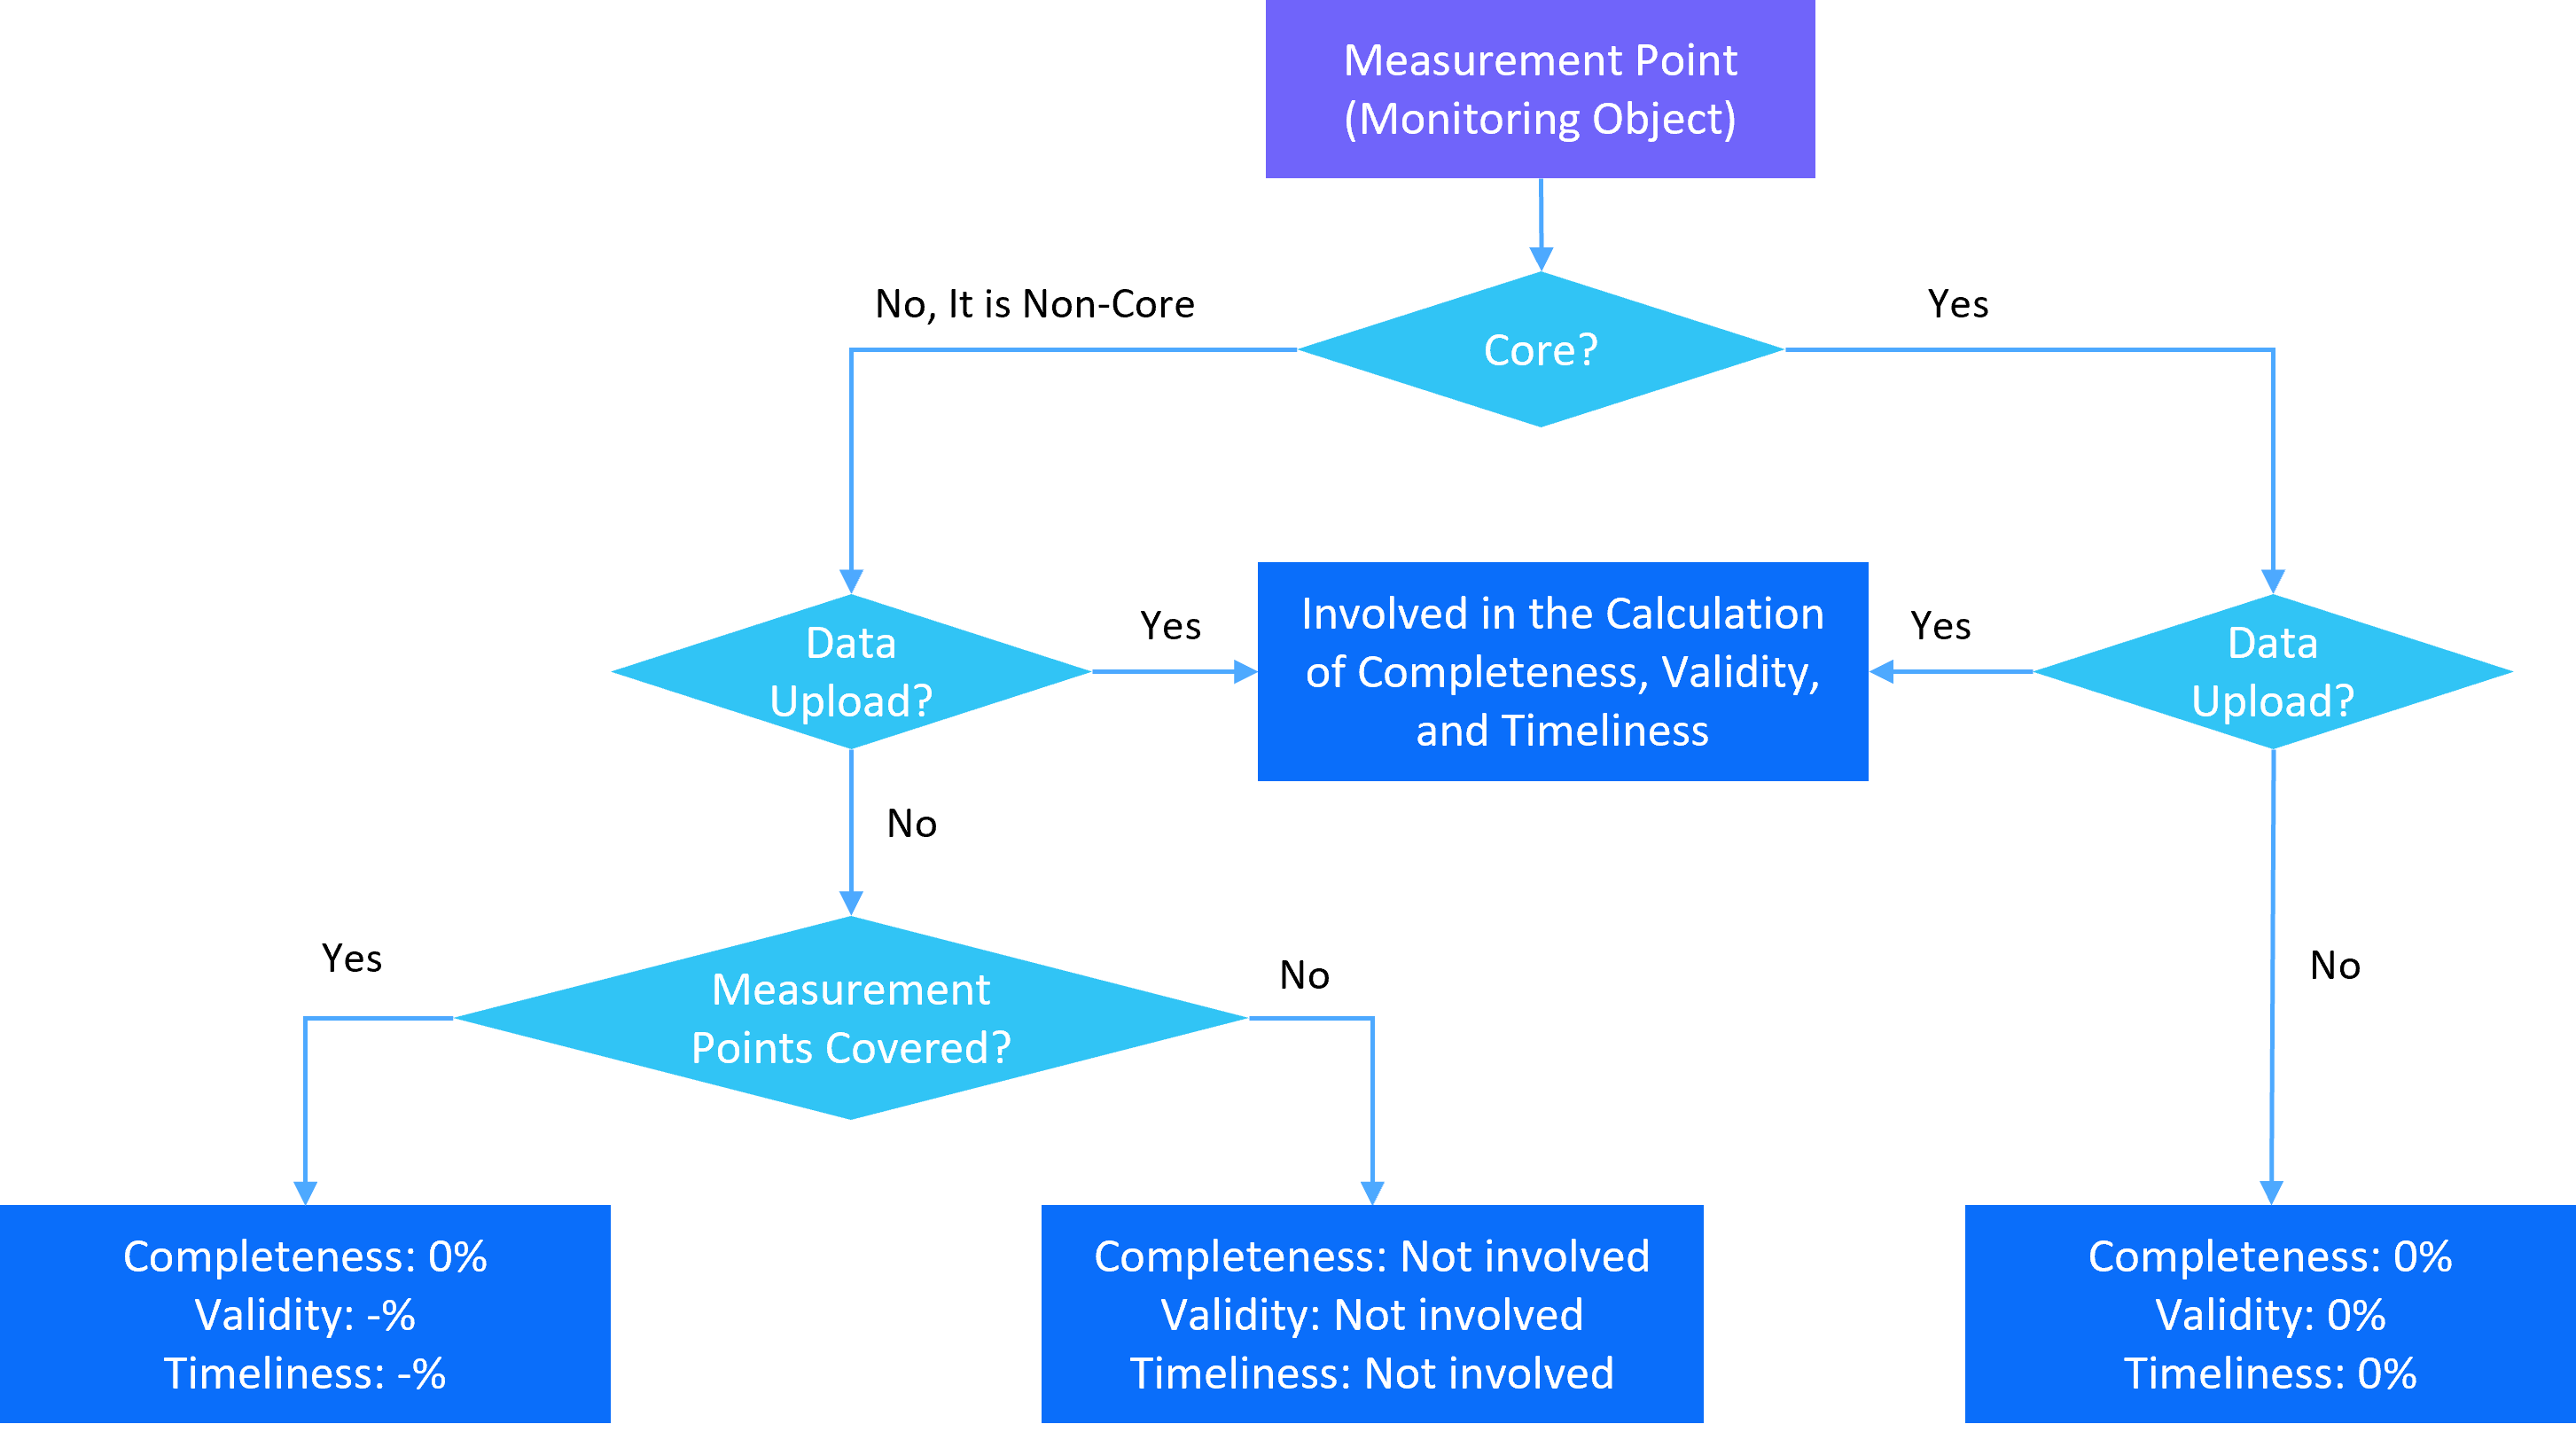
When the measurement point has been configured with assessment rules for completeness, validity, and timeliness:
Core measurement points: Regardless of whether data are uploaded or not, the measurement points are involved in the calculations of completeness, validity, and timeliness, and are displayed in quality dashboards and quality reports.
Non-core measurement points:
When measurement points are uploading data: Measurement points participate in the calculation of completeness, validity, and timeliness, and are displayed in the quality dashboards and quality reports.
When measurement points are covered but no data are uploaded: Measurement points participate in the calculation and display of Completeness and the calculation results of Completeness are 0%; Measurement points participate in the calculation and display of Validity and Timeliness and the calculation results are both -%.
When measurement points are not covered: Measurement points do not participate in the calculations of completeness, validity, and timeliness, and the results are not displayed.
Note
The covered measurement point means that the measurement point of the device has been connected and mapped with the measurement point of the model in EnOS Device Connectivity & Management.
Refer to the following illustrations for a better understanding:
Assessment Rules
Assessment rules are data assessment rules set according to the specific quality dimensions. Data Quality currently supports the configuration of the following assessment rules: Out of Range, Missing Data, Stuck Data, Jumped Data, Delayed Data, and Future Timestamp.
One rule template only supports one rule under the same monitoring object, and:
Up to 6 assessment rules, including Out of Range, Missing Data, Stuck Data, Jumped Data, Delayed Data, and Future Timestamp, can be configured for numerical (int, float, double) monitoring objects.
Up to 3 assessment rules, including Missing Data, Delayed Data, and Future Timestamp, can be configured for non-numerical monitoring objects.
Dimension Tables
In Data Quality, dimension tables are used to store attribute data divided by different attribute dimensions based on devices. Attributes in dimension tables can be used as variables to construct dynamic thresholds in assessment rules.
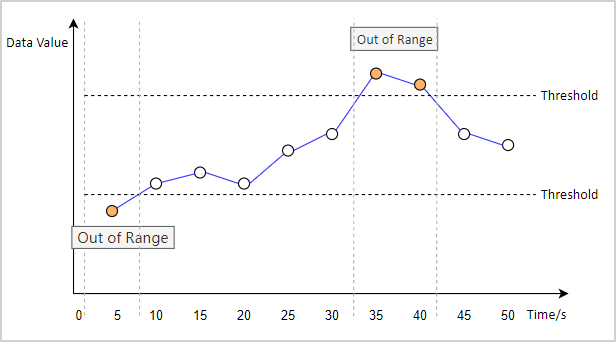
Out Of Range
When the value of the data sent by the measurement point exceeds the set fixed threshold or dynamic threshold, the data is considered to be out of range. For more information, see Out of Range Template.
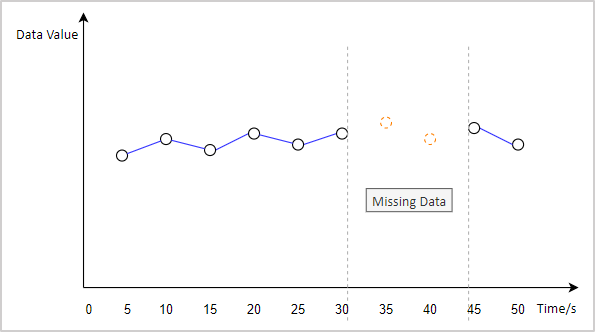
Missing Data
If the data of the measurement point is not uploaded according to the specified frequency or within the specified evaluation cycle, the data is considered missing. For more information, see Missing Data Template.
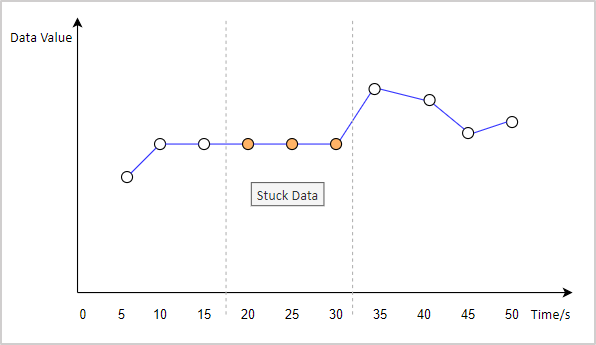
Stuck Data
When the value of the data sent by the measurement point has not changed for a continuous period time, the data is considered as stuck data. For more information, see Stuck Data Template.
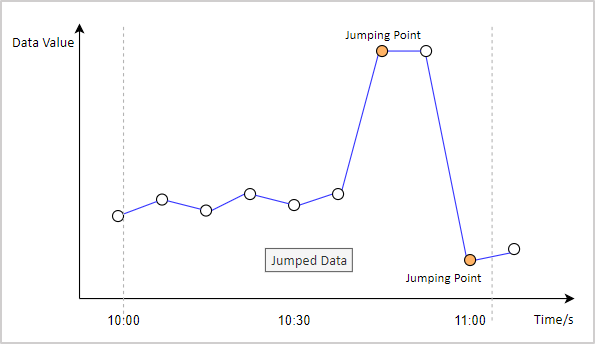
Jumped Data
When the data increment within 1 hour exceeds the fixed or dynamic threshold, or the data increment is irrational, the data is considered as the jumped data. For more information, see Jumped Data Template.
Delayed Data
The time when the message arrives at EnOS Cloud - Device timestamp > Configured delay duration, the data is considered as the delayed data. For example, if the data generation time displayed by the device is 10:10:00, the data arrives at EnOS Cloud at 10:20:00, and the set fixed threshold is 5 minutes, at this time, (20-10) > 5, the data triggers the Delayed Data rule.
For more information, see Delayed Data Template.
Future Timestamp
Device timestamp - The time when the message arrives at EnOS Cloud > Configured preceding duration, the timestamp of data is considered to be a future timestamp. The default of the Future Timestamp rule is that the device timestamp is ahead of the time when the data arrives at EnOS Cloud. For example, the data generation time displayed by the device is 10:10:00, the data arrives at EnOS Cloud at 10:00:00, and the set preceding duration is 5 minutes, at this time, (10-0) > 5, the data triggers the Future Timestamp rule.
For more information, see Future Timestamp Template.