Assessing Data Quality of the Wind Turbine
Scenario
Given the difficulty in evaluating data quality of a large number of wind turbines posed by the rapid construction of wind farms, this tutorial shows how to monitor and evaluate data quality of wind turbines by configuring assessment rules for measurement points of the simulated wind turbine device.
Tutorial Objectives
In this tutorial you will learn:
How to set the wind turbine model as a monitoring group.
How to set the measurement points of the wind turbine as monitoring objects.
How to configure assessment rules for monitoring objects to evaluate the quality of data sent by measurement points.
How to view the dashboards and download the reports.
Prerequisites
Before starting, make sure you have the following ready:
Acquired and authorized to use EnOS Data Quality.
Completed the following configurations in EnOS Application Portal > Developer Console:
Tag
auth_unit:trueto sites that need to be synchronized to Data Quality, then added the sites and devices to the asset tree.Started the simulator and sent the measurement point data of
Active Power Production (WWPP.APProduction).
Completed the following configurations in EnOS Application Portal:
Assigned the synchronized assets to the subnode
Demo_Windof theEnvisionorganization structure. For more information on creating organization structures and assigning assets to nodes, see Managing Organizational Structures.Assigned the
Envisionorganization structure to users, roles, and Data Quality. For more information, see Assigning Asset Permissions.Assigned menu groups containing System Config, Assessment Rules, Dashboard, and Report to users. If not assigned, contact the application administrator.
Asset dimensions in the organization structure will be automatically synced to Data Quality the next day.
Read through Troubleshooting the Selection of Region and Device.
Procedures
Step 1: Creating a Quality Dimension Table
Target Users: Asset Administrator
Environment: EnOS Application Portal
Create a quality dimension table according to the following steps, and the attributes in the dimension table can be used as variables to construct the dynamic thresholds required for Out of Range and Jumped Data rules.
Log in to EnOS Application Portal and select Data Quality from the application list.
Select Configuration Management> System Config from the left navigation pane, which goes to the Quality Dimension Table page by default.
Select New and enter the following information on the New Quality Dimension Table page:
Table ID:
wind_turbine_data_qualityTable Name:
wind_turbine_data_qualityData Source Type:
EnOS Iot HubModel:
EnOS_Wind_TurbineAttribute:
Rated power (ratedPower)
Select OK to finish creating the quality dimension table.
The created quality dimension table will take effect immediately, and can be viewed in the Configuration Management> System Config page list. The latest configuration information in the quality dimension table will be automatically synchronized from EnOS Device Connectivity & Management daily at 02:00:00 in the UTC+8:00 time zone of the current user’s computer.
Step 2: Creating a Monitoring Group and Monitoring Objects
Target Users: Asset Administrator
Environment: EnOS Application Portal
Set the public model in EnOS Device Connectivity & Management as a monitoring group, and then configure the measurement points of the model as monitoring objects of the monitoring group according to the following steps. The raw data sent by the measurement points of the model are objects assessed by assessment rules.
Select Assessment > Assessment Rules from the left navigation pane.
Select New Monitoring Group and enter the following information in the New Monitoring Group pop-up:
Data Source:
EnOS IoT HubMonitoring Group:
Wind turbine base (EnOS_Wind_Turbine)Monitoring Object:
WWPP.APProduction, and set it as aCoremeasurement point
Select OK to complete monitoring group creation.
After the monitoring group is created, it can be viewed in the list of the Assessment > Assessment Rules page.
Step 3: Creating Assessment Rules
Target Users: Asset Administrator
Environment: EnOS Application Portal
Configure assessment rules for monitoring objects from the dimensions of completeness, validity, and timeliness, and assess the data sent by the device according to the following steps.
Select Assessment > Assessment Rules from the left navigation pane.
At the end of the
Wind Turbine Basemonitoring group row, select Configure Rules and go to the Configure Rules page.
Select New Rule, and then select
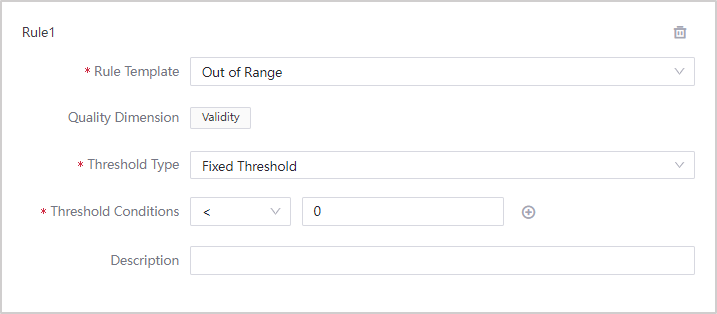
WWPP.APProductionas the Monitoring Object on the New Rule page.Select Add Rule to set the Out of Range rule based on the following information, and then assess data quality from the dimension of Validity:
Rule Template:
Out of RangeQuality Dimension:
ValidityThreshold Type:
Fixed ThresholdThreshold Conditions:
< 0
Meaning of this rule: When the data value sent by the measurement point is less than zero, the data is considered to trigger the Out of Range rule.
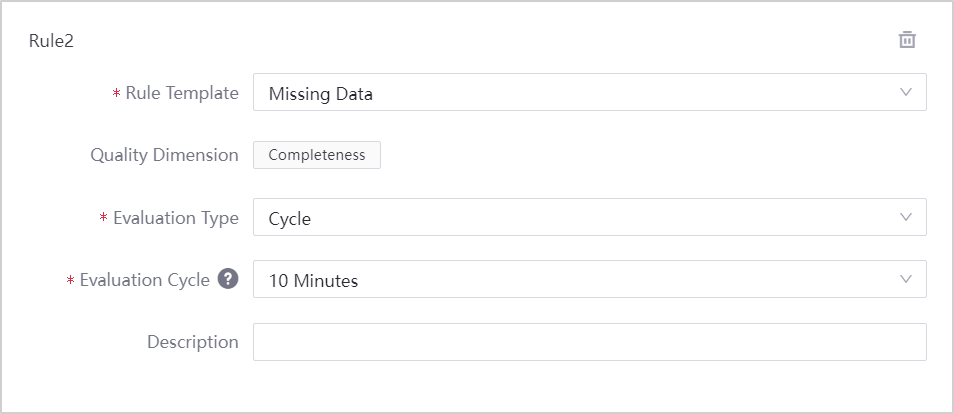
Configure the Missing Data rule based on the following information to assess data quality from the dimension of Completeness:
Rule Template:
Missing DataQuality Dimension:
CompletenessEvaluation Type:
CycleEvaluation Cycle:
10 Minutes
Meaning of this rule: The system determines every 10 minutes whether data has been uploaded, if the data is not uploaded within 10 minutes, the data is considered to trigger the Missing Data rule.
Configure the Jumped Data rule based on the following information to evaluate data quality level from the dimension of Validity:
Rule Template:
Jumped DataQuality Dimension:
ValidityThreshold Type:
Dynamic ThresholdQuality Dimension Table:
wind_turbine_data_qualityThreshold Conditions:
> ${ratedPower}*2 Or < 0
Meaning of this rule: When the increment of the data value within 1 hour less than zero, or greater than 2 times the value of the
ratedPowerattribute of theEnOS_Wind_Turbinemodel, the data is considered to trigger the Jumped Data rule.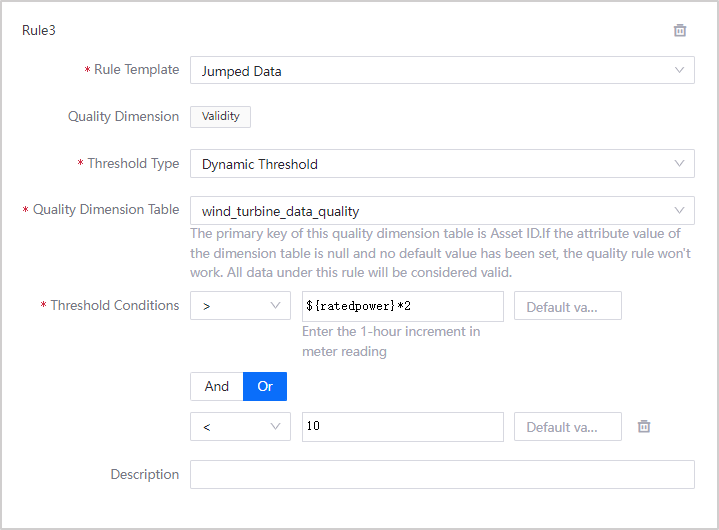
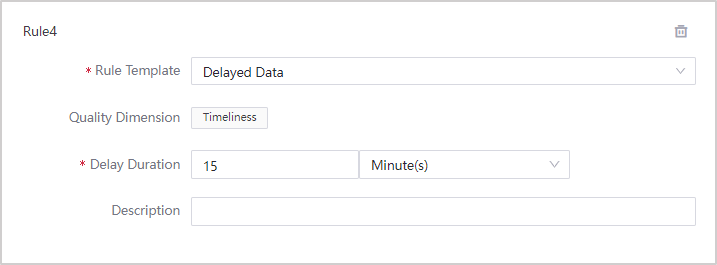
Configure the Delayed Data rule based on the following information to evaluate data quality level from the dimension of Timeliness:
Rule Template:
Delayed DataQuality Dimension:
TimelinessDelay Duration:
15 Minute(s)
Meaning of this rule: If the time when data arrives at EnOS Cloud - Device timestamp > 15 minutes, the data is considered to trigger the Delayed Data rule.
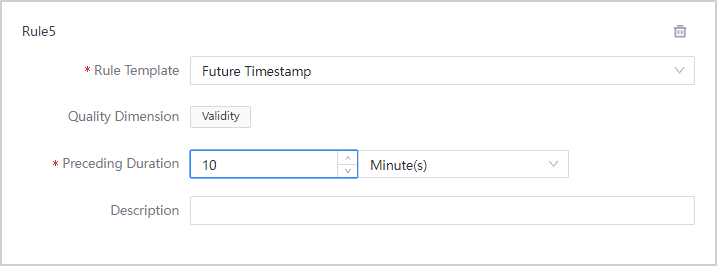
Configure the Future Timestamp rule based on the following information to evaluate data quality level from the dimension of Validity:
Rule Template:
Future TimestampQuality Dimension:
ValidityDelay duration:
10 Minute(s)
Meaning of this rule: If the Device timestamp - The time when the data arrives at EnOS Cloud > 10 minutes, the data is considered to trigger the Future Timestamp rule.
Select OK to complete quality rule creation.
The created quality assessment rules will take effect in about 1 hour. The data that arrives before 01:00 every day will be included in the calculation of the statistical value of the quality dimension based on the configured assessment rules. You can view the data in Dashboard and Report once the statistical calculation is completed.
In addition to the rules configured above, the Stuck Data rule can also be configured for numerical monitoring objects based on the stuck data template.
Step 4: Checking Data Quality
Target Users: Application Users
Environment: EnOS Application Portal
Select Assessment > Dashboard from the left navigation pane.
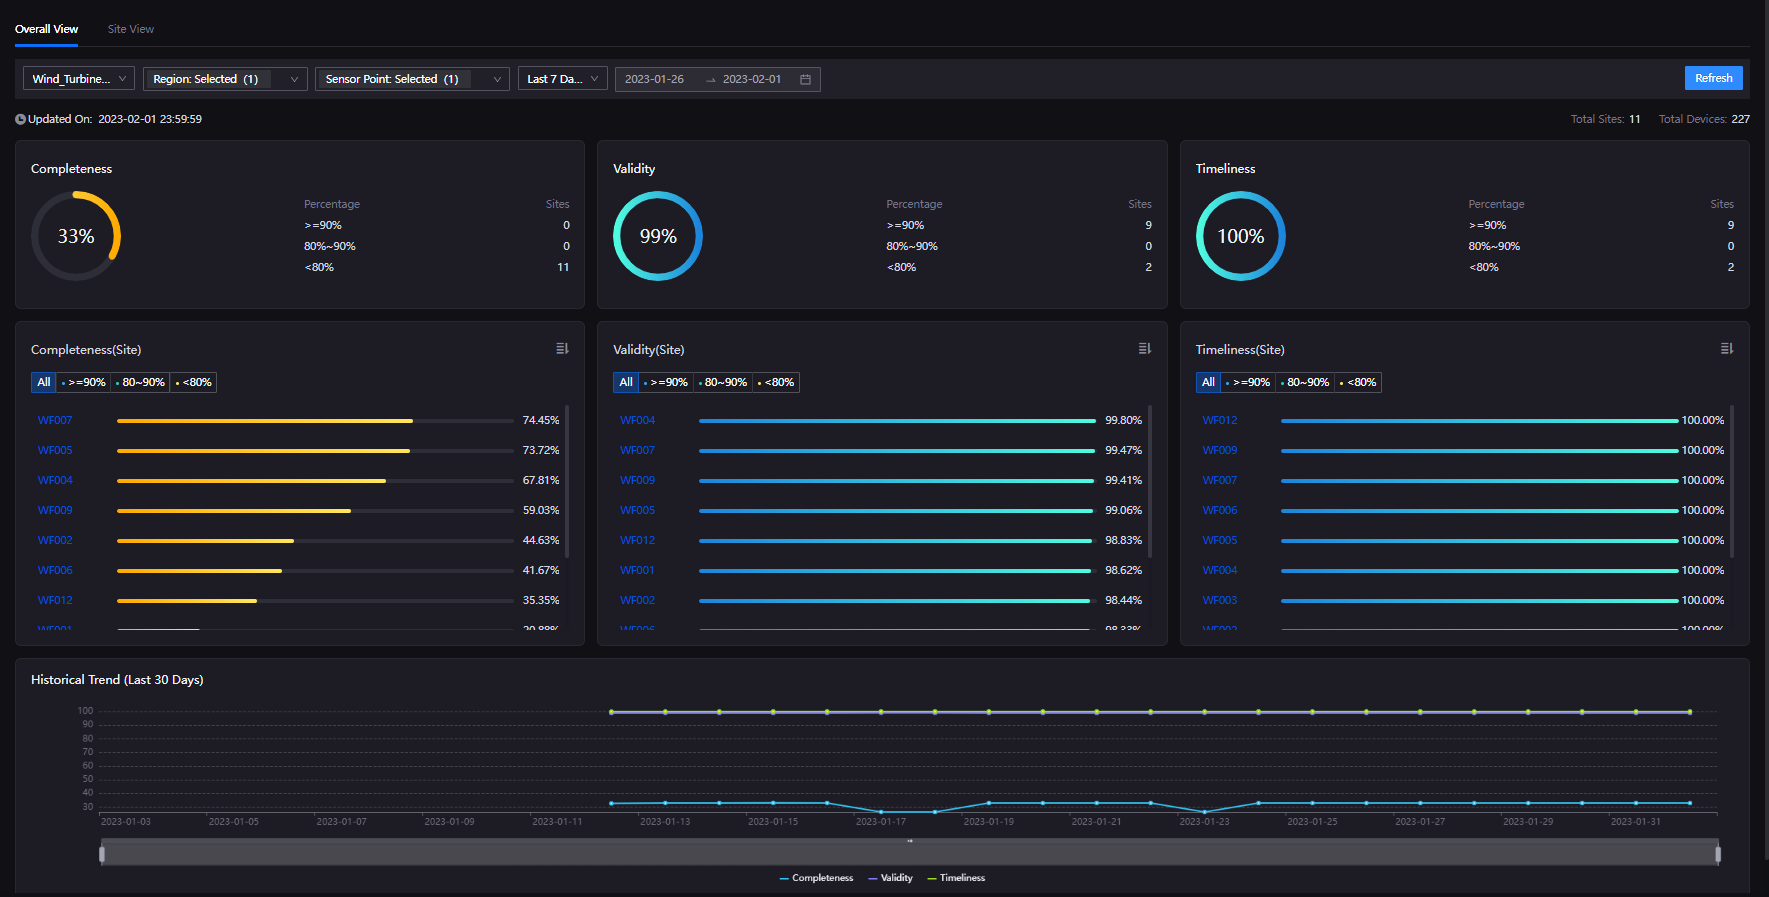
In Overall View tab, select the following information in the filter at the top of the page:
Device Type:
Wind_Turbine_BasicRegion:
Envision-Demo_WindSensor Point:
L1 Point Group-Active Power ProductionTime:
Last 7 Days
Select Refresh at the top right of the page to view data quality of the selected sensor point:
Completeness/Validity/Timeliness: View the completeness rate, validity rate, and timeliness rate of all devices containing the
Active Power Productionsensor point in the selected region.Completeness (Site)/Validity (Site)/Timeliness (Site) and Ranking: View the completeness rate, validity rate, and timeliness rate of the sites containing the
Active Power Productionsensor point, and view rankings of sites for these metrics of the selected region.Historical Trend (Last 30 Days): View data quality trend of changes over the last 30 days.
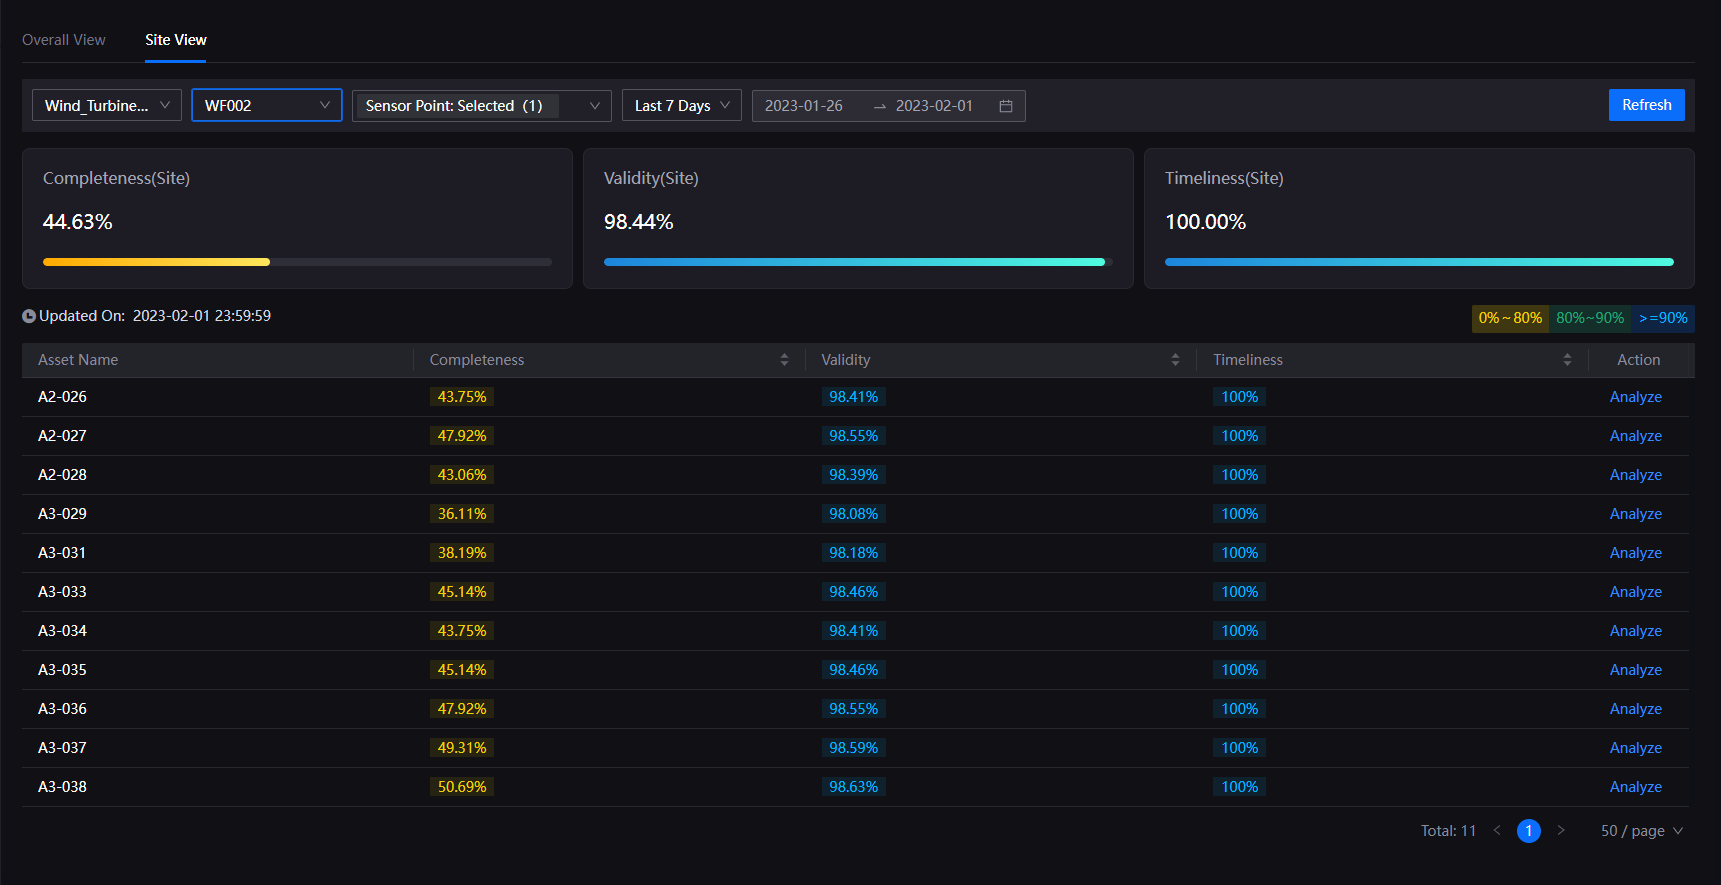
Under Completeness (Site) or Validity (Site) or Timeliness (Site), select the
WF002site to go to the Site View tab.Select Refresh to view the following data quality information in Site View:
Completeness (Site)/Validity (Site)/Timeliness (Site): View the completeness rate, validity rate, and timeliness rate of the selected sensor points under the
WF002site.Device data details list: View the completeness rate, validity rate, and timeliness rate of the devices containing the
Active Power Productionsensor point of theWF002site.
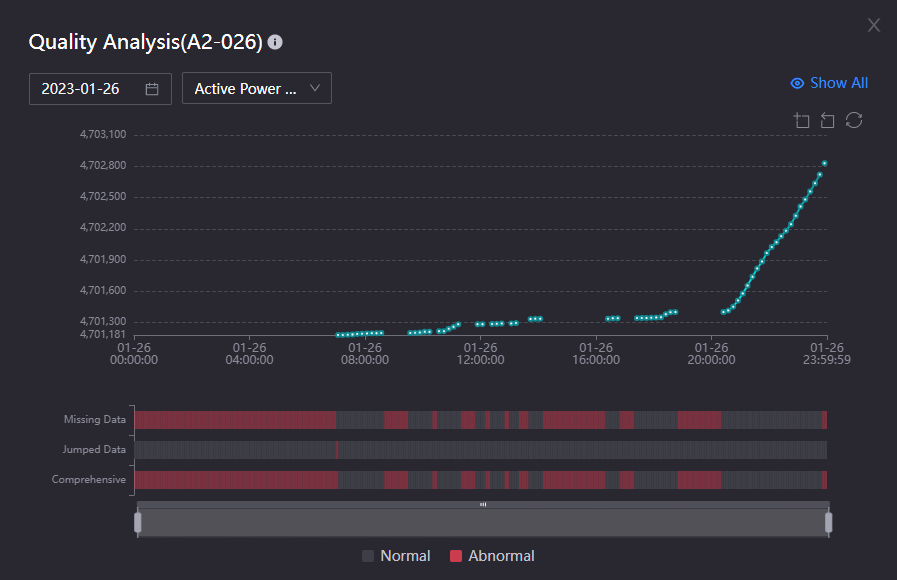
At the end of the
A2-026device row, select Analyze to view the device data quality analysis graph:The quality bar below the quality analysis graph shows whether the real-time data sent by the device in the current period is normal.
The green curve in the quality analysis graph is composed of data sent by the device, configured with the TSDB storage strategy, and stored in EnOS Time-Series Database. For more information on storage policies, see Storage Policy for EnOS Cloud Users.
Step 5: Checking/Downloading Data Quality Reports
Target Users: Application Users
Environment: EnOS Application Portal
In addition to viewing the overall data quality levels in the quality dashboard, you can also follow the steps below to query and download the quality report that covers multiple dimensions, sensor points, and periods to gain a complete understanding and control of data quality.
Select Assessment > Report from the left navigation pane.
Select the following information in the filter at the top of the page:
Device Type:
Wind_Turbine_BasicDimension:
Region-Site-AssetEquipment:
Envision-Demo_Wind-WF02Sensor Point:
L1 Point Group-Active Power ProductionTime:
WeekDate:
Day
Select Query at the top right of the page to view data quality report under the current filter item.
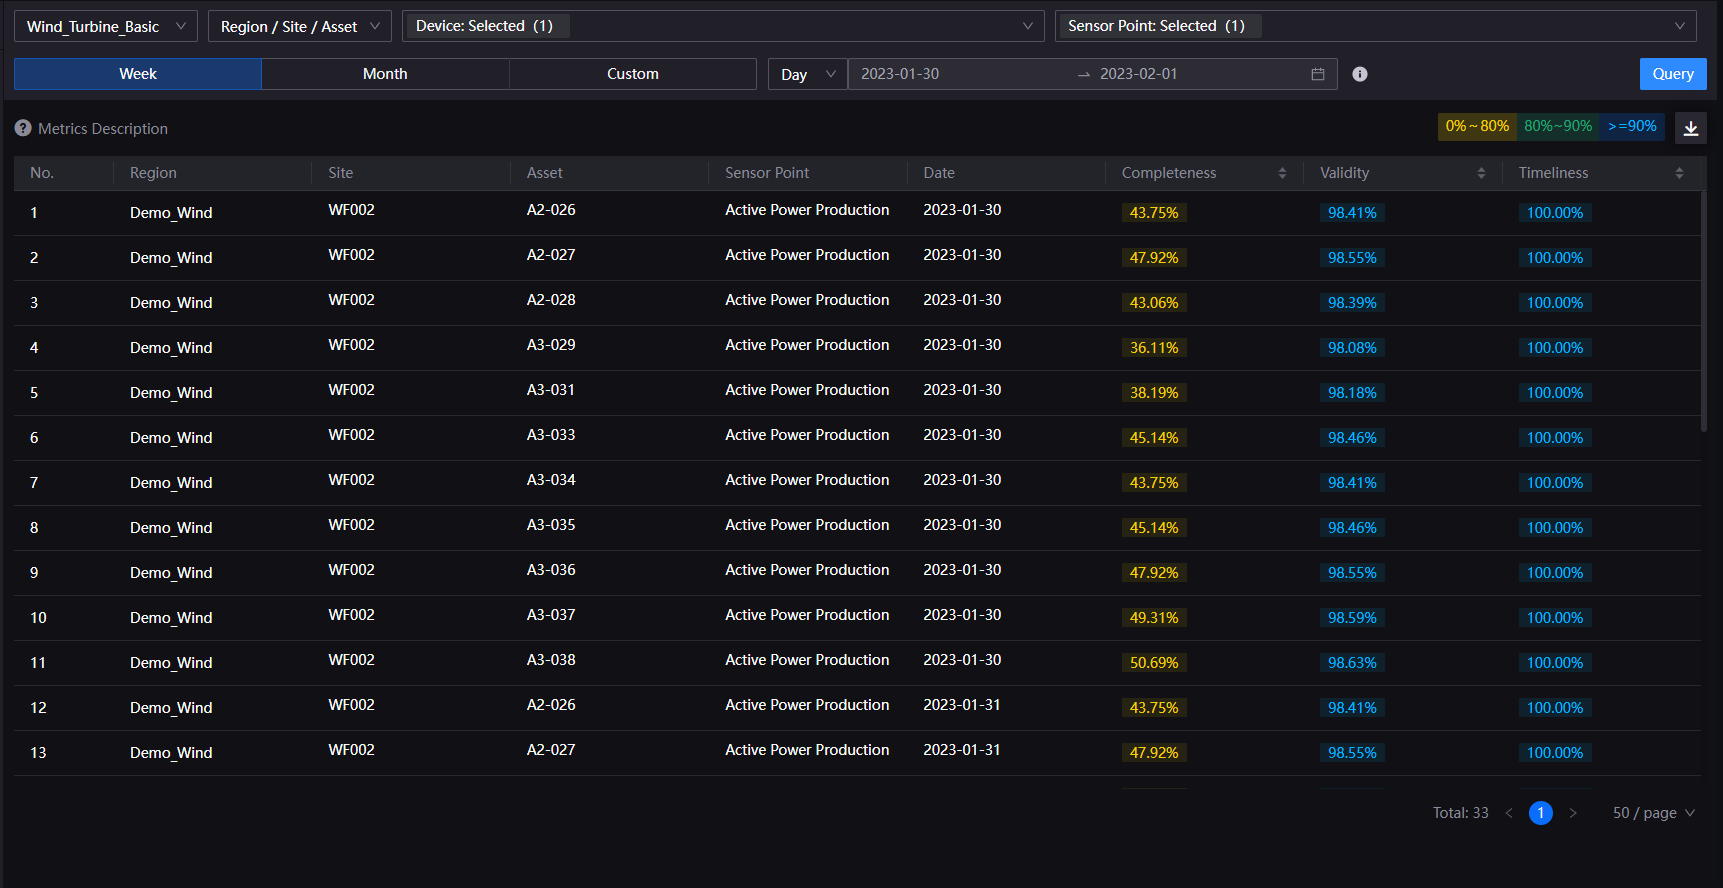
Select the download icon
 at the top right of the page to download the report.
Results
The quality dashboard and quality report allow application users to accurately appraise data quality of devices of regions and sites from multiple dimensions and take steps to rectify devices that are performing badly.