FAQ
Dashboard - Quality Analysis Curve
Note
In the quality analysis curve graph, the curve data composed of blue dots are data configured with the TSDB storage strategy and stored in EnOS Time Series Database; the data of the quality bar in the bottom of the pop-up window is the real-time data sent by the device. For more information on storage policies, see Storage Policies (EnOS Cloud Users).
When the storage type of the data in TSDB is AI Raw Data, DI Data, or Generic Data, the upper curve will correspond exactly to the lower quality bar.
When the storage type of the data in TSDB is AI Normalized Data or PI Data, due to the normalization processing in TSDB storage, the data displayed by the curve will not be the raw data of devices, and there may be a discrepancy between the curve and the results displayed on the quality bar.
Q: In the following graph, the quality bar of Missing Data displays normally, but no data appears in the curve graph. Similar questions: Quality bars of Jumped Data and Stuck Data display normally, but no data appears in the curve.
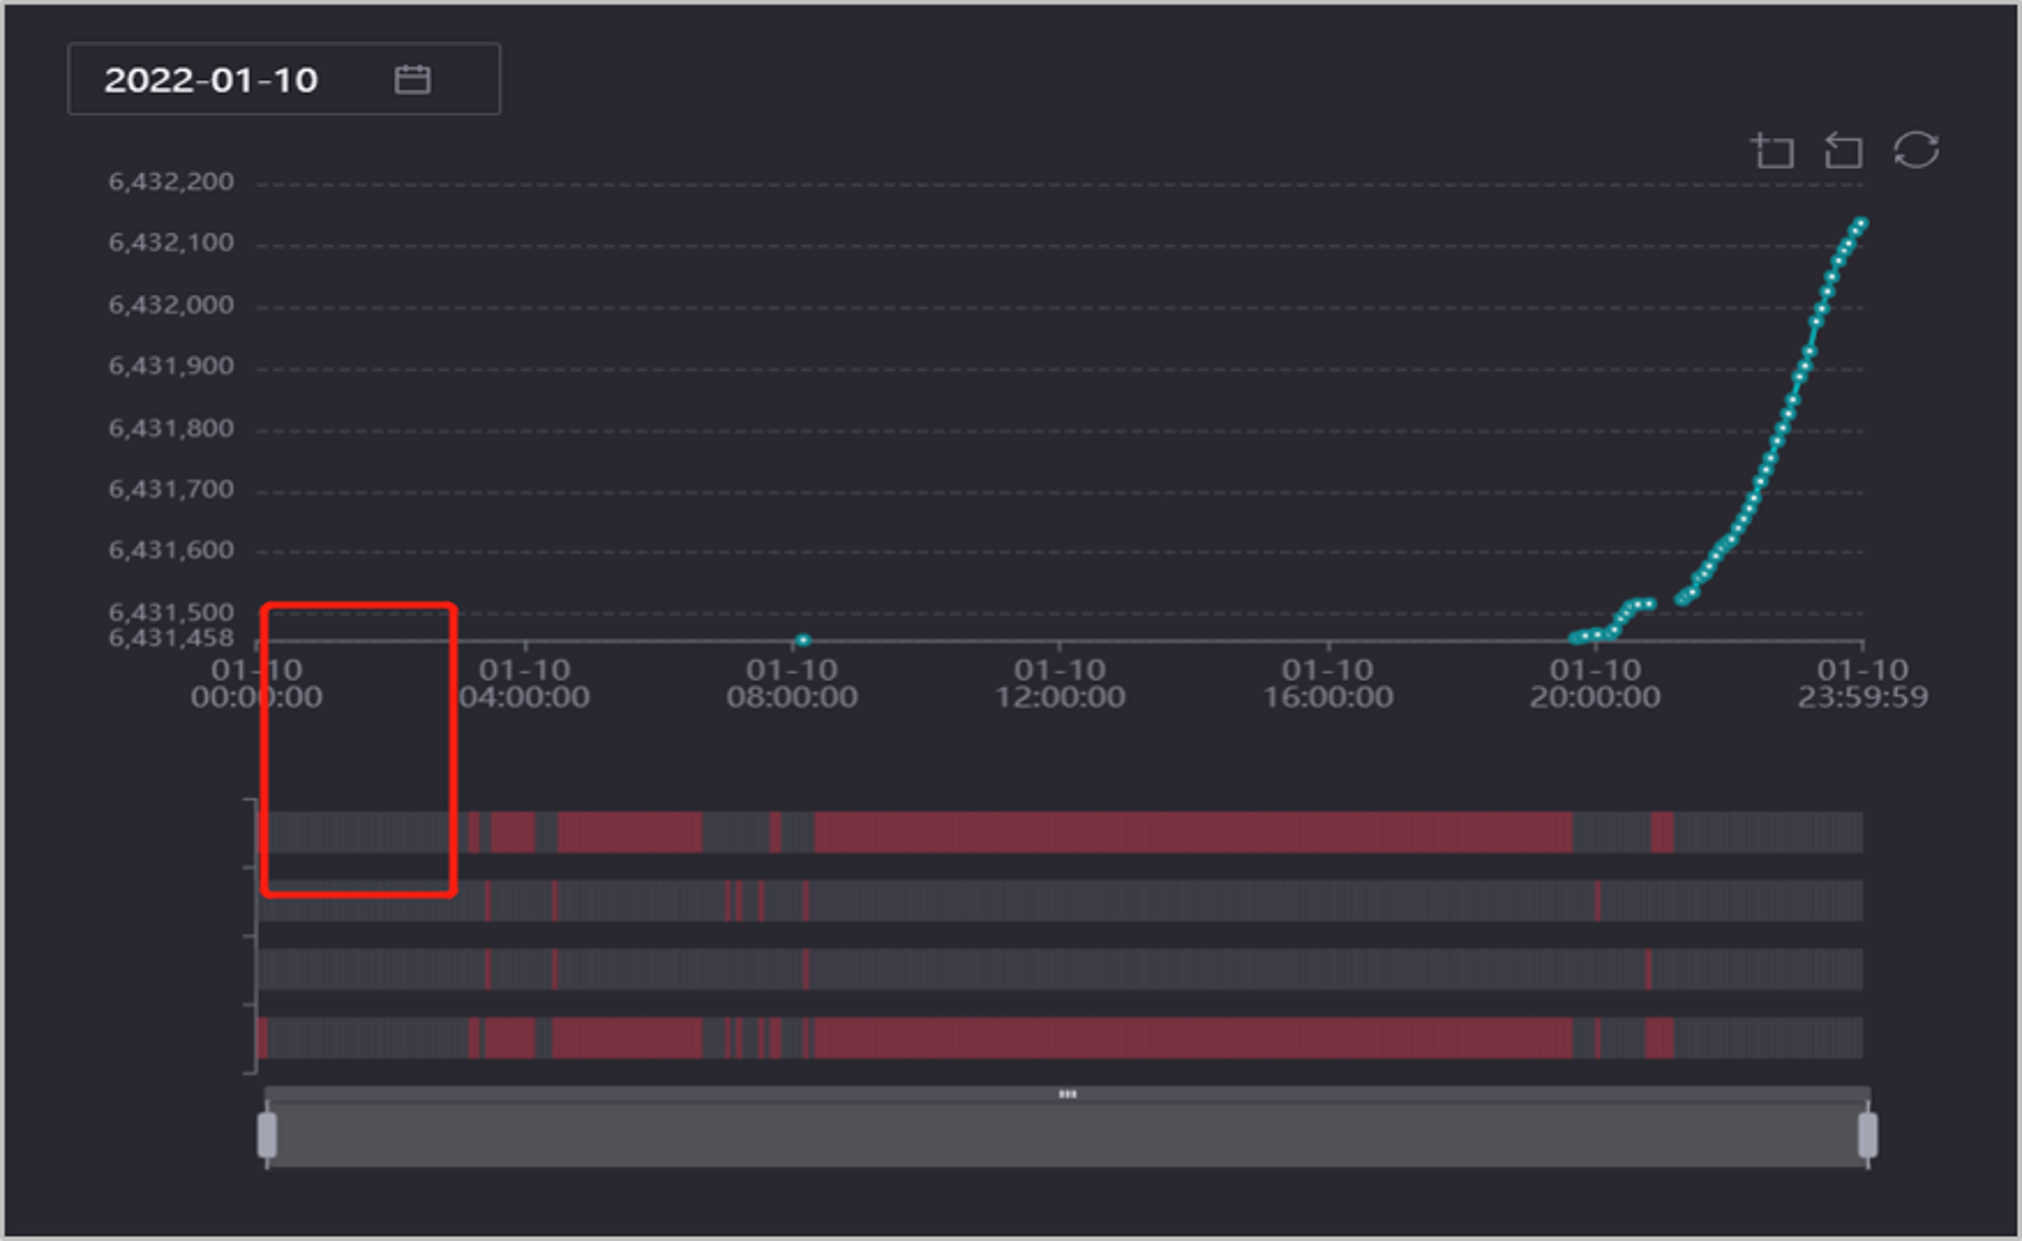
A: The quality analysis curve only displays the data stored in TSDB (the data stored in TSDB may be normalized), while the quality bar shows the monitoring results of the real-time data sent by the device. Therefore, there will be inconsistencies between the quality analysis curve and the results displayed in the quality bar.
Q: The quality analysis curve displays normally (no stuck data displayed in the curve),but the quality bar of Stuck Data displays abnormally.
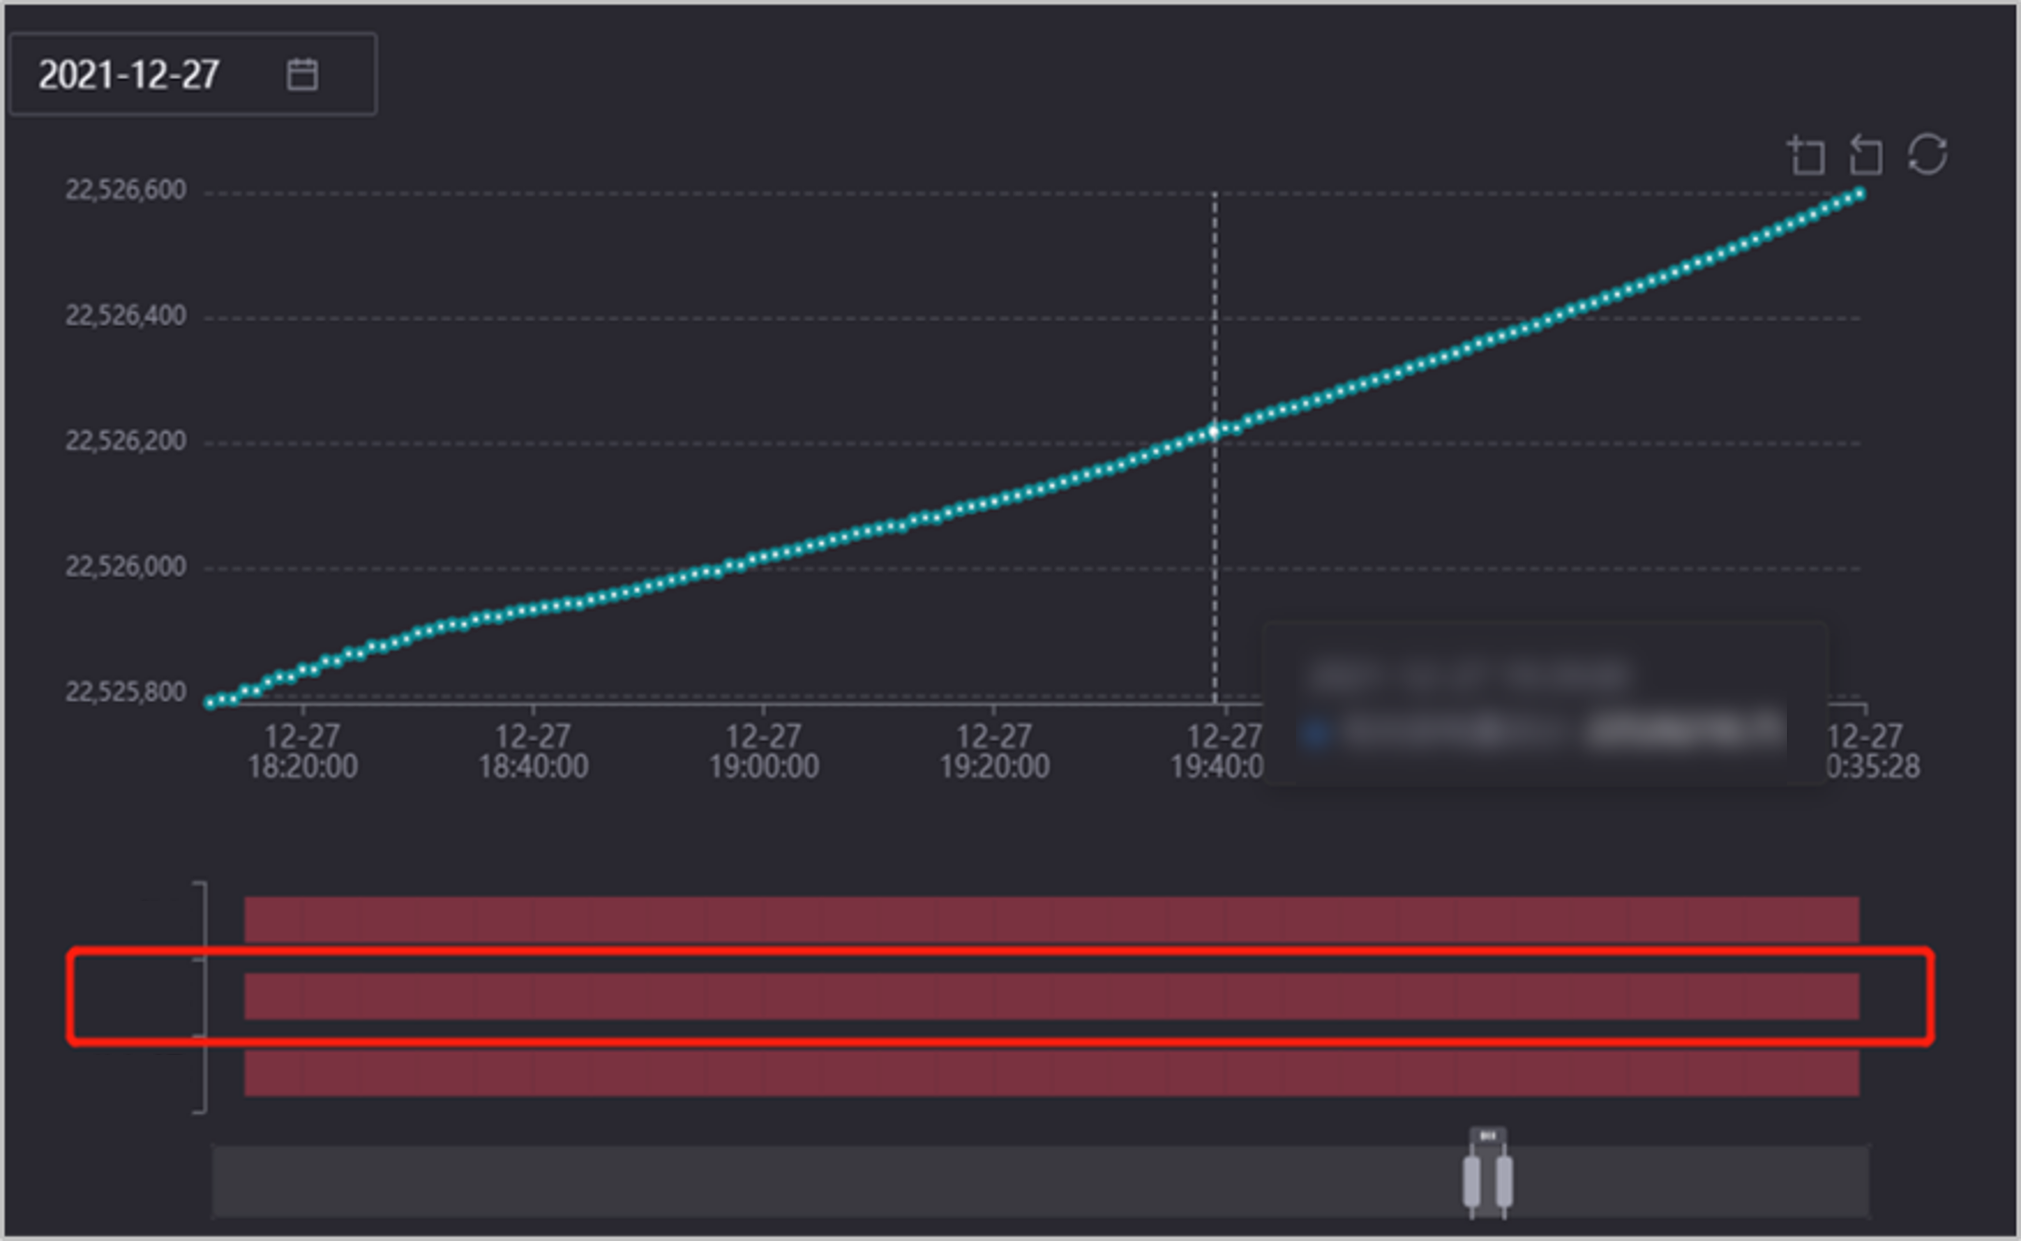
A: Multiple data with the same value are uploaded at the same time, the data backlog causes the exceptions in the quality bar of Stuck Data. In other words, the quality analysis curve only “looks” normal, but at each time point, there may be multiple numerical points completely overlapping, resulting in a seemingly normal numerical point.
Q: The data displays in the quality curve, but the corresponding quality bar of Missing Data displays abnormally.
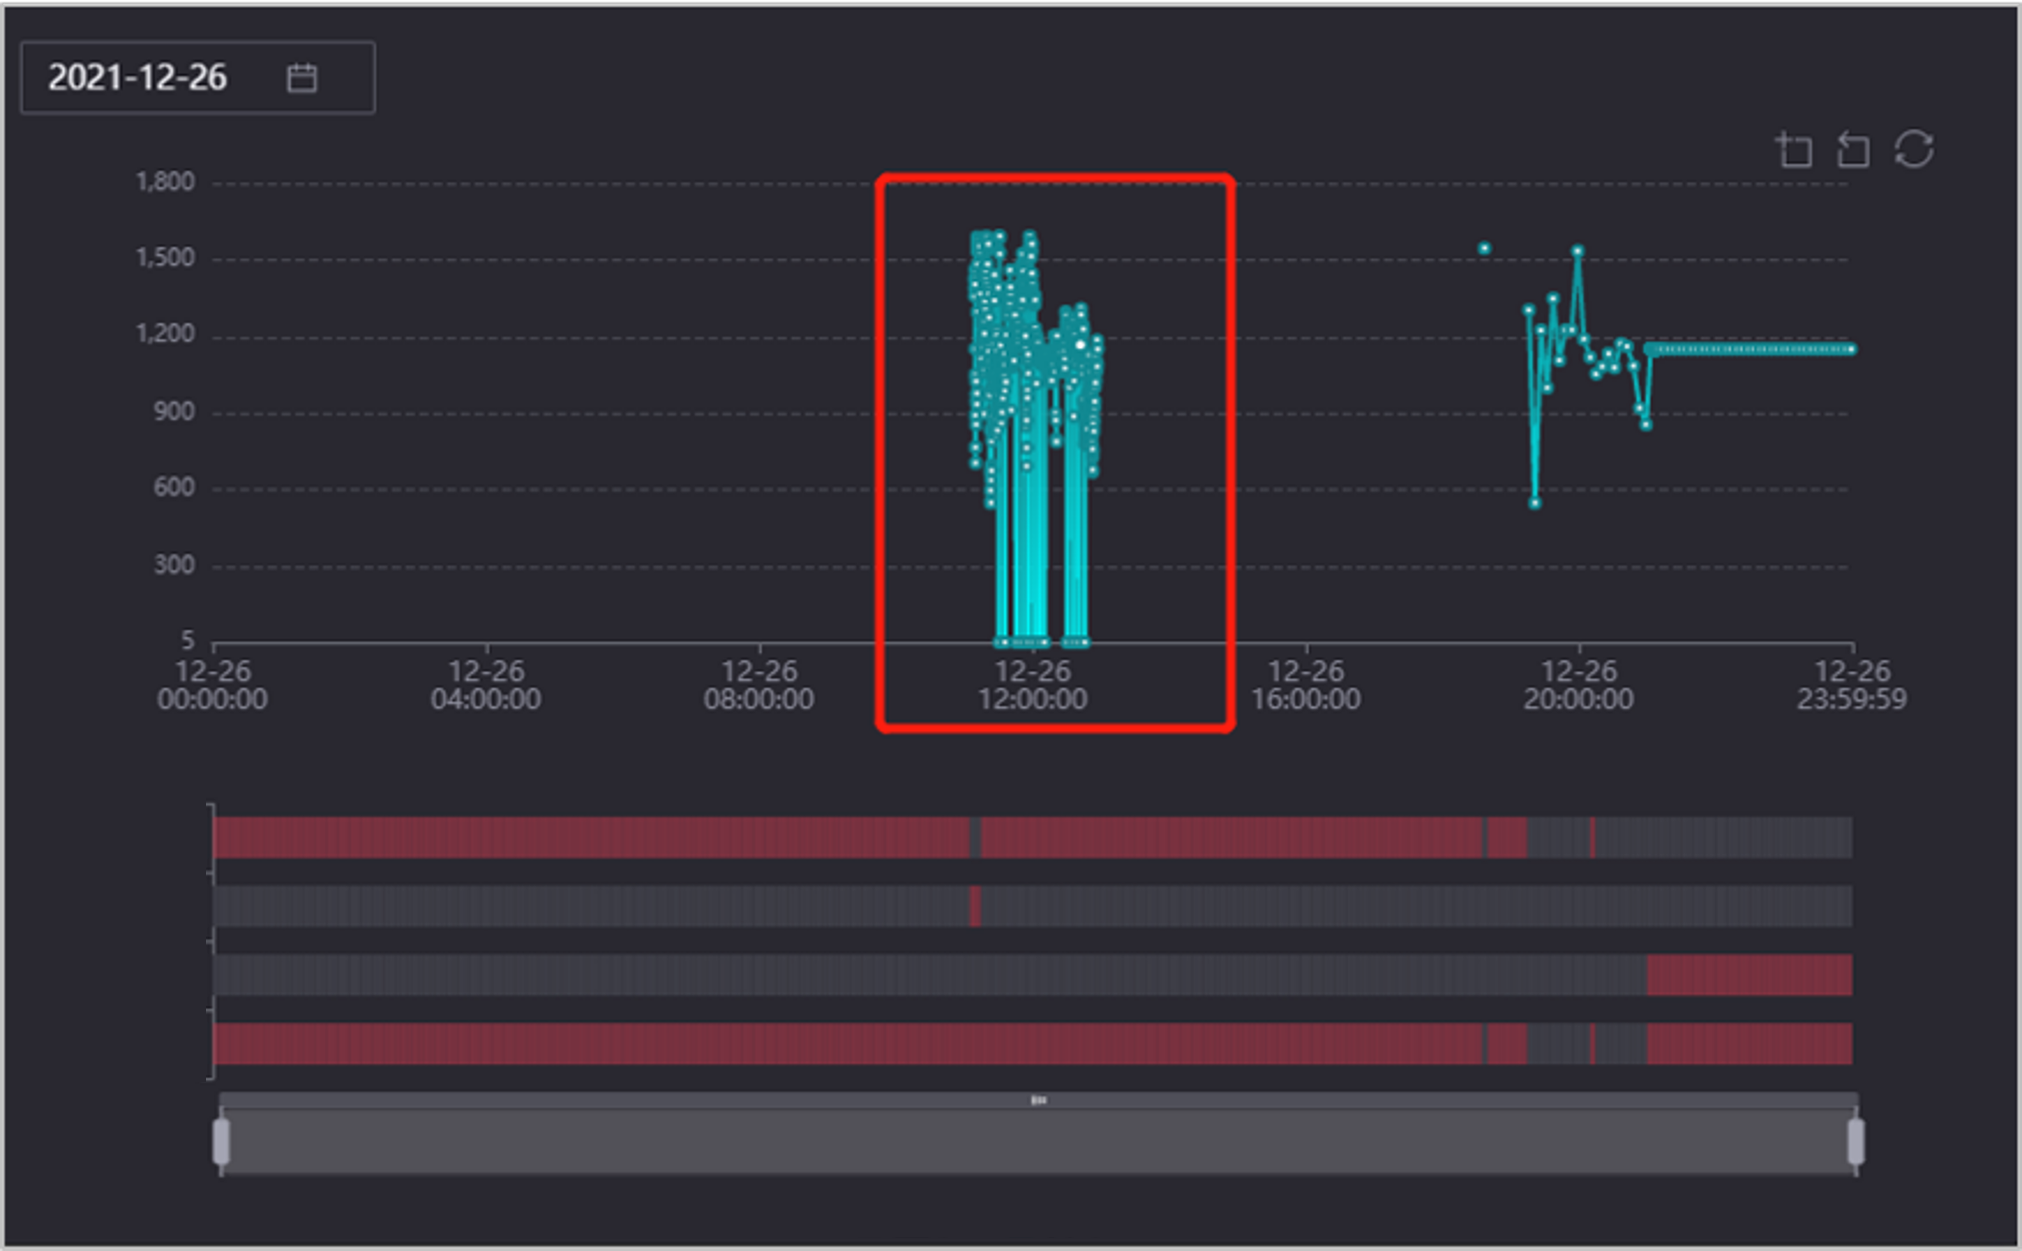
A: The calculation logic of real-time data monitoring in EnOS Data Quality is that the data arriving after 01:00 every day will not be included in the statistical calculation. The timestamp of the device data shown on the graph is around 12:00 on December 26, 2021, but the data may arrive later than 01:00 on December 27. In this case, the data will not reflect in the real-time monitoring quality bar but will still store in the TSDB and display in the curve.