Checking Site View
Site View allows you to view data quality of the site and devices of the site.
Prerequisites
Before starting, make sure the user account has been assigned the required asset permissions and a menu group including Dashboard. If not assigned, contact the application administrator.
Procedure
Select Assessment > Dashboard from the left navigation pane, after which you will enter the Overall View tab by default.
Select Site View at the top of the page to switch to the Site View tab.
You can quickly filter target data based on the following filters.
Filter
Description
Note
Device Type
Select a device type that needs to be viewed in the device type drop-down list.
If the device type you want to select is not in the drop-down list, contact the asset administrator.
Site
Select a site that contains the selected device type under the current region in the site drop-down list.
None
Sensor point
Select the groups and sensor points under the current device type in the sensor point drop-down list.
The sensor point is the monitoring object.
The parent level of the sensor point group can be expanded. If the parent level is checked, all sensor points under the parent level are automatically selected.
Contact the asset administrator to configure groups and sensor points.Time
Quickly select
YesterdayorLast 7 Daysin the time drop-down list.
If you selectCustom, you will need to further select the Start date and End date.You can select and view up to 31 days of data quality from the last year.
Select Refresh at the top right of the page to view completeness, validity, and timeliness of the device data.
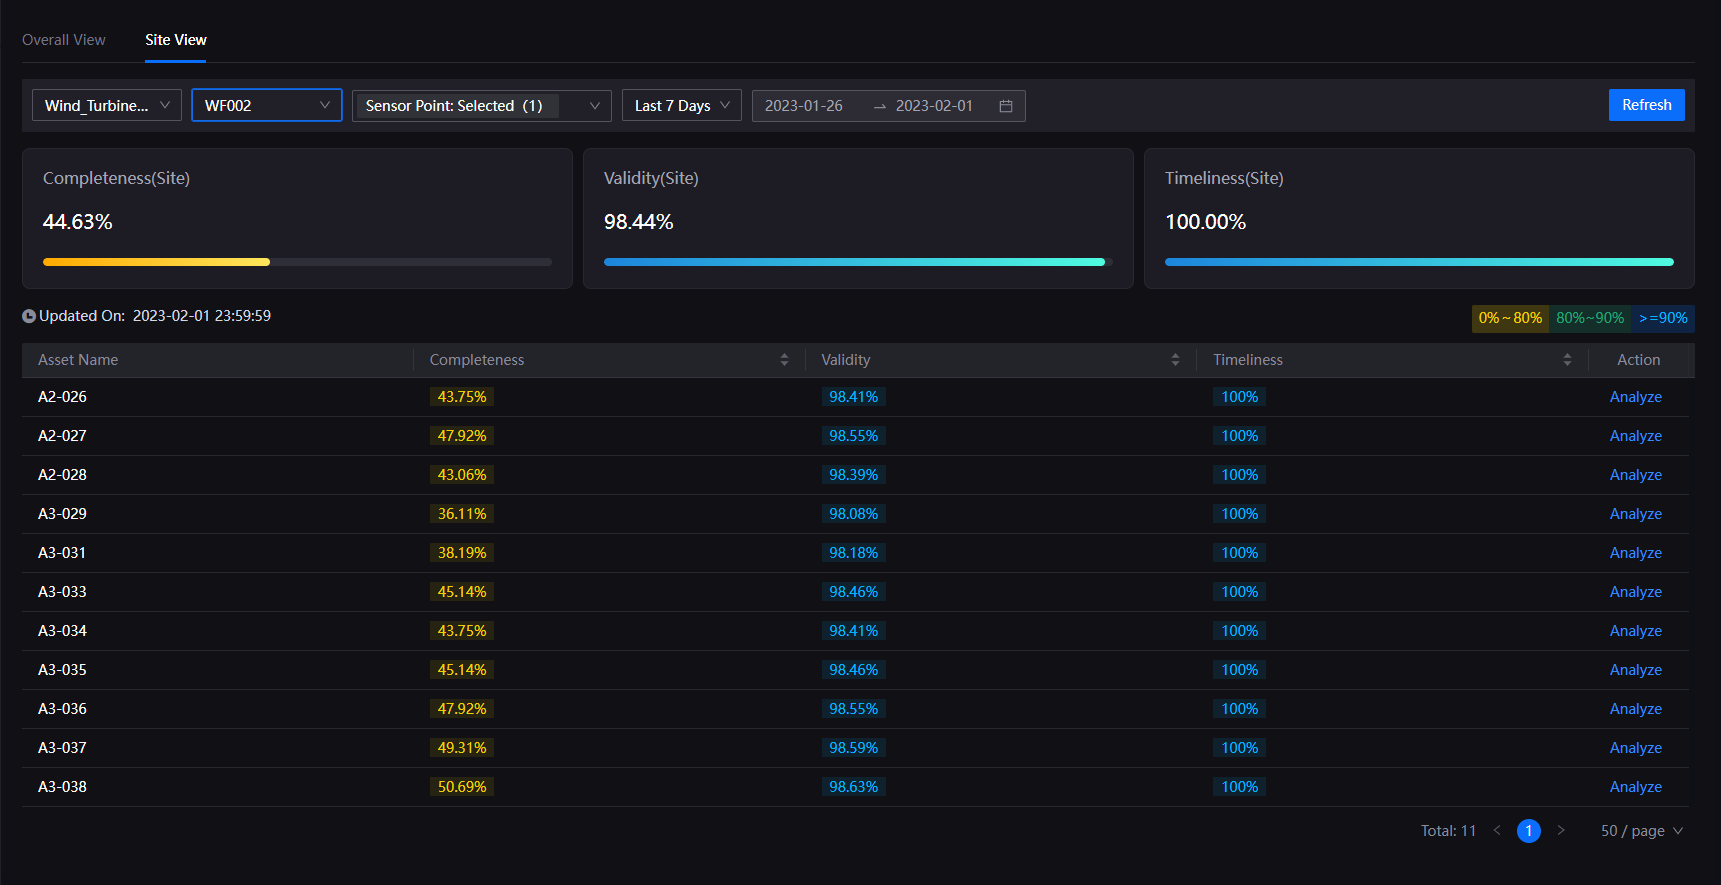
To learn more about the concepts and calculation of completeness, validity, and timeliness, see Quality Dimensions and Data Quality Metrics.
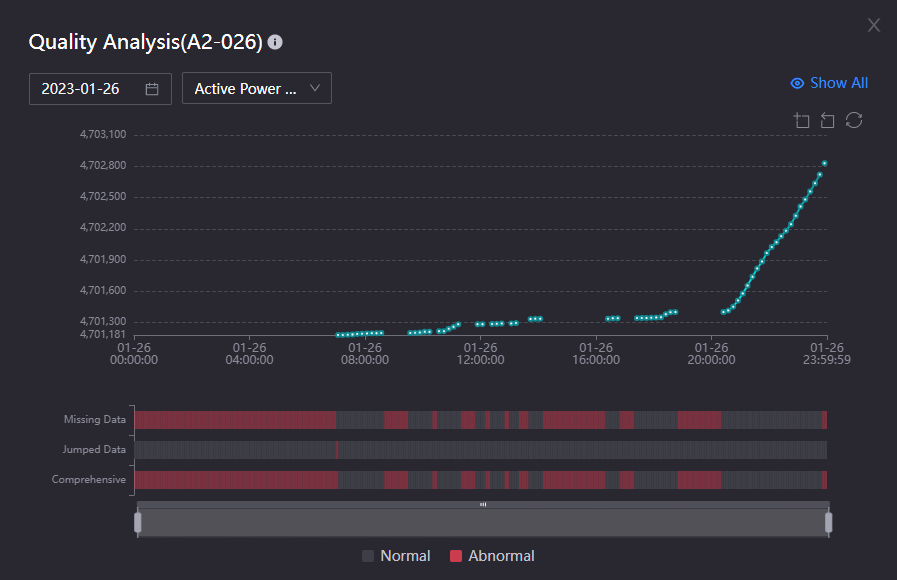
To view an analysis graph of data quality for a device, select Analysis at the end of the device row and the following operations can be done:
In the filter box of the pop-up window, select the time and the measurement point under the current device.
Hover the mouse over the graph made of blue dots to view the measurement point data of the device at a time interval of 5 minutes.
Average Quality under the quality analysis graph indicates the average data quality of the uploaded data configured with assessment rules.
Select Show All Quality Details at the top right of the quality analysis graph to view all assessment rules configured for the measurement point of the device.
Select Non-Problematic Quality Details to hide quality assessment rules that have no quality issues.
Move and zoom in or out the time window below the quality analysis graph, or select a region in the graph to zoom in and view after selecting Zoom in
 .
.
Note
In the quality analysis curve graph, the curve data composed of blue dots are data configured with the TSDB storage strategy and stored in EnOS Time Series Database; the data of the quality bar in the bottom of the pop-up window is the real-time data sent by the device. For more information on storage policies, see Storage Policies (EnOS Cloud Users).
When the storage type of the data in TSDB is AI Raw Data, DI Data, or Generic Data, the upper curve will correspond exactly to the lower quality bar.
When the storage type of the data in TSDB is AI Normalized Data or PI Data, due to the normalization processing in TSDB storage, the data displayed by the curve will not be the raw data of devices, and there may be a discrepancy between the curve and the results displayed on the quality bar.