What’s New in 2.4.4?
This section introduces the new services and features included in EnOS 2.4.4.
Application Building
Application Portal
OU administrators can now edit the name, phone number, and account expiration of SSO users in this OU.
EnOS Mobile
Application creators can now enable multi-factor authentication(MFA) for EnOS Mobile to improve account security.
Digital Twin Visualization
Application creators can now perform the following operations:
Define datasets and their combination parameters for data sources to group the data together by business scenario.
Edit component templates within the projects where they have permissions.
Set the Effect Sum aggregation method for the widget data. During aggregation, missing data will be automatically ignored to ensure accurate results.
Set a Clear button for global filters and widget filters to improve user efficiency.
Unified Monitoring
Application creators can now perform the following operations:
Set one of the following dimension filter style in Portfolio:
Grid Dropdown
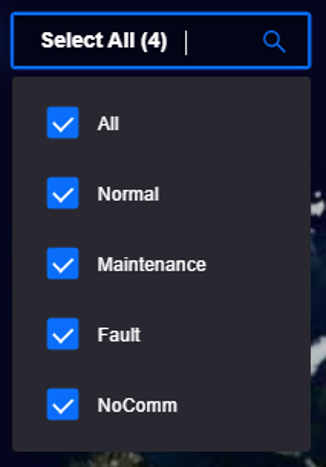
Grid Button

Compact Button

Set the background style of the Portfolio canvas to either Solid Color or Frosted Glass.
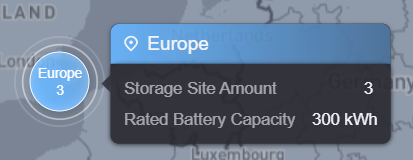
For the administrative map in the Portfolio, set the background and default color to Gray, set the aggregation style of assets to Bubble, and customize the data that can be displayed in the bubble popup.
Set the heat map color in the Portfolio to Gray. Display data by heat map in the geographical map, where you can display the data of the ranking widget or add custom data.
Set a main filter for the Portfolio, and determine whether the other filters and the asset popup’s displayed data are affected by the main filter.
Configure the data items of different asset types in the asset details popups for each single-domain Portfolio page. Set the hyperlink and jump method for each data item in the site details popup.
Hide the site nodes in the Portfolio and Unified Asset Tree. The page will only display the asset data at the group and region levels.
Add a batch operation button in the Asset List, where you can configure the operation condition and interaction action for operating multiple sites/devices simultaneously. For example, configure a button that navigates to the control log page for solar sites, so that users can view the control log list of all solar sites with one click.
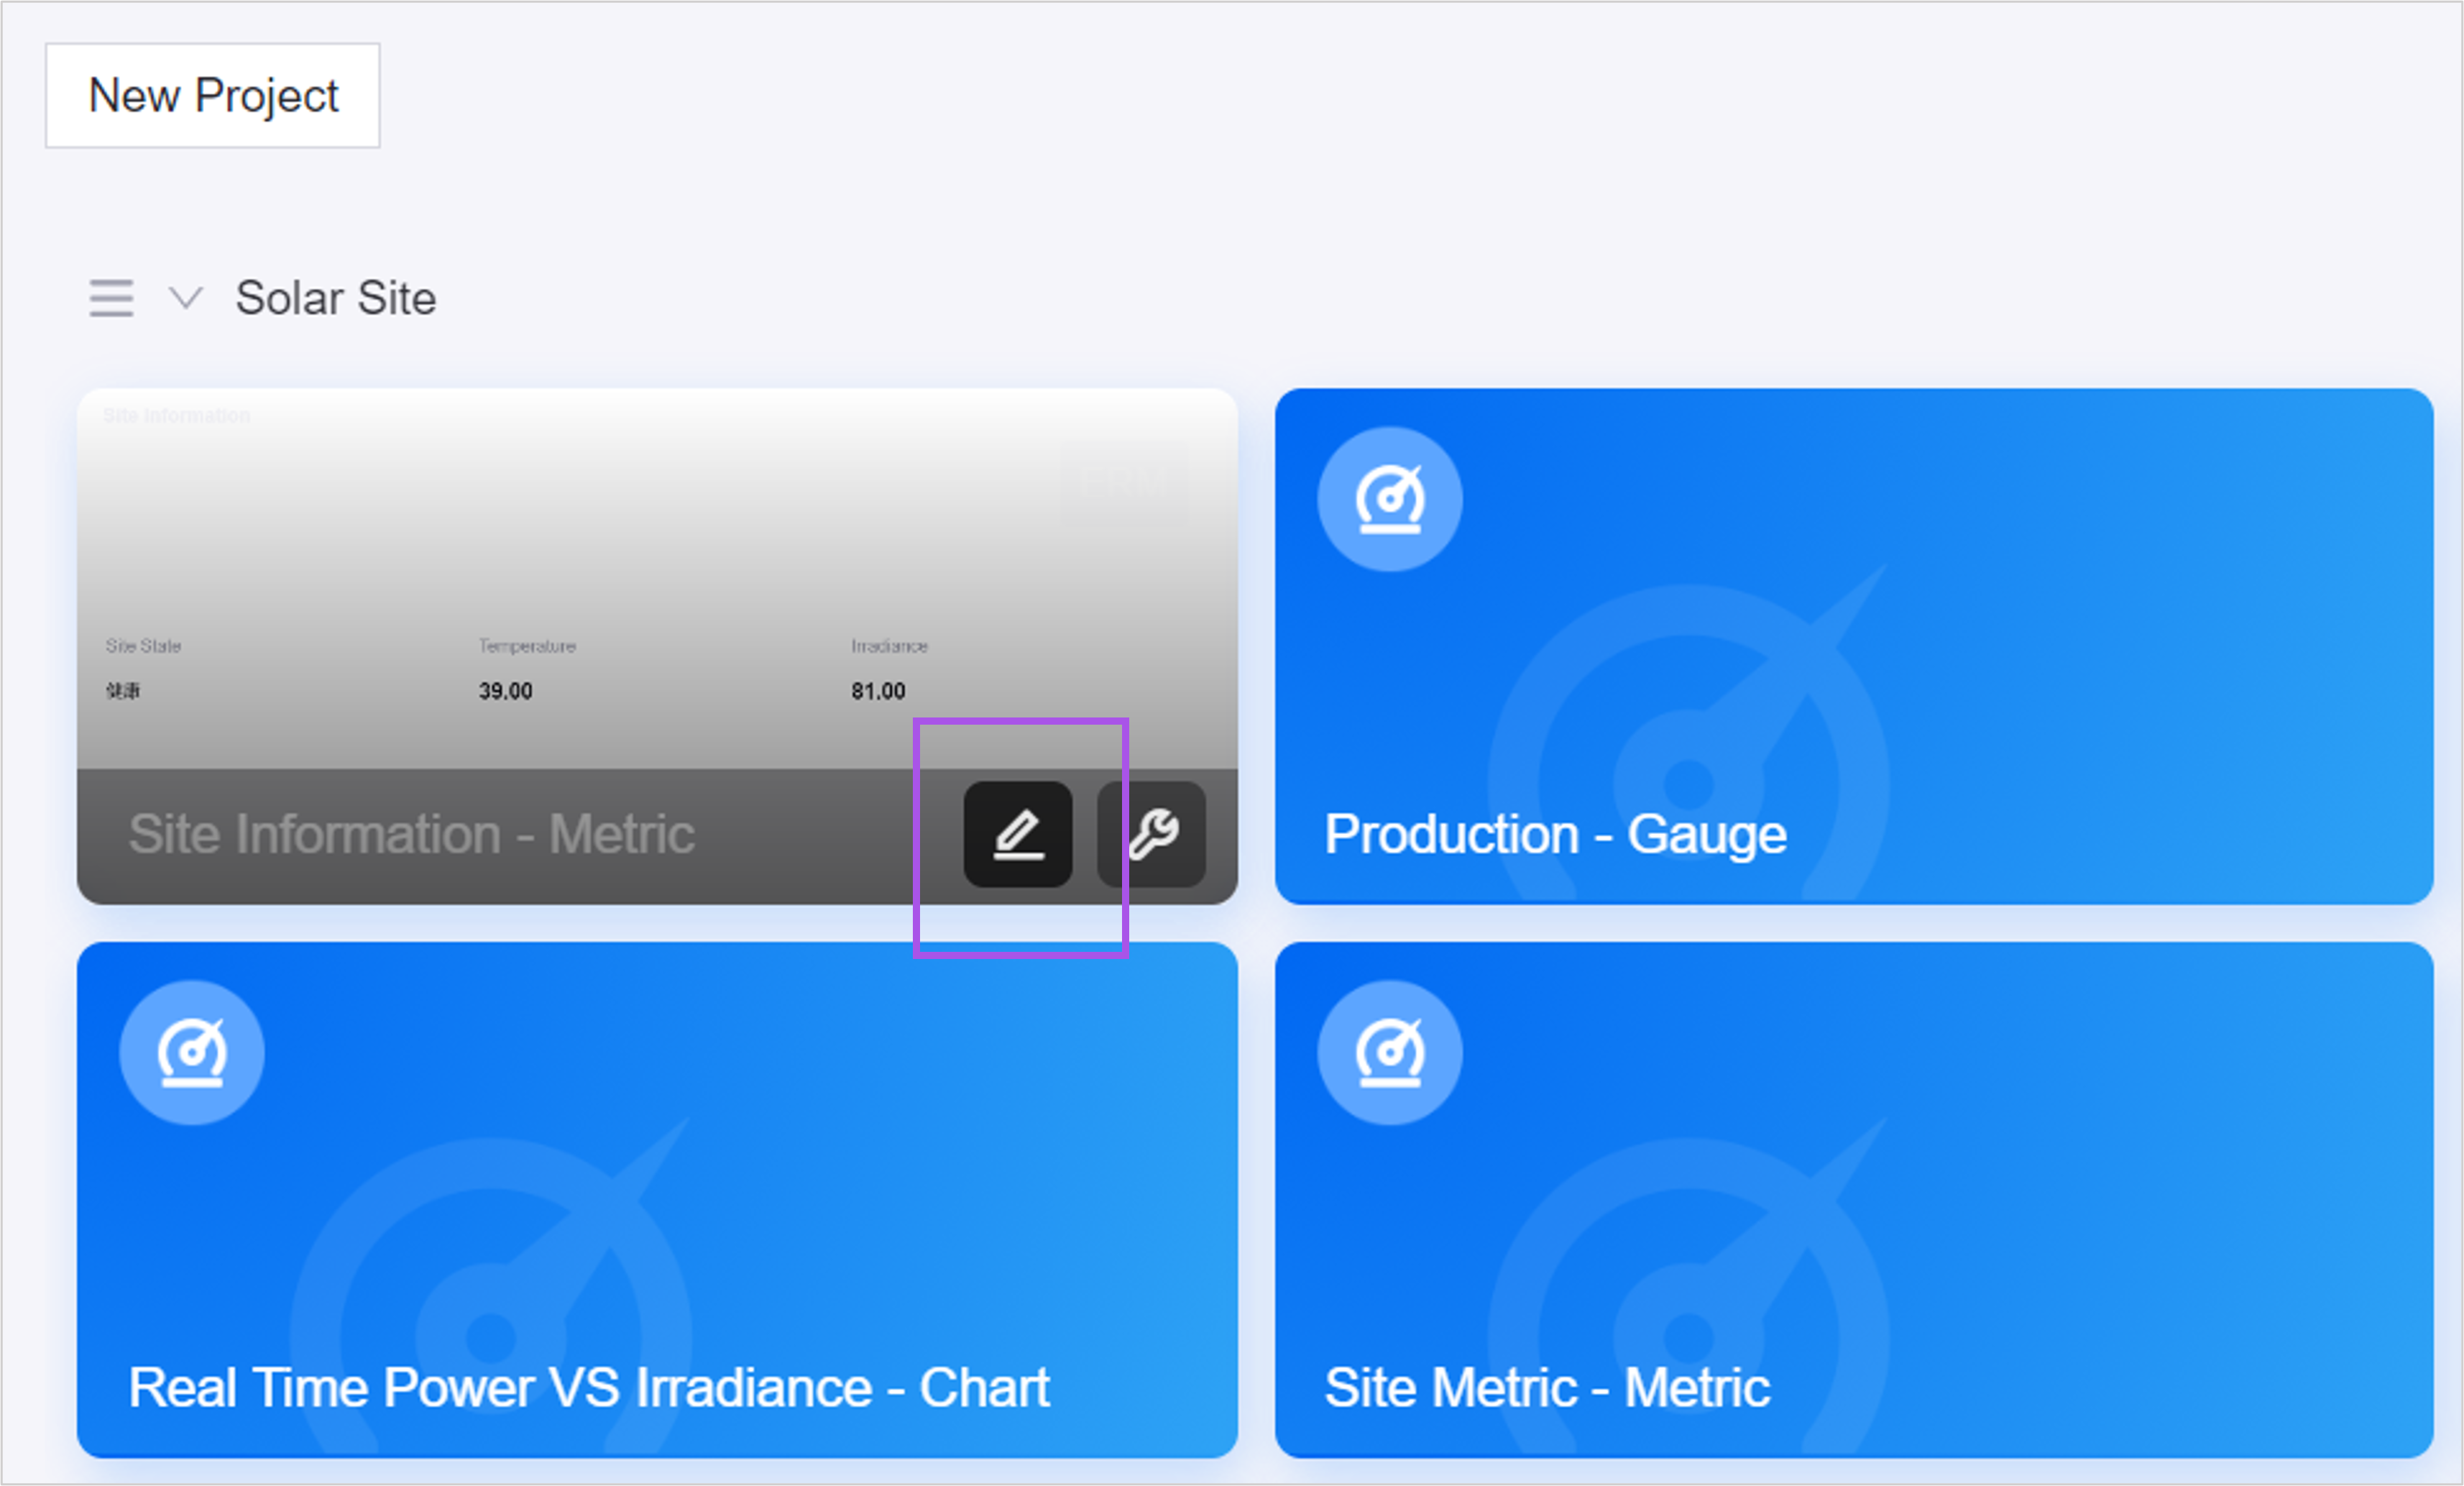
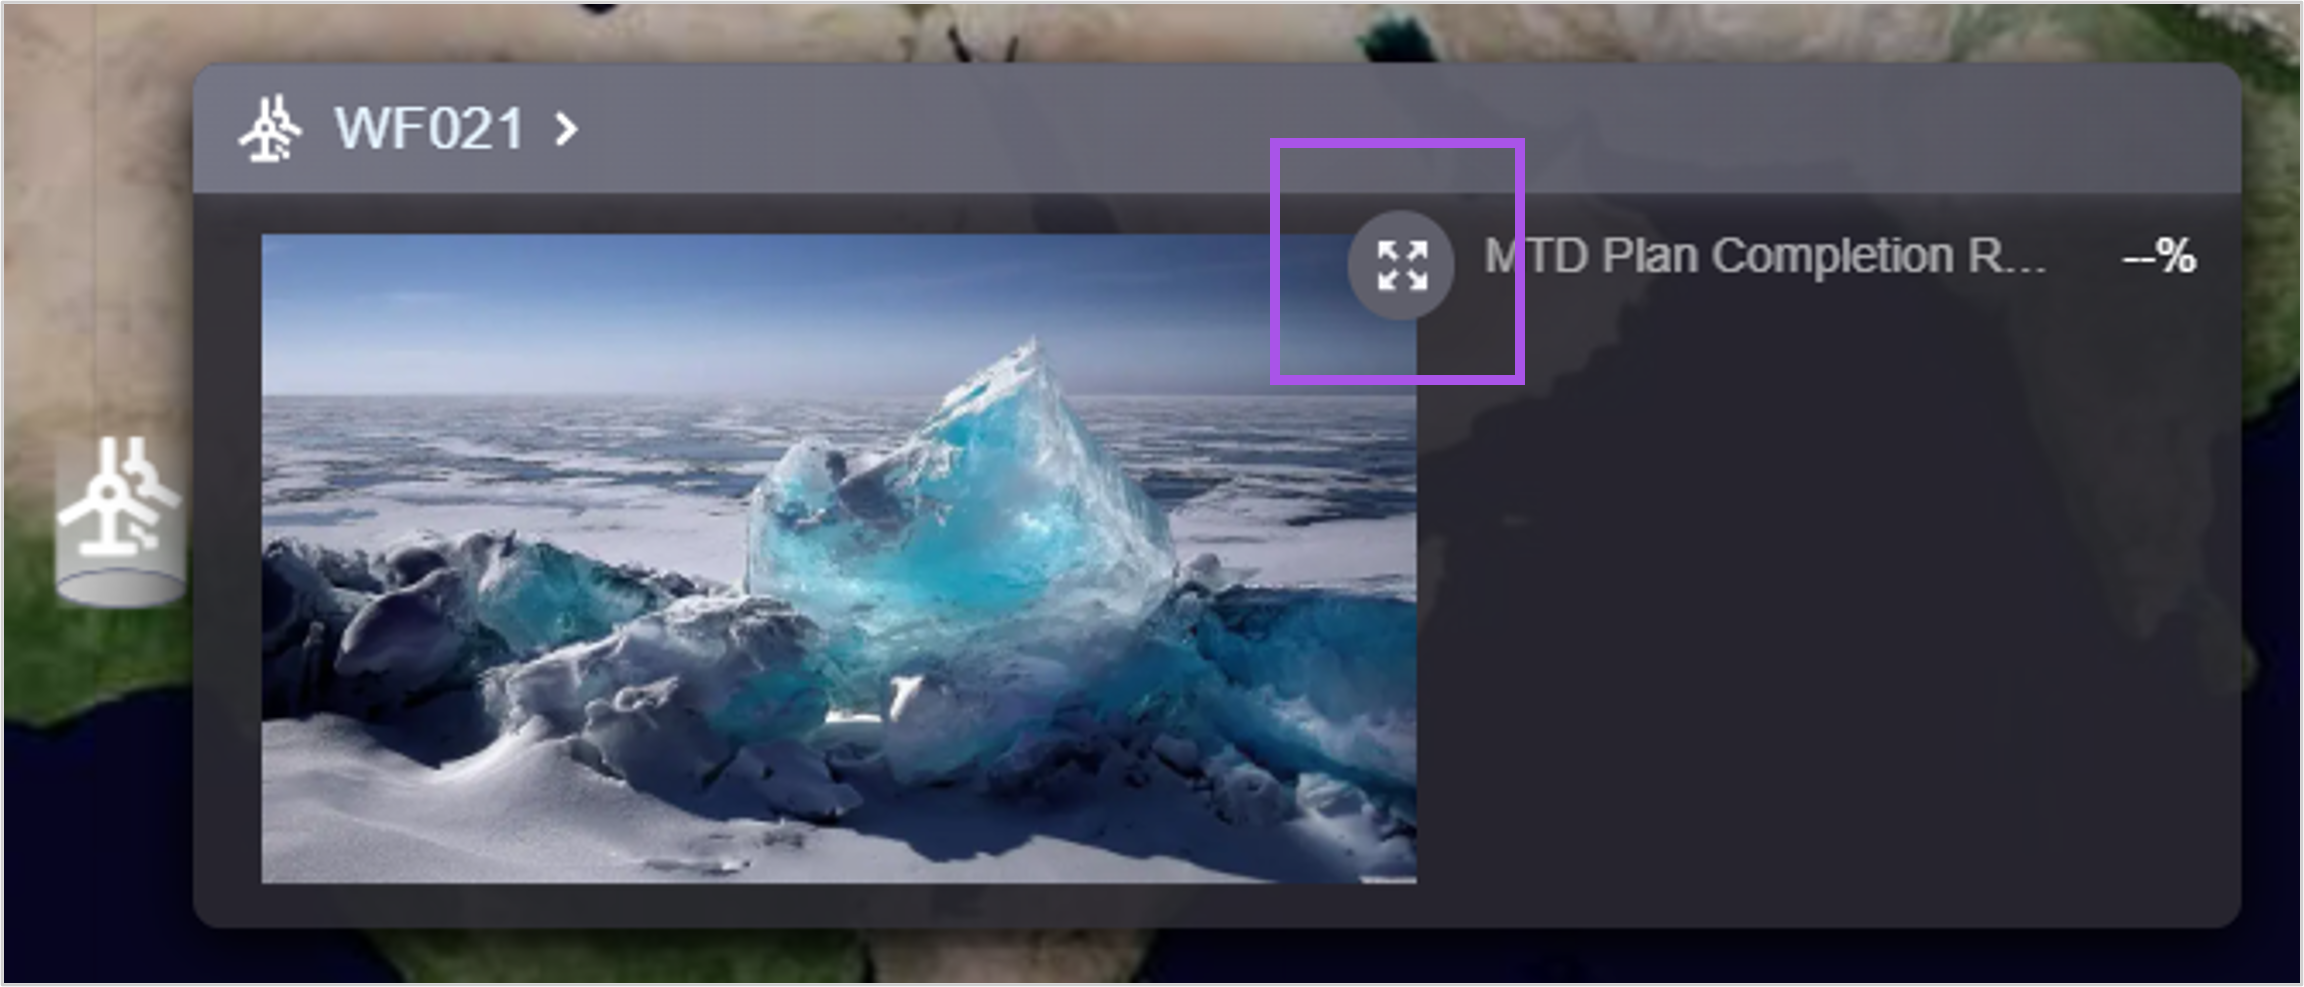
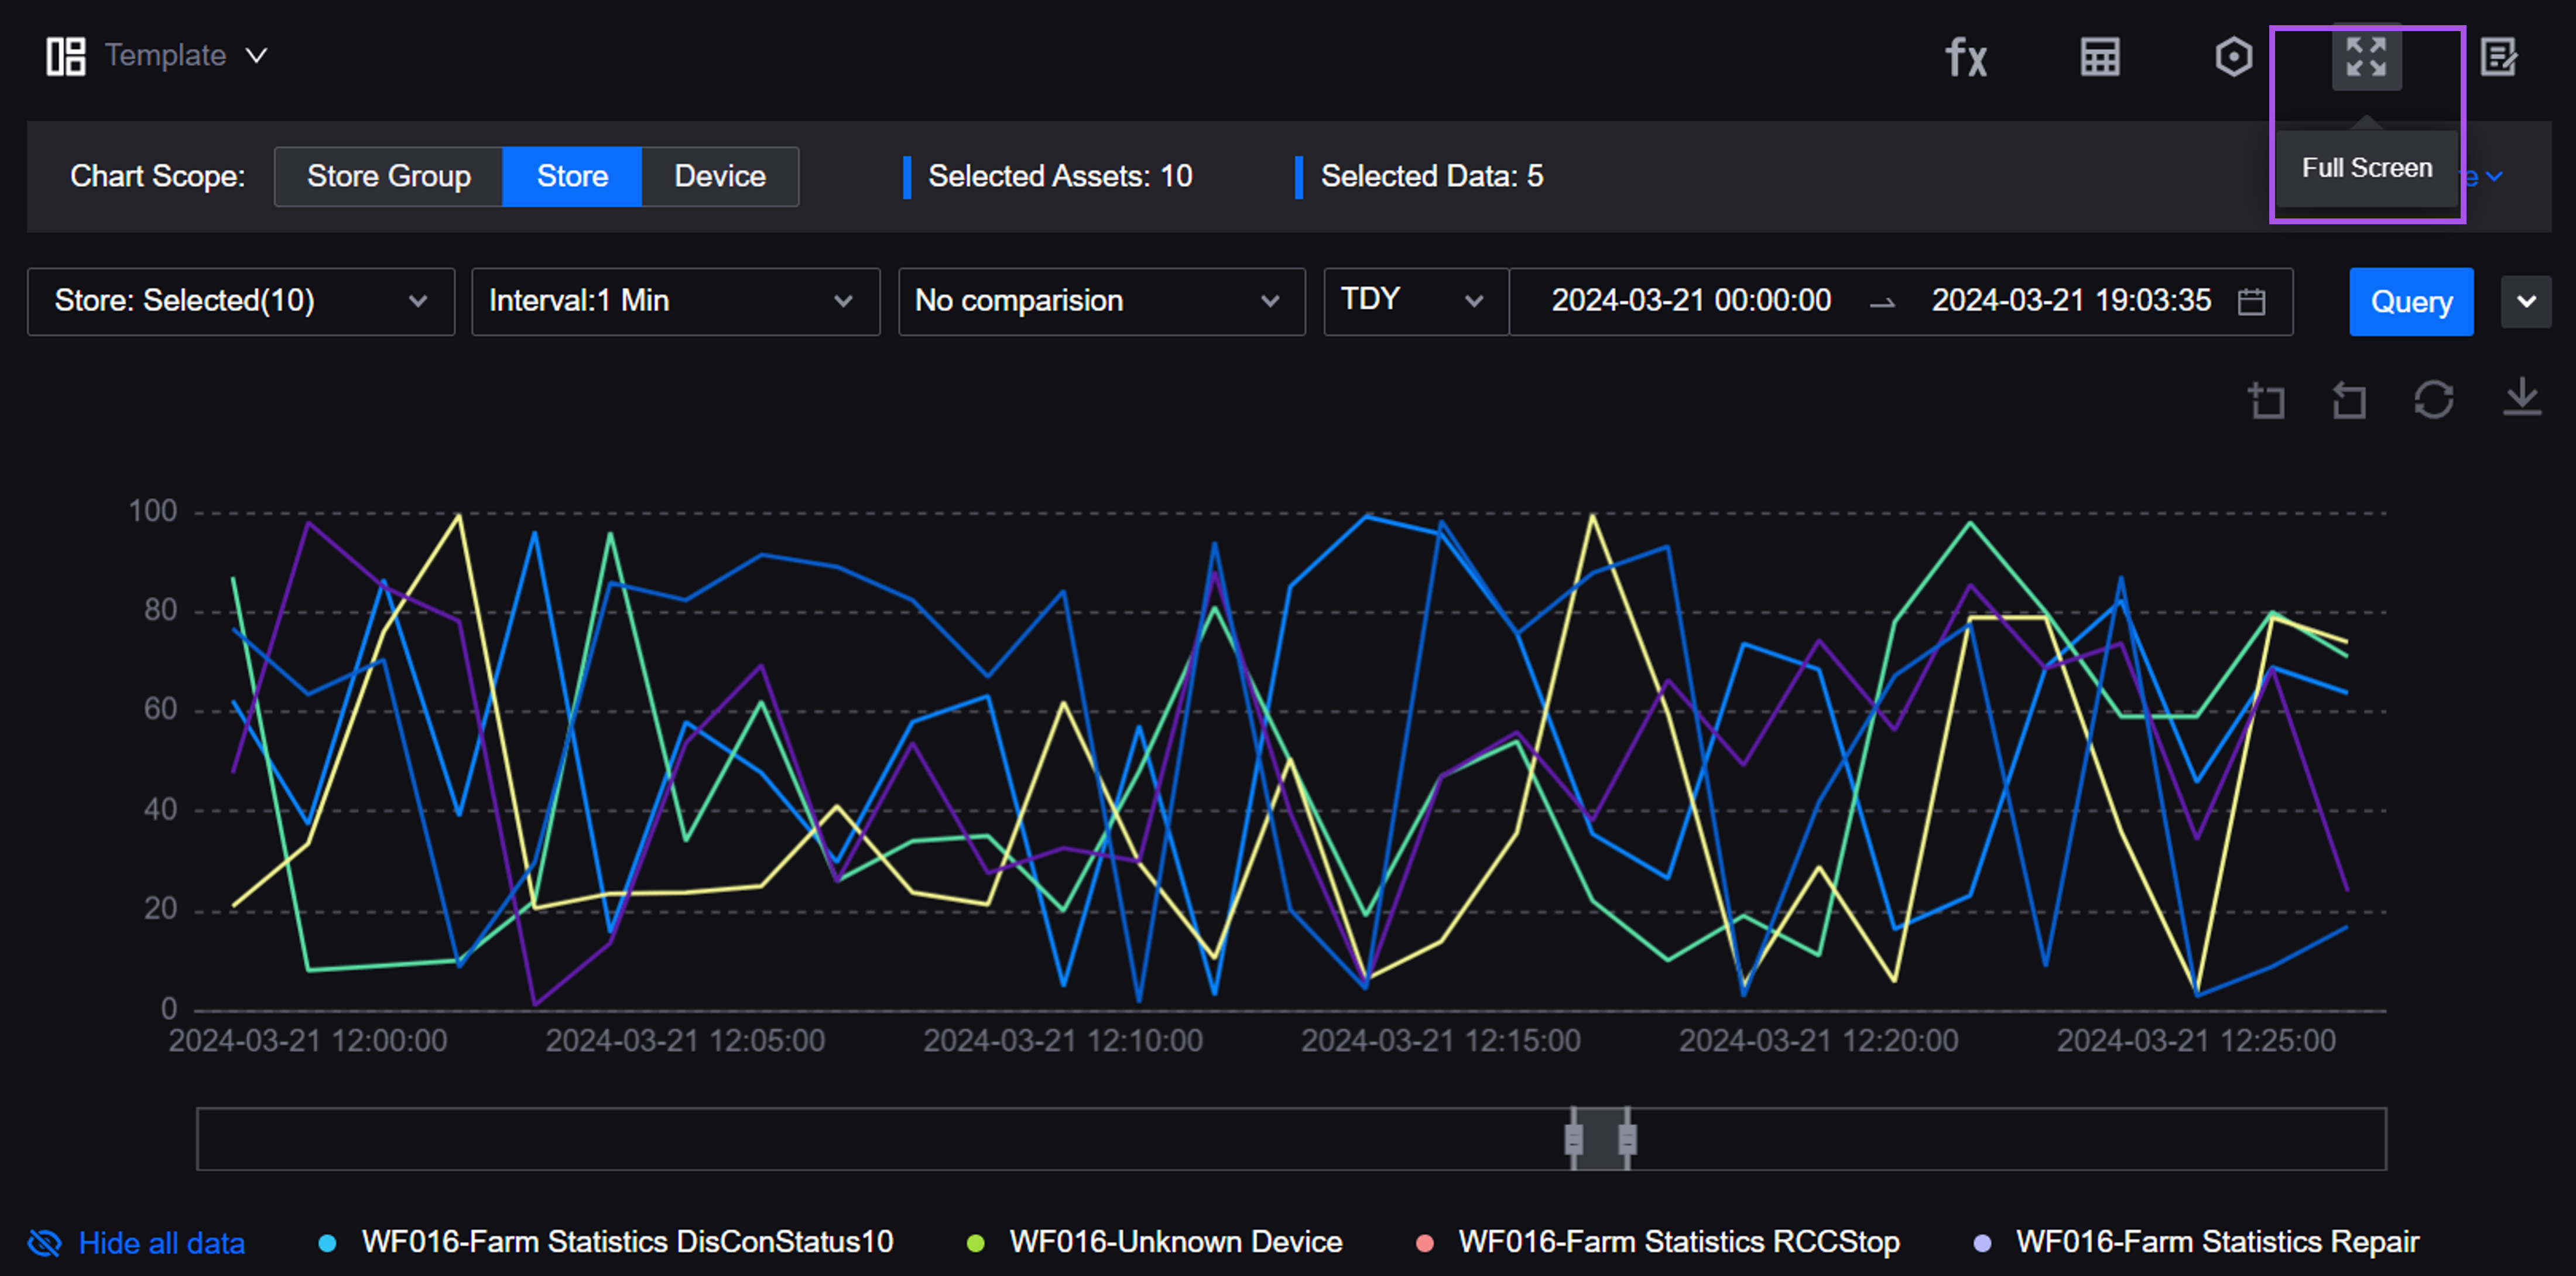
Users can now perform the following operations:
Zoom in to view the image in the asset details popup in the Portfolio.
Display the chart in full screen in the Charting Tool.
Work Management
Users can now print work orders to view work orders offline.
Fleet Control
Asset administrators can now perform the following operations:
Configure the mapping relations between feedback values and control values for assets to provide a basis for judging whether the remote control is successful.
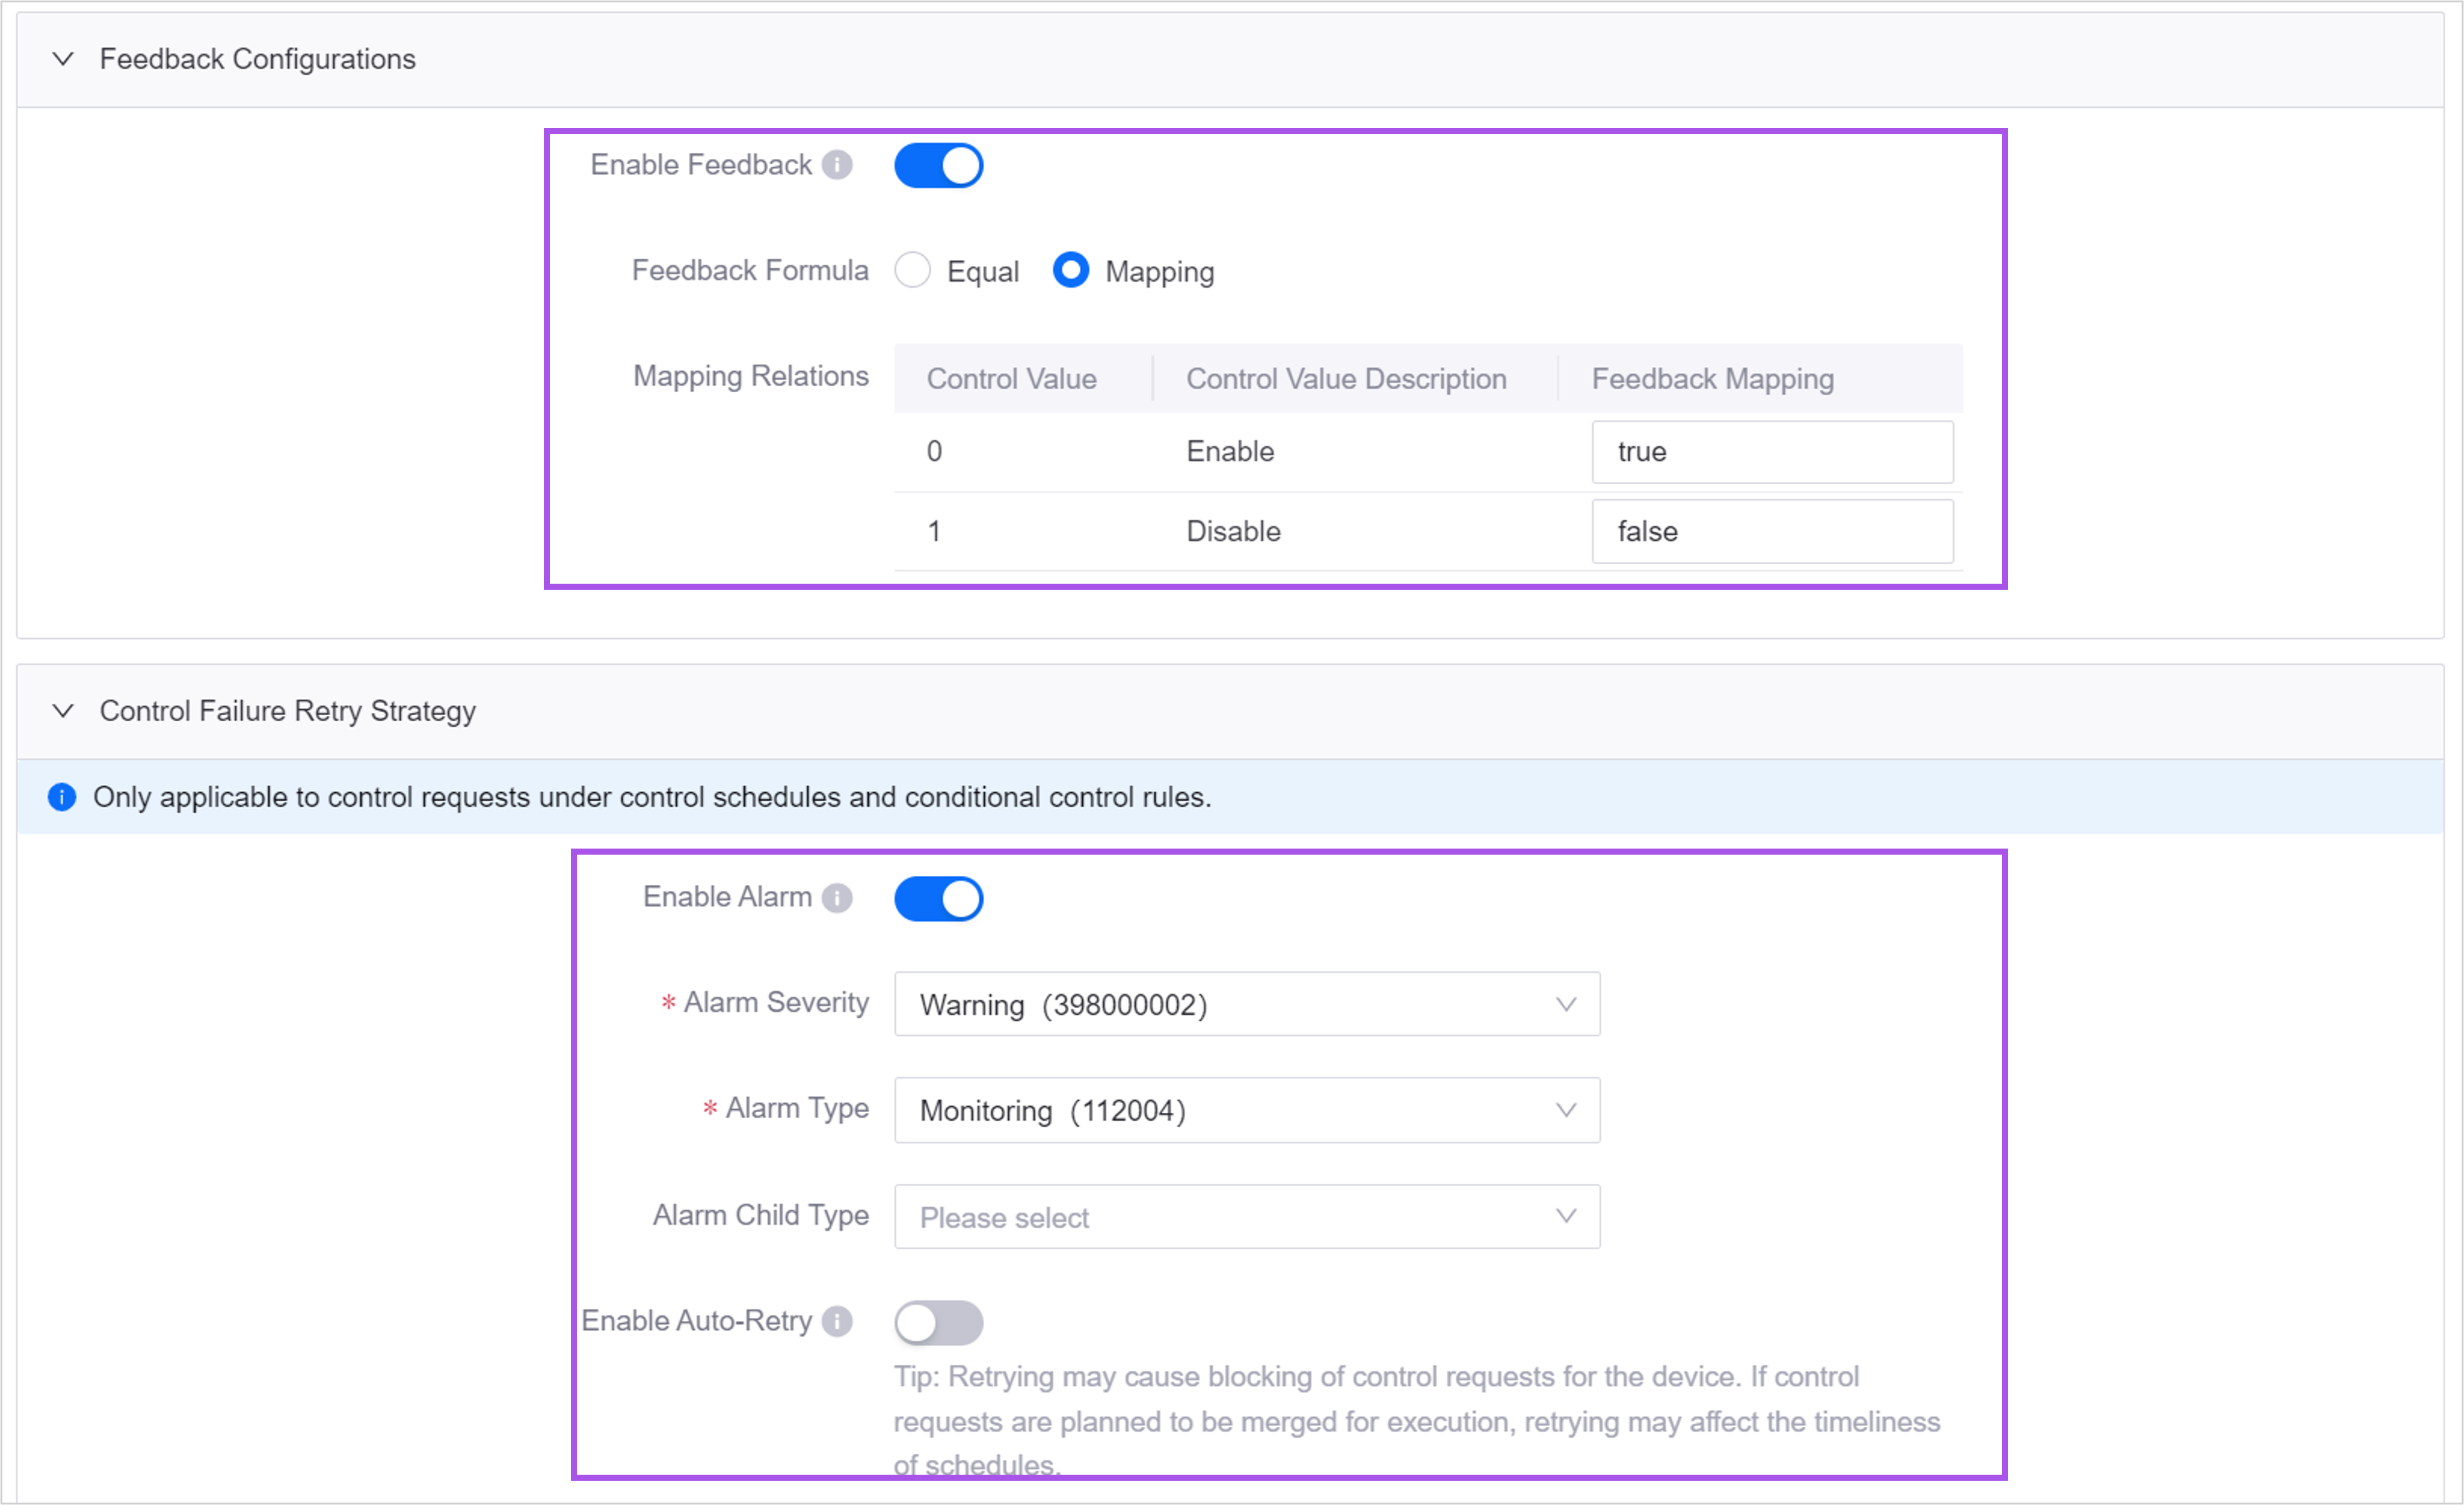
Configure alarm notifications and failure retry strategies for control requests that are managed by control schedules and conditional control rules. The failed control requests will generate alarms or be automatically retried.
Users can now filter the control log list to display only the logs where the control execution failed.
Configuration Center
Asset administrators can now perform the following operations:
Configure the French name for the business objects.
Import the exported files of the visualization groups into EnOS Common Data Service to quickly migrate the data.
Data Management
Data Asset Management
Data Asset Management is a unified management center for enterprise data assets, facilitating the central management and retrieval of data assets for external applications, business scenarios and business platforms to help transform the data asset value. Through virtual data mapping and unified management of internal data centrally, it eliminates information silos and data discrepancies while ensuring data security, and improves the value and utilization of data. Major features include:
Unified Management Center: Through centralized virtual data mapping and unified management of multi-source data within the enterprise, it enhances internal business interconnection and improves the efficiency of data asset aggregation and accumulation while ensuring data security.
Visualized Lineage Connection: Visualize and display the full-linkage lineage of business data, metrics data and technical data to enhance the transparency and reliability of data assets to support data analysis and application scenarios.
Multi-dimensional Asset Catalog: Provides a multi-dimensional data asset filtering directory to achieve quick access to data assets based on actual business scenarios.
Smart Data Search: Supports the search of business, metrics and technical metadata through data categories, and fuzzy search through recommendation algorithms to achieve fast and effective locating of data assets.
Data Sharing
Data Sharing is a tool for achieving data exchange within an enterprise’s business systems. It enables enterprises to securely retrieve cross-organization and cross-domain data for use in applications. Major features include:
Multiple Ways and Flexible Sharing: Provide flexible data sharing methods such as SDK, JDBC, download packages (Excel, CSV) to meet different usage scenarios such as report development and model training.
Permission Policy and Security Control: Integrated with EnOS Data Policy to provide an approval process for dataset uploading, downloading, and accessing, securely managing the data sharing scope and usage access rights.
Data Standard
Data Standard, as the first step to enterprise data governance, empowers you to carry out the overall planning and construction of data standard, solves the inconsistency problem in data categorization and usage right from the root, thereby reducing the cost of data management. Major features include:
Built-in Template: Provides typical data specification templates for multiple industries, which can be directly reused or modified by enterprises according to own situation to enhance the efficiency of specification configuration.
Standard Specification Customization: Develop relevant business data rules to standardize complex business data, so as to ultimately achieve data management standardization.
Data Policy
Data Policy is a tool used to configure and manage data security and compliance related elements such as data approval rules and data permissions. Major features include:
Approval Process: Retrieve, view and approve data requests efficiently, optimize resource allocation and workloads, and enhance accuracy and traceability of approval roles.
Fine-grained and Dynamic Permission Management: Manage approval role permissions with fine granularity to improve data security and confidentiality and meet different compliance standards.
Schedule Center
Scheduling Center provides a unified data download portal and task scheduling center for internal applications. Major functions include:
Task Status Real-Time Monitoring: Instantly track the progress and status of file download tasks in real time.
Personalized Task View: Users can view only download tasks created by themselves within the scope of the application, users can focus on the tasks they are responsible for and maintain the confidentiality and security of their tasks.
Diversified Application Methods: Supports stand-alone use and embedded applications. When used independently, it can display view the information of different task types, and provide panoramic task management. When embedded in an application, only tasks within the application are displayed to protect data security and privacy.
Data Synchronization
Supports syncing of data from SAP HANA type databases and Oracle ojdbc 14 driver version databases. For more information, see Synchronizing Data from External Data Source to Hive (Manual Scheduling).
Time Series Data Management
Supports viewing of the following metering items for Time Series Data Management in the EnOS Metering:
Number of active devices
Number of measurement points
Common Data Service
Added a new menu Visualization Groups for application creators to define the groups of attributes, measurement points, and metrics by business scenarios. This enables application creators to standardize the display fields for the same object type in different scenarios without having to configure them one by one every time.
Data Source Registration (Application Portal)
Data Source Registration provides a unified data source configuration portal for data products and applications to help users effectively connect and manage various data sources for data development and application development. Major features include:
Multi-source Data Connectivity: Integrates seamlessly with MySQL and ClickHouse type data sources.
Flexible On-Demand Configuration: Provides customized configuration options that can be used as stand-alone applications or embedded in menus within other applications.
Data Access Isolation: Provides user permission configuration to ensure that each user can only access the data sources they are authorized to access.
Data Source Registration (Management Console)
Added SAP HANA data source, which allows users to retrieve and analyze data from such relational databases. For more information, see Registering a SAP HANA Data Source.
Added a support for Oracle ojdbc14 driver version. For more information, see Registering an Oracle Data Source.
Device Connection
Device Management as-a-Service
Device Management as-a-Service (DMaaS) is an application that can facilitate decision-making for enterprises by analyzing and managing real-time device data. DMaaS helps enterprises optimize device operations, saving costs and improving efficiency. It also increases the overall operational capabilities and business value. Major features include:
Device Modeling and Management:
View device statuses, firmware version distribution, measurement point reports, command issuance, and device status trends.
Manage private models, products, assets, and device groups.
View, import, and export public models.
Device Operation and Debugging:
Upgrade and manage firmware, view firmware upgrade statistics.
Customize the operation dashboard.
Query operation logs, device local logs and communication statuses on the cloud.
Debug real devices and virtual devices online.
Device Connection
You can now perform the following operations:
Contact your system administrator to create multiple device connectors (DC) for the OU. The multi-DC mode supports horizontal scaling, load balancing, and seamless upgrades, improving connection performance and stability.
View the broker addresses and other connection information of multiple DCs in the new menu Connection Manager.
Track all device routing information of all DCs in the new menu Routing Manager to quickly troubleshoot and diagnose faults.
Device Management
You can now perform the following operations:
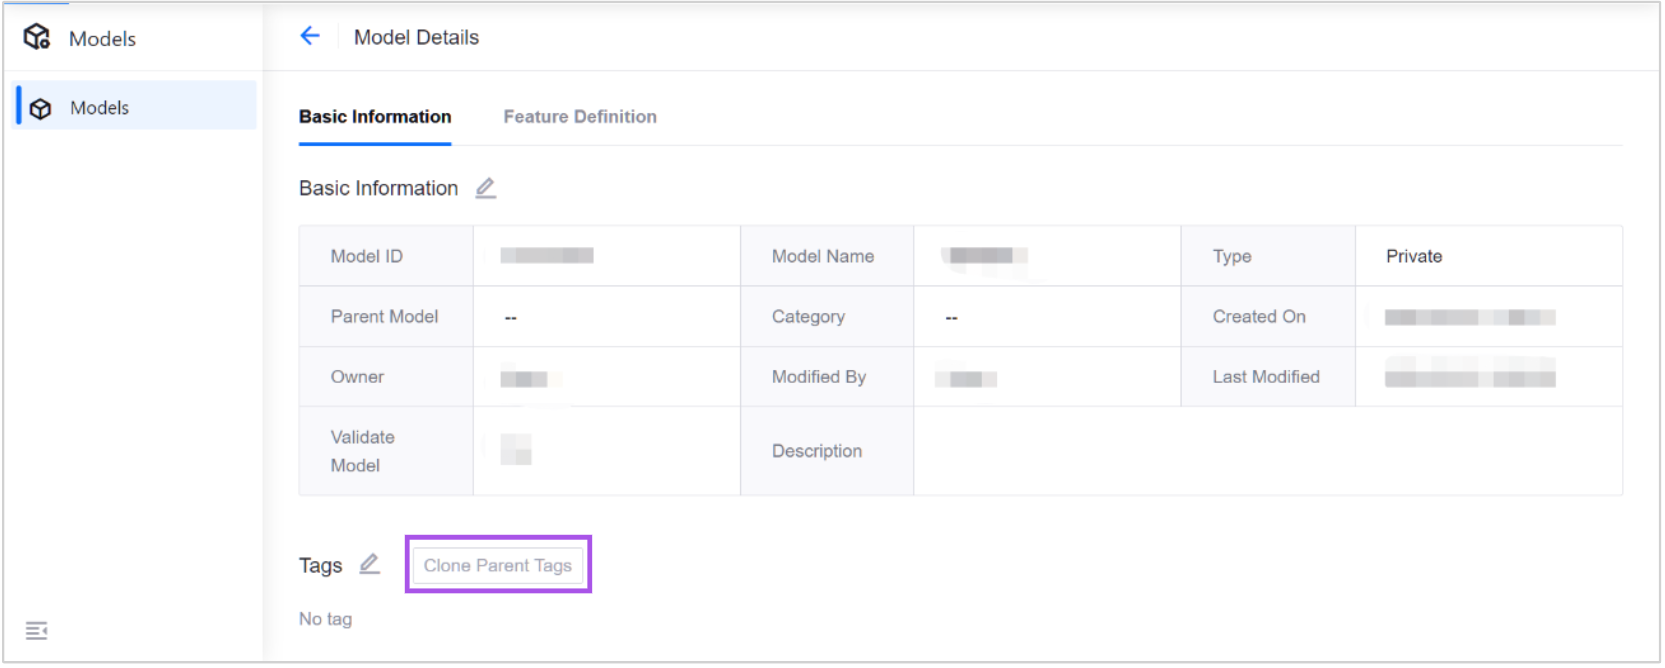
Model:
- Clone parent model tags instead of manually inputting them.
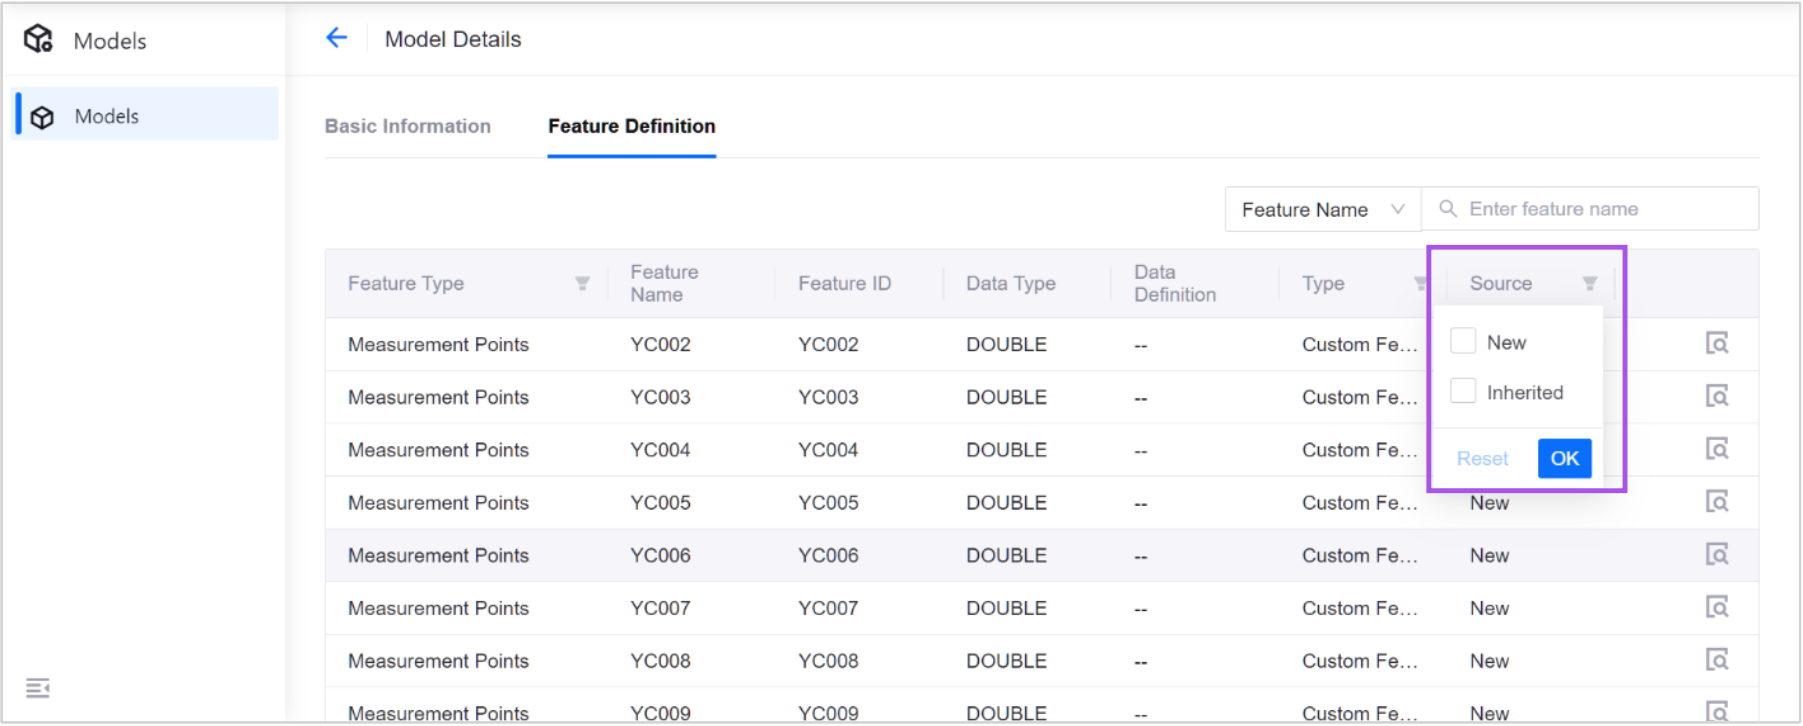
- Trace the source of attributes, measurement points, services, and events in the model to determine whether the information comes from the inherited parent model or the model itself.
Device Groups:
Flexibly group devices tailored to business scenarios in the new menu Device Groups, using the following group types:
Static device groups: manually select the devices that you want to include in a group.
Dynamic device groups: automatically group devices based on conditions that you set such as Model ID, Product key, device tag and so on.
OTA Upgrades:
Set OTA upgrade scope through these new filters:
all devices
target devices
device groups
If the firmware is not associated with a product, upgrade the firmware for the selected devices, regardless of the product or model they belong to.
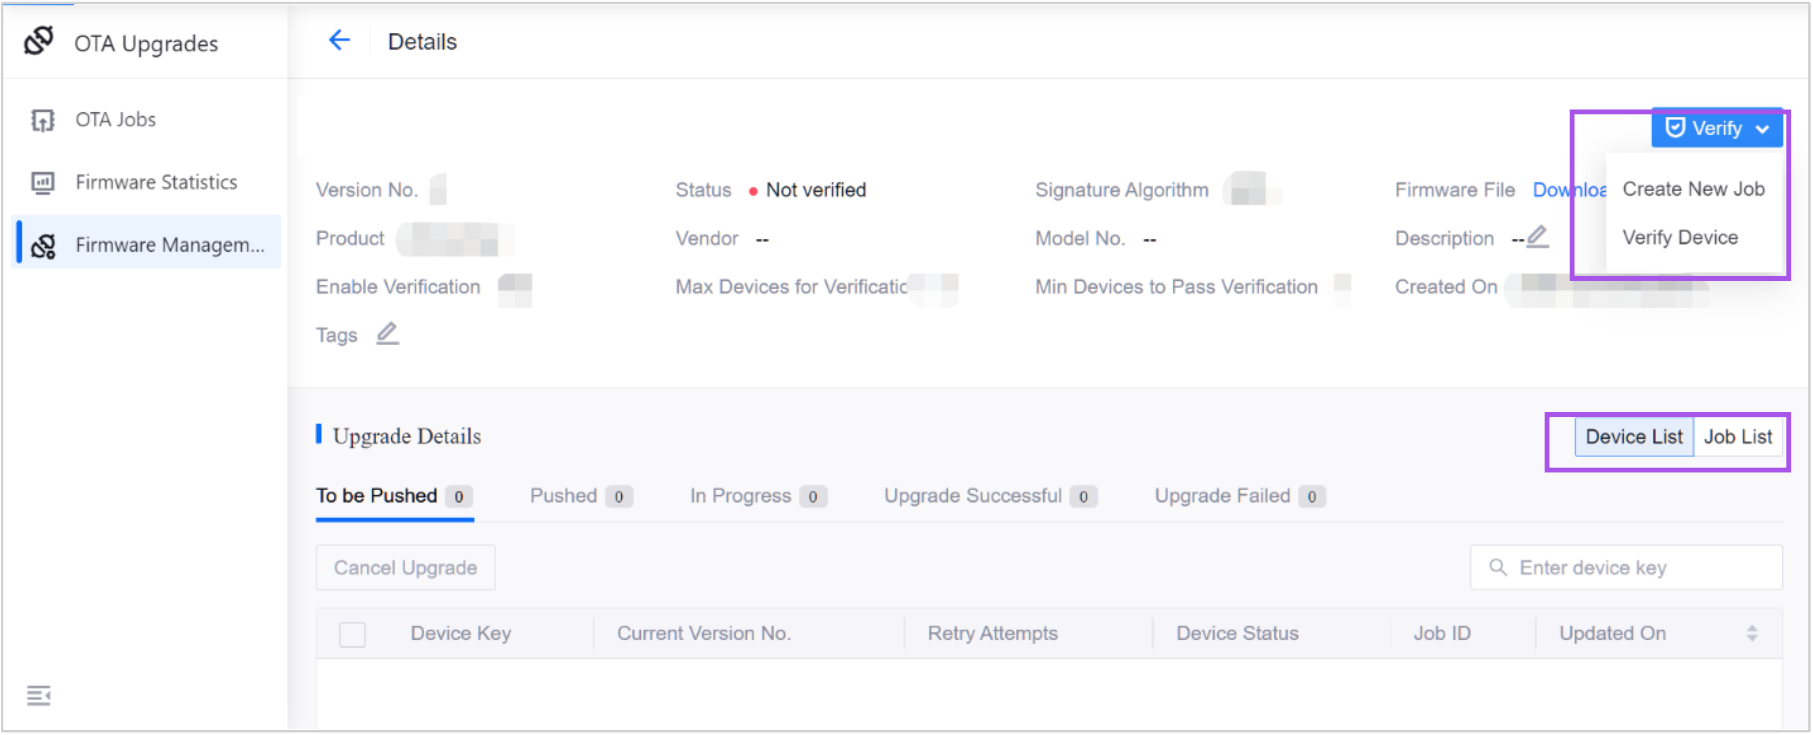
Upgade and manage OTA tasks by firmware. On the firmware details page, you can:
Create an OTA job or specify devices to upgrade a firmware.
View firmware-centered upgrade details in both the device list and job list.
View the duration and retry attempts of OTA upgrade jobs.
Filter OTA jobs and firmwares to quickly view the necessary information.
Monitoring and Maintenance:
In the Device Monitoring Board, view device statuses, measurement point reports, command issuance, firmware distribution, and other device management information.
In the DC Monitoring Board, view device connection status, received and sent message status, and other device connectivity information.
- In the Custom Board, view the charts customized in the Metrics Explorer and pinned to this board.
Alarm Management
Asset administrators can now perform the following operations:
Export alarm rules as JSON files, as well as import alarm rules using JSON and Excel files.
When creating alarm rules, specify Struct type measurement points as trigger sources.
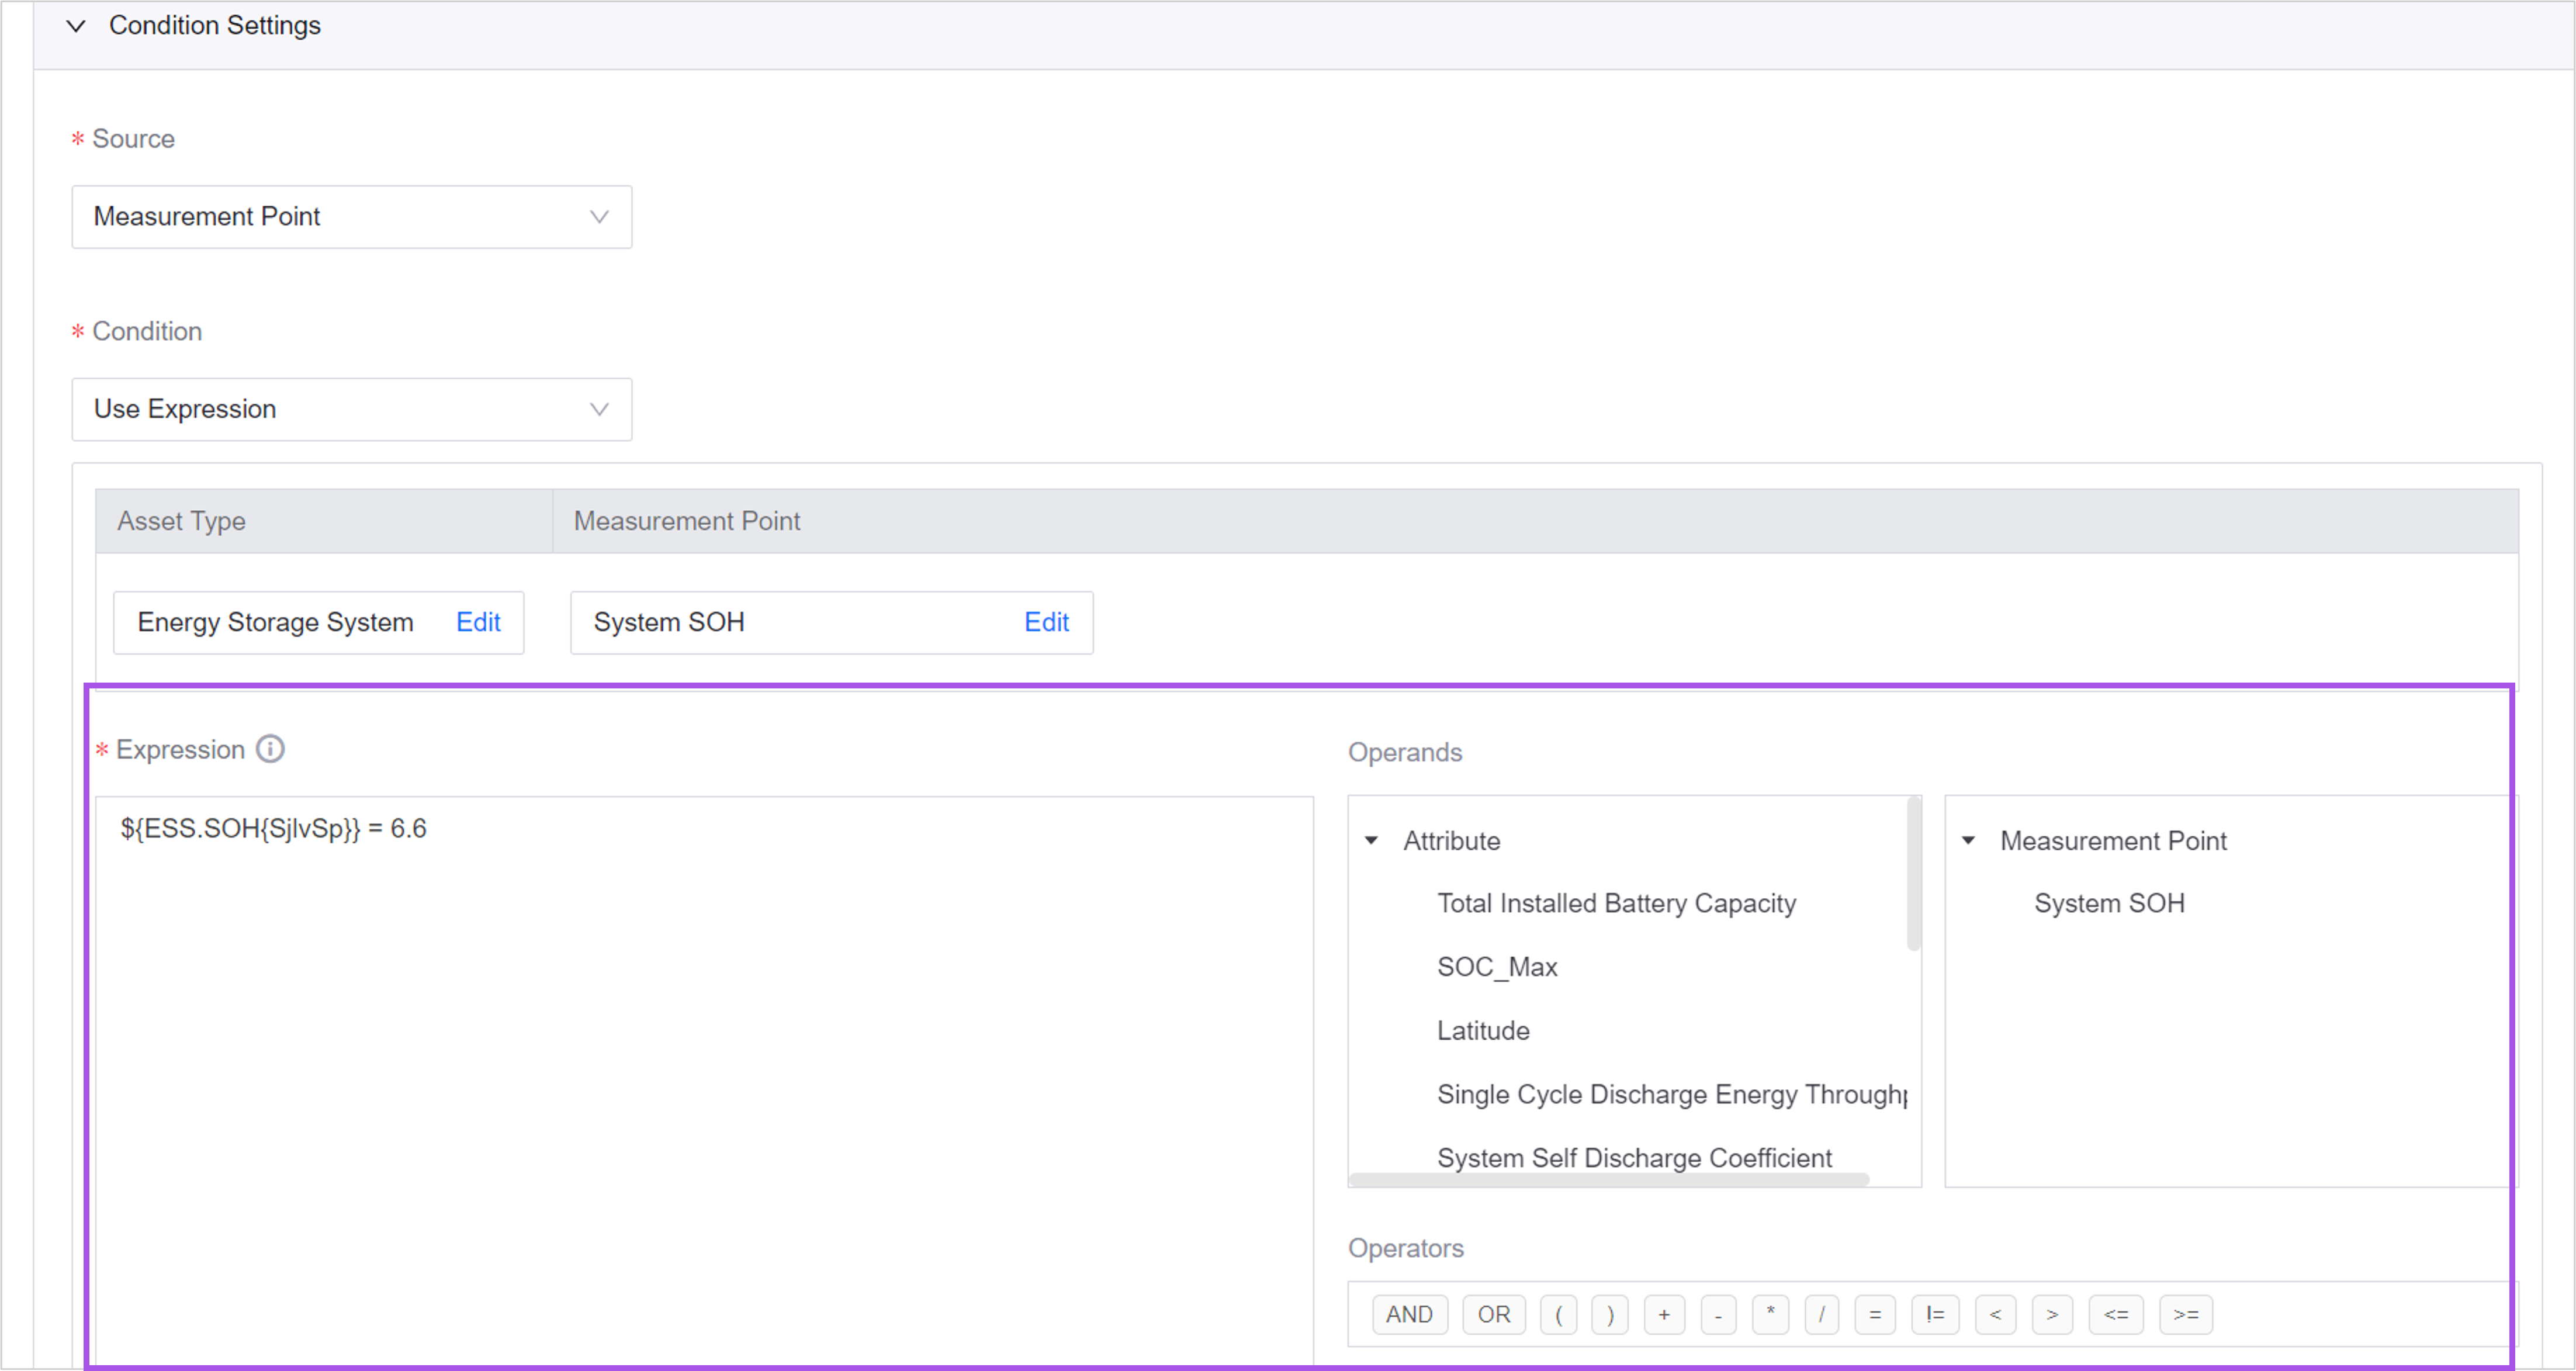
When creating alarm rules, customize expressions using measurement points, operators, custom values, and time series functions as trigger conditions.
Add custom columns to the active alarm and alarm log lists for different site types in Alarm Config.
Add tags to alarm severities and alarm types in Alarm Metadata for batch management.
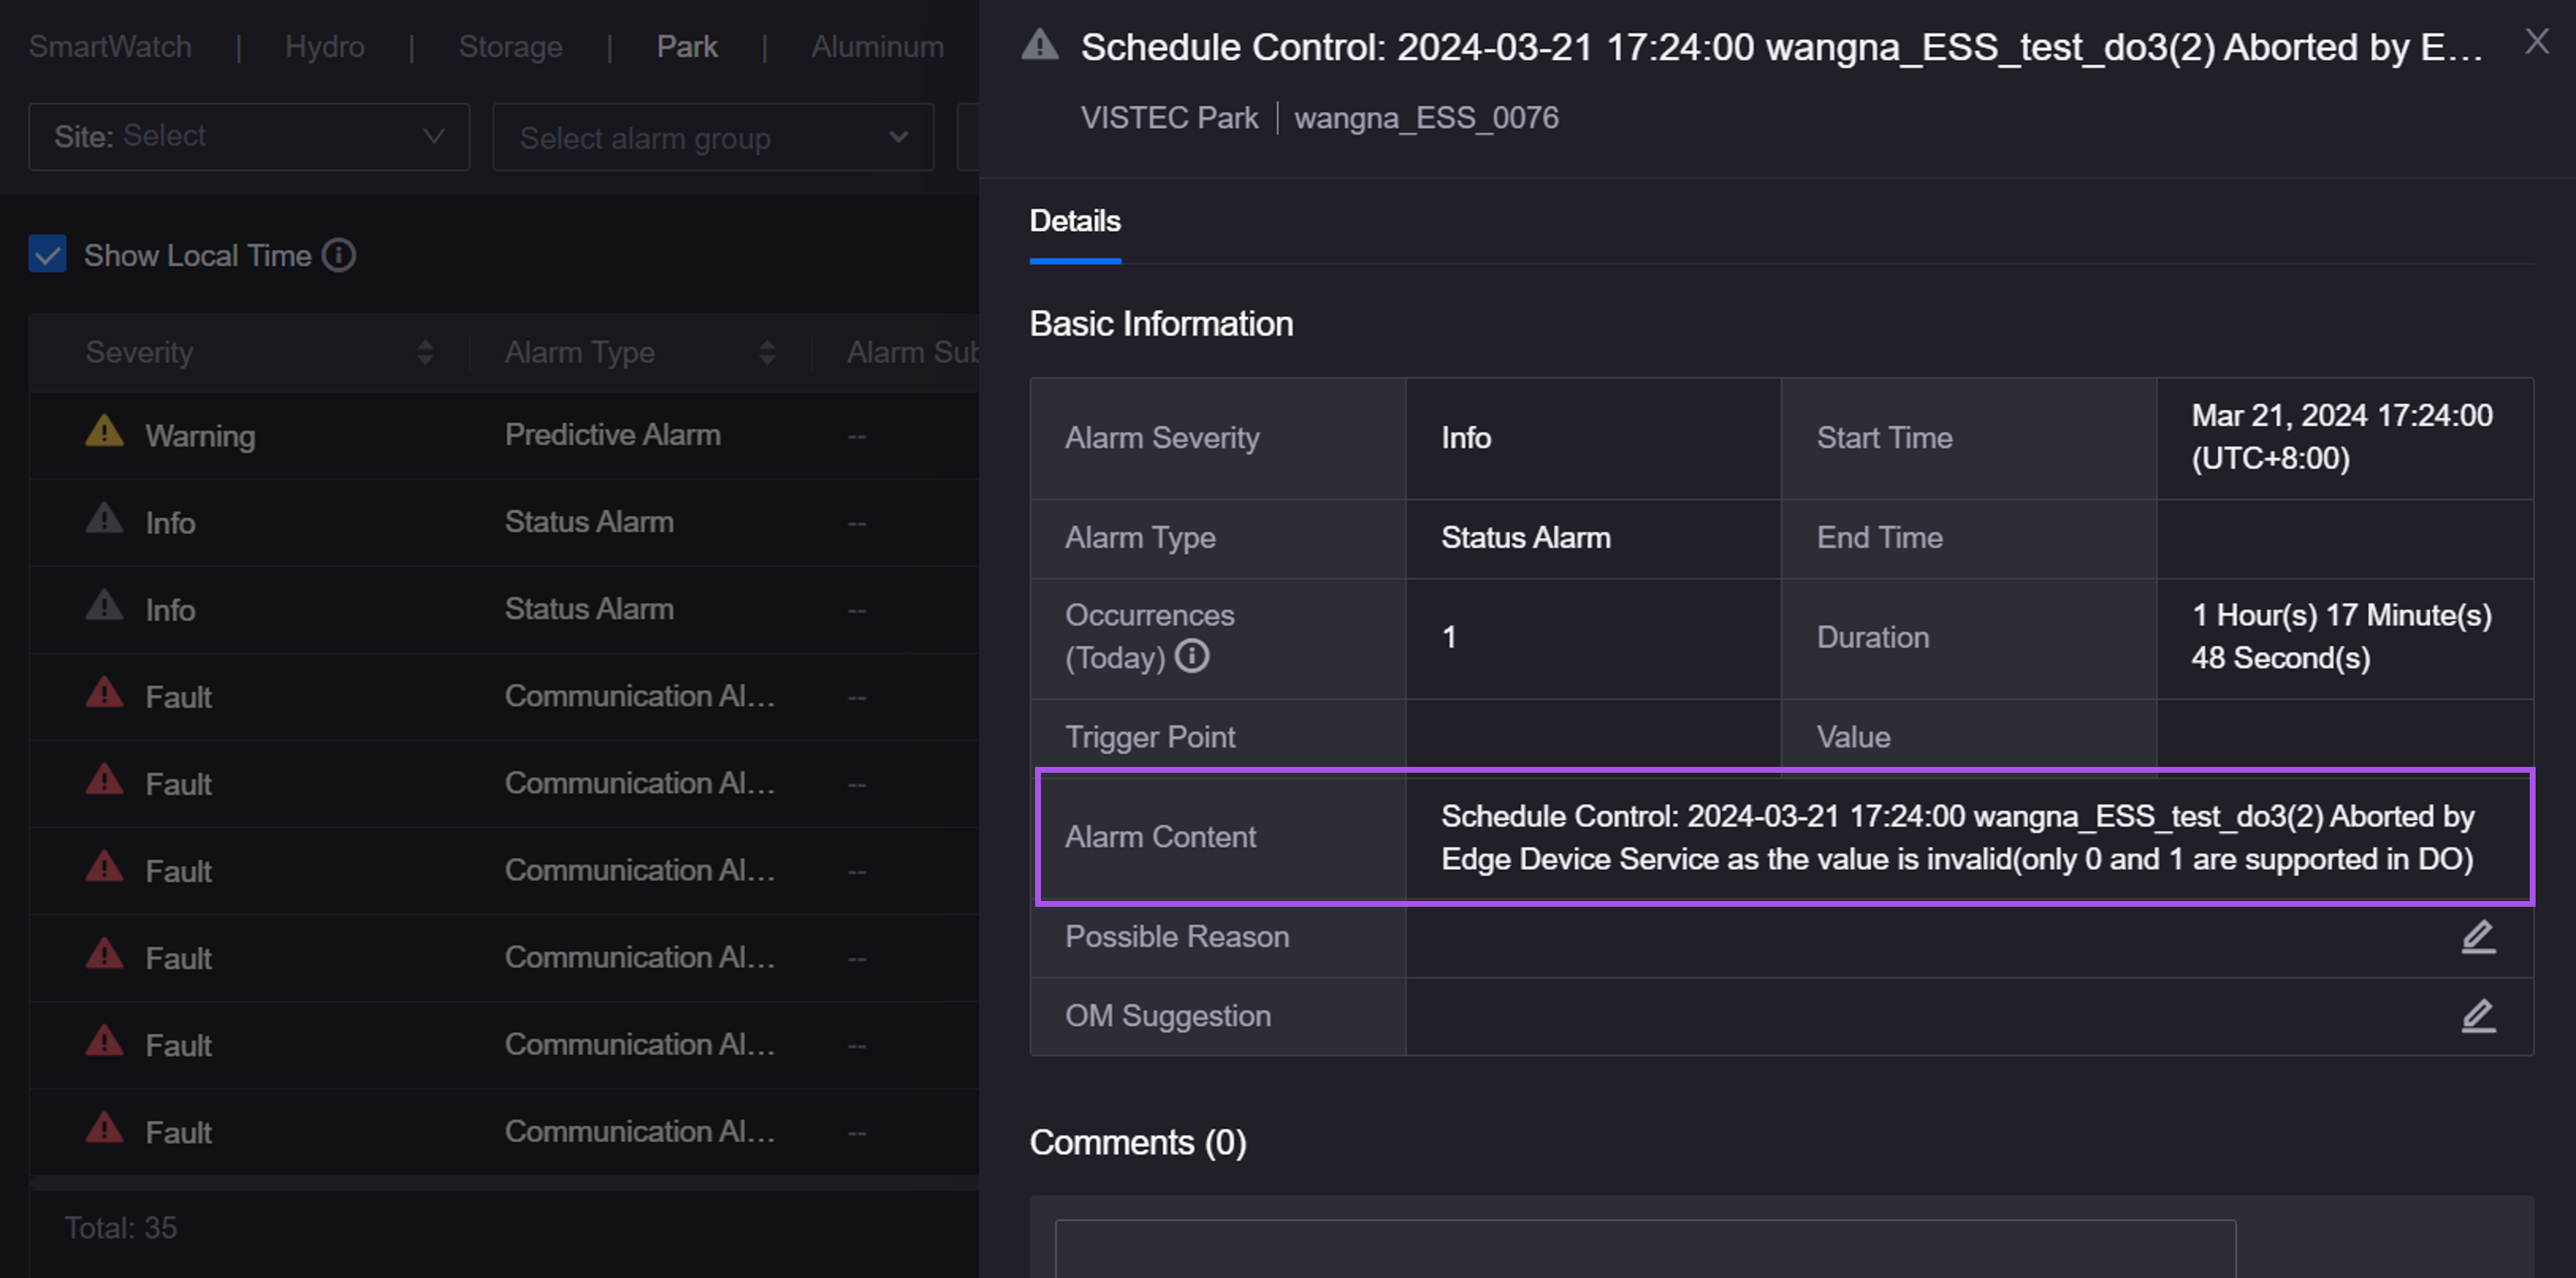
Users can now view the alarm content in the alarm details popup in both the Active Alarm and Alarm Log.
Data Quality
Application administrators can query the following metering results for Data Quality in EnOS Metering:
Total number of IoT monitoring rules
Total number of metric monitoring rules
Device Provisioning Service
Added a new menu Sync Gateway for users to create and manage sync gateways, synchronizing devices from external device management systems to EnOS.
Administrative Tools
Management Console: Supports French as a display language, and system administrators can configure French strings for the fields that support internationalization.
Identity and Access Management: System administrators can now add 3 contact persons for an OU for maintenance notifications and emergency response.
Application Registration: Added new application categories, including “Device Management”, “Smart Monitoring”, and “Data Analysis”. The Application Portal will display applications organized by these categories.
Audit: In the Lightweight version, the Audit page can be added as an application to the Application Portal. The security auditors can view the audit data for the OU in the Application Portal.