Pie Chart
The pie chart widget is used to compare data between a single data series, showing the proportion of each value to the total, and the total proportion can only be 100%.
Data Fields
The data fields required are:
Field |
Quantity |
|---|---|
Dimension |
1 |
Measurement |
≥ 1 |
Extension |
Unlimited |
Note
If you do not have a dimension in your data and want to generate a single pie chart using multiple measurements, use the Multi-measurement Single Pie Chart widget. For more information about how to use it, see Multi-measurement Single Pie Chart.
Chart Style
Pie Chart Style
Pie Settings
Field |
Description |
|---|---|
Use Gradient |
Select this to fill the pie chart with a gradient. |
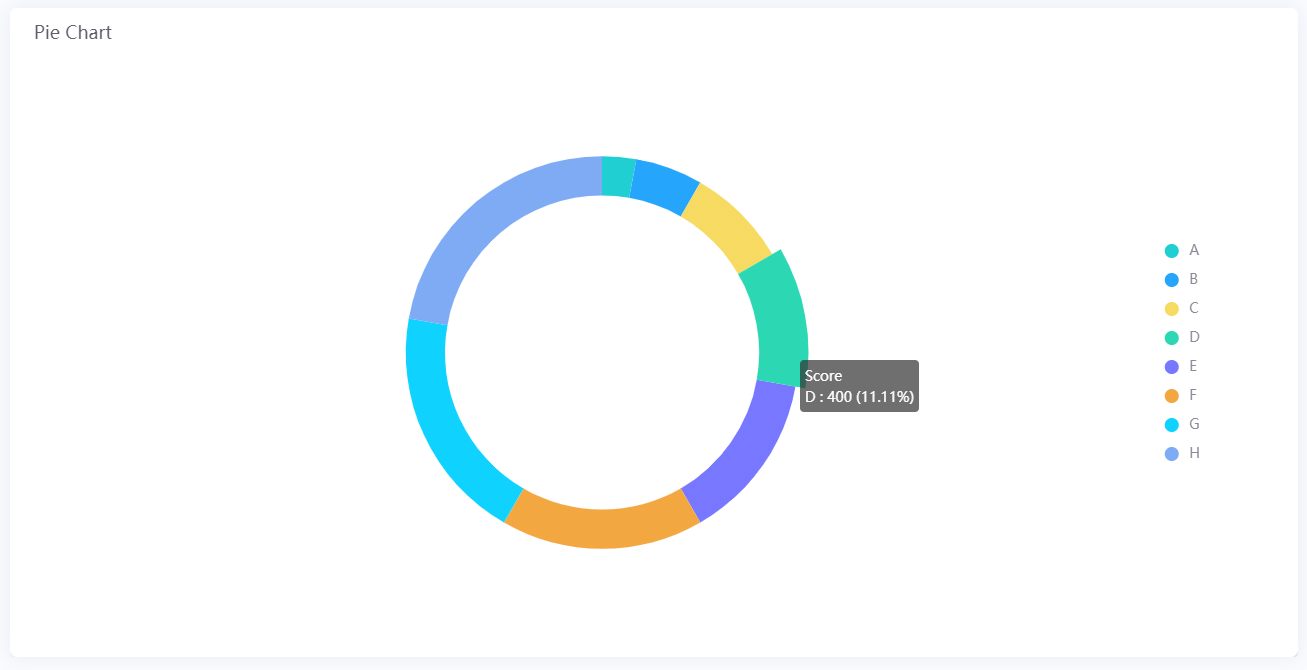
Use Donut |
Select this to display the pie chart as a donut. |
Inner Diameter & Outer Diameter |
Specify the thickness of the pie chart when it is displayed as a donut. |
Value Font |
Style the value labels. |
Decimal Places |
Round up the displayed chart data to the specified decimal places. |
Show Thousands Separator |
Select this to display the thousandths of the value. |
Unit Name |
Specify the unit for chart data. |
Dynamic Unit |
Select this to automatically use the unit that suits your data values. |
Unit Font |
Style the unit labels. |
Line Break |
Select this to display the unit below the value. |
Layout |
Configure the number of rows and columns for displaying pie charts. |
Show “Expand” |
If you enable Show “Expand”, you can select Expand at the bottom of the cart to see more sectors. |
Data Size |
|
Show As Percentage |
Select this to display the chart data as percentage values. |
Legend
Field |
Description |
|---|---|
Position |
Select the position of the legend with respect to the pie chart(s). |
Size |
Specify the radii of the legend dots and the vertical spacing between them. |
Legend Font |
Style the text labels in the legend. |
Legend Length |
Specify the maximum length of the legend. |
Show Legend Value |
Select this to show the values next to the legend and the total value in the center of the pie chart. |
Data Shown in Legend |
From the Extension data field, select the value to be displayed next to the legend. |
Data Shown in Total |
From the Extension data field, select the total value in the center of the pie chart. |
Value Font |
Style the value labels. |
Unit Font |
Style the unit labels. |
Value Margin |
Specify the spacing between the value and the text labels in the legend. |
Data Label
Field |
Description |
|---|---|
Font |
Style the Dimension labels. |
Position |
Select where the Dimension labels are positioned relative to the pie chart. |