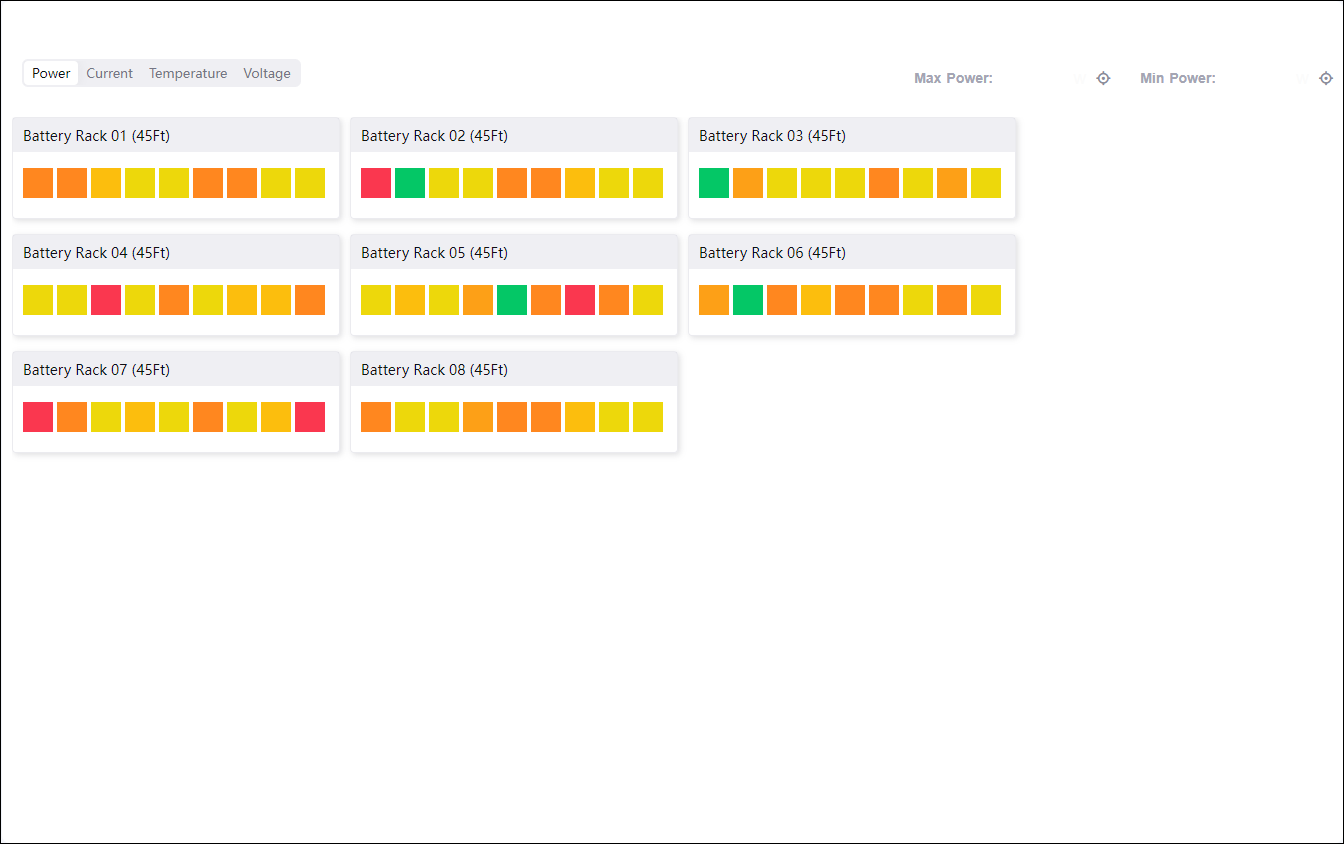
Device Status
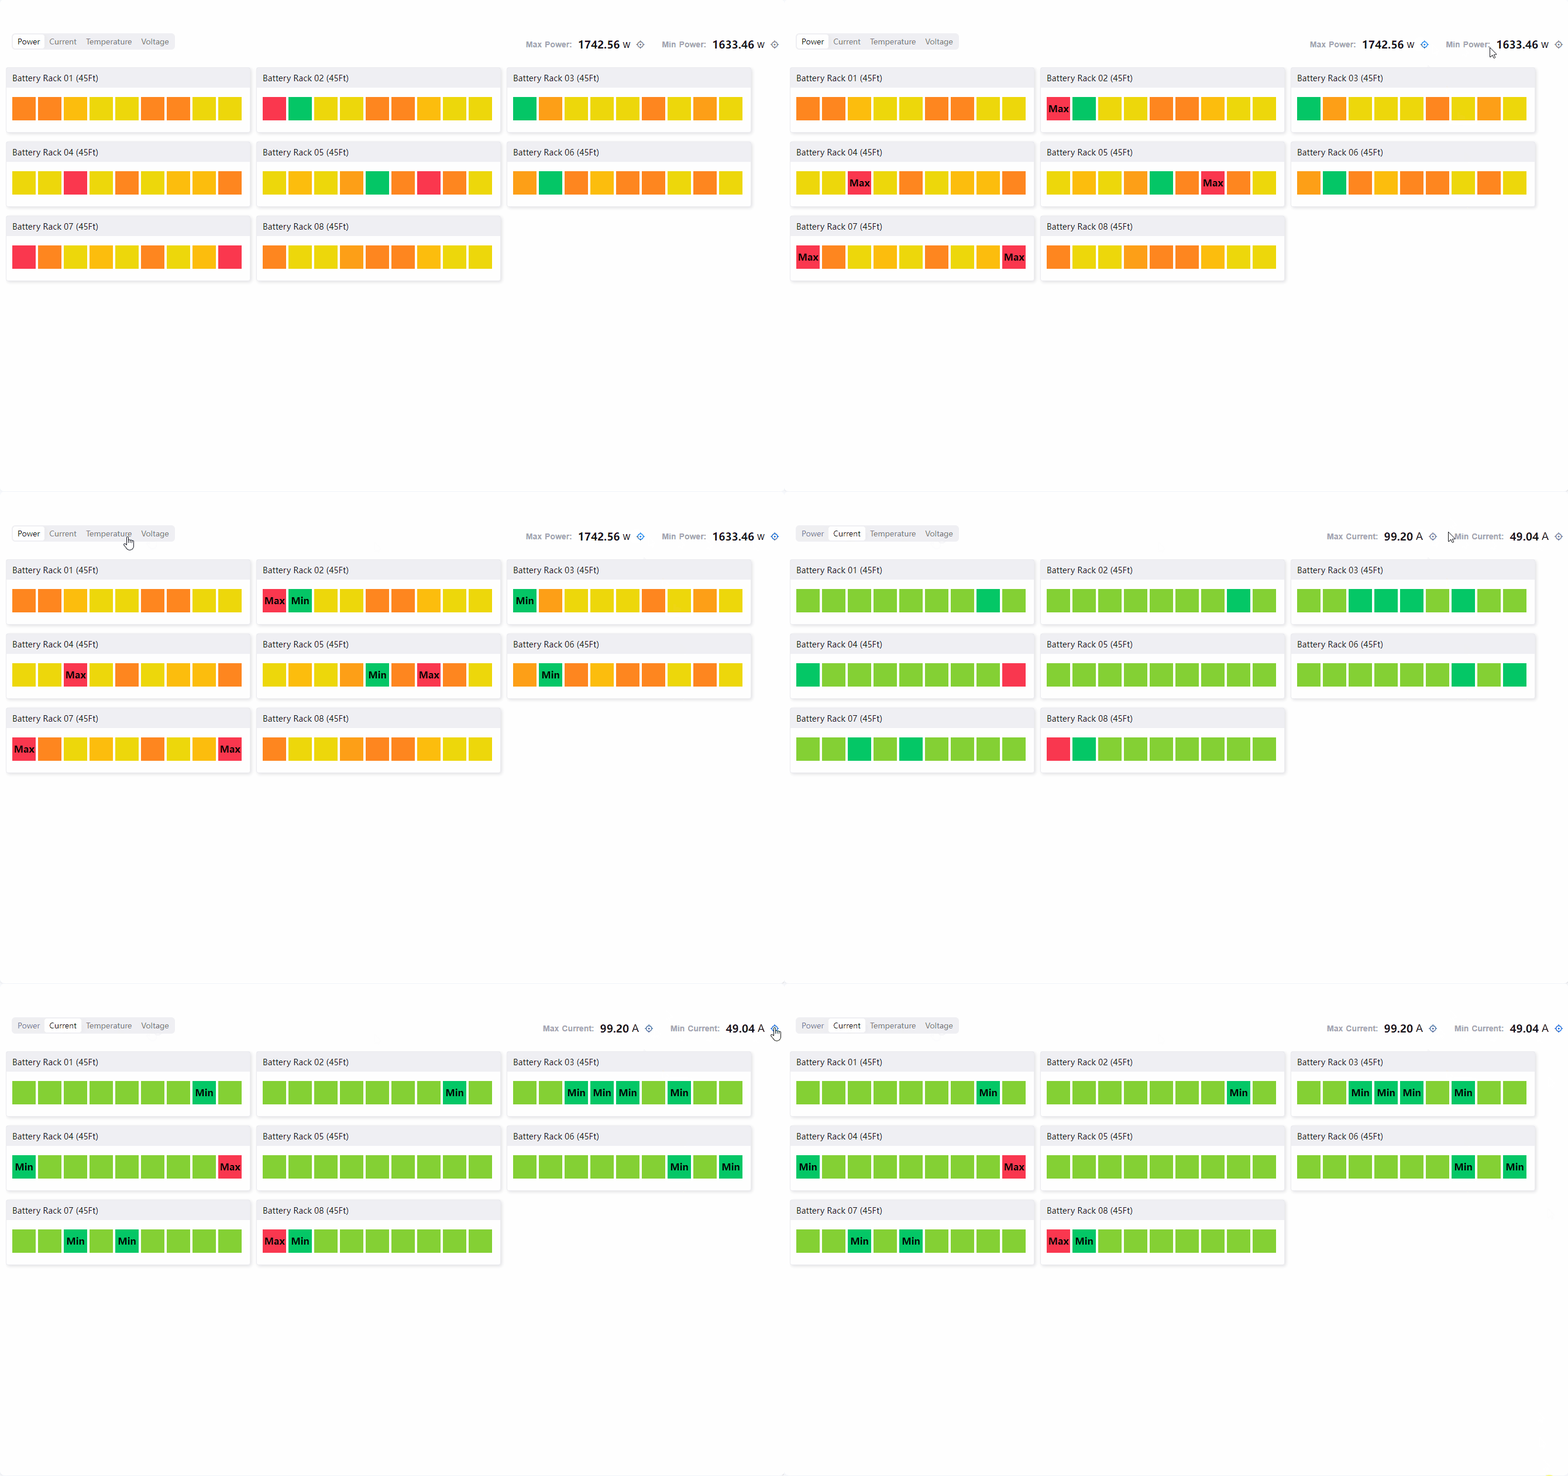
Monitor device statuses in a manner similar to a heatmap. Configure the color mapping to quickly identifying abnormal data.

Maximum and Minimum Label
Located on the top right of the widget are the maximum and minimum values which can be identified in the current tab of data sets. Select the target button  to reveal where these instances have occurred.

Data Fields
The data fields required are:
Field |
Quantity |
|---|---|
Dimension |
1 |
Measurement |
≥ 1 |
Note
Only supports Common Data Service (CDS) data source.
Chart Style
Dimension Style
Format the names for all the data sets.
Field |
Quantity |
|---|---|
Name Font |
Style the names. |
Parent Metrics Style
Configure styles for the different metrics in the upper-right corner ellipsis (…) of cell groups.
Note
Appears only if the two models in the selected category are parent-child relationships.
Field |
Quantity |
|---|---|
Show Name |
Check to display the metric data. |
Unit Name |
Specify an unit for the value. |
Dynamic Unit |
Select this to automatically use the unit that suits your values. |
Decimal Places |
Round up the values to the selected number of decimal places. |
Measurement Style
Configure display options for varying values in every data set.
Field |
Quantity |
|---|---|
Unit Name |
Specify an unit for the value. |
Dynamic Unit |
Select this to automatically use the unit that suits your values. |
Decimal Places |
Round up the values to the selected number of decimal places. |
Color Mapping |
Specify the minimum and maximum values of the color map.
|
Color Scheme |
Select the color scheme for the color map. |
Other Settings
Cell Settings
Format the layout of the colored cells.
Field |
Quantity |
|---|---|
Width |
Specify the width of the cells. |
Spacing |
Specify the spacing between the cells. |
Min/Max Label
Format the minimum and maximum labels and their respective values.
Field |
Quantity |
|---|---|
Name Font |
Style the labels. |
Value Font |
Style the values. |
Unit Font |
Style the unit. |