Usage Scenarios
Configuration Center can be used in the following scenarios.
Managing Global Resources
Use Configuration Center to define common business objects, business rules, asset elements, investment and financing tables, etc. These resources can be quickly reused in different OUs by assigning them to different onboarding templates. Export and import resource packages to reuse them in different application environments.
Defining OU Resources
Define business objects, asset elements, investment and financing tables, etc. specifically for an OU and use these separately defined resources through configuring onboarding templates.
For example, create a station type in the Global Business Object menu and assign it to the current onboarding template.
When configuring a site in the Site Onboarding menu of Onboarding Tool, only the above-mentioned station types can be created.
Creating Applications with EnOS CBBs
Create and update applications quickly by combining the functionality of various EnOS Industry Application Common Building Blocks(CBBs) using solution templates.
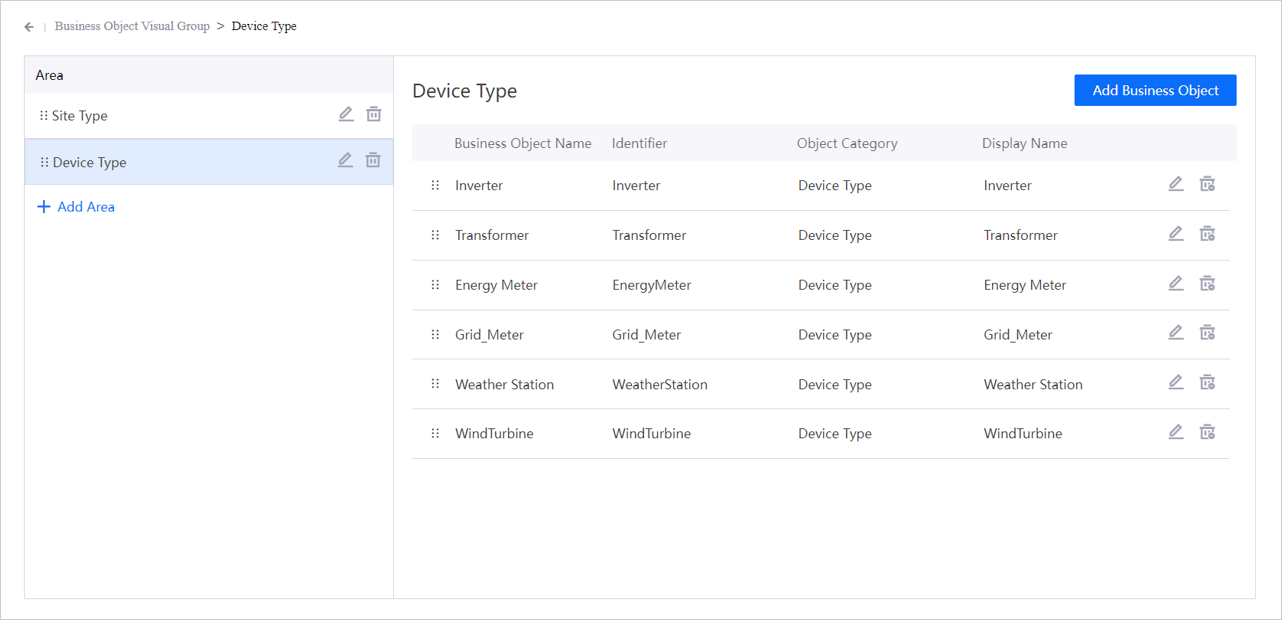
Configuring Visual Groups of Business Objects
In Unified Monitoring, when selecting asset types, unnecessary business objects can be hidden by configuring the visual grouping of business objects in Configuration Center.
For example, define the visual grouping of device types to display only the inverter, box transformer, grid-connected table, gateway table, meteorological station, and wind turbine devices, and configure their corresponding identifiers.
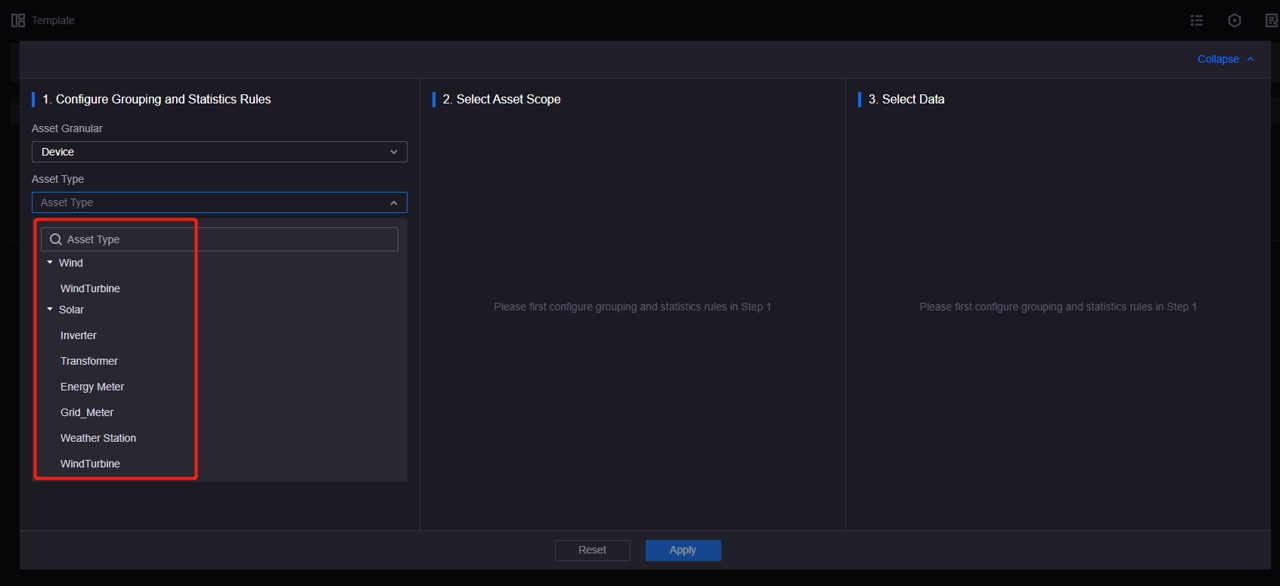
When selecting Device Level asset granularity in the Report Configuration popup menu of Configuring Common KPI Inquiry, only the above-mentioned device types will be displayed.
Customizing Visual Fields
When creating applications that use some page features of Digital Twin Visualization and Unified Monitoring, you can configure the display fields of business objects in Configuration Center to determine the display order, names, and grouping of data in the visualization components and pages.
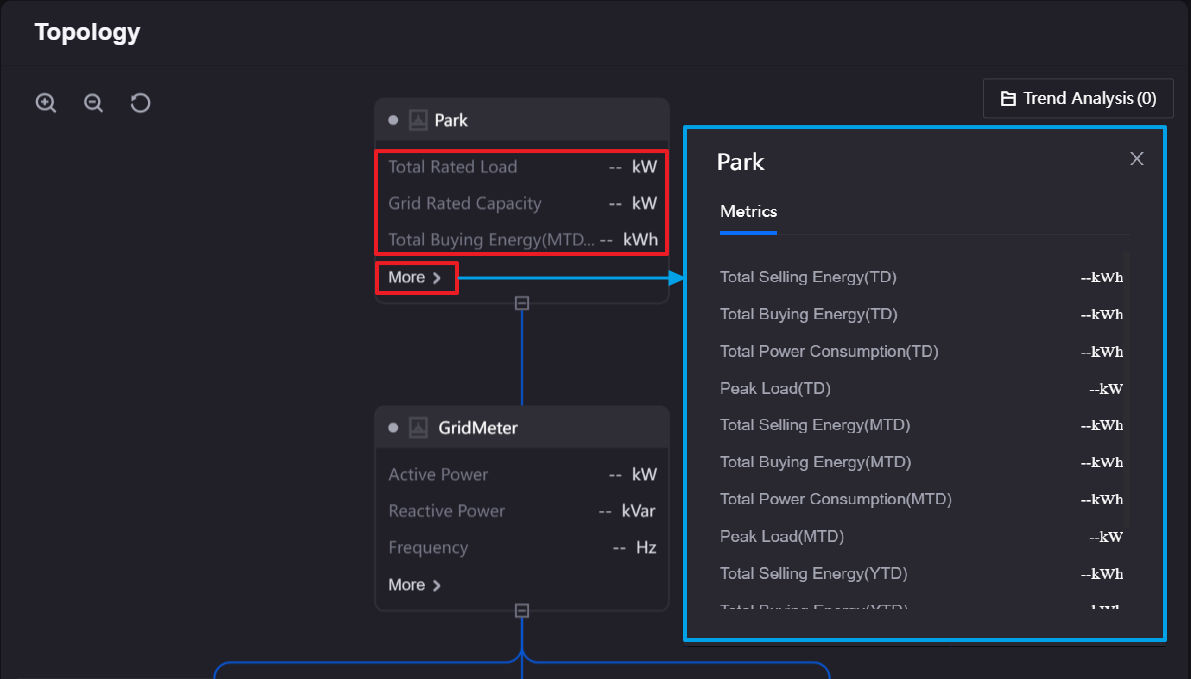
For example, when using the Topology widget of Digital Twin Visualization, you can customize the content and display fields of the indicators by following these steps:
Create business objects, dimensions, and other metadata at the global level in Configuration Center.
Create indicators using Common Data Service or Metric Management.
Synchronize the indicators to asset elements at the global level in Configuration Center for unified management.
Assign the required asset elements and business objects to the current onboarding template to ensure that the application can obtain and display indicator information.
Customize the display fields for the required business objects in the business object menu at the OU level in Configuration Center.
The following figure shows the Topology widget of Digital Twin Visualization. The display name and order of the “Park” site data displayed on the widget are determined by the “Common Fields (key: generalinfo)” field group, and the measurement point names displayed in the “More” popup window are determined by the “More Group (key: moreinfo)” field group.