What’s New in R2408?
This section introduces the new services and features included in EnOS R2408.
Application Building
Application Portal
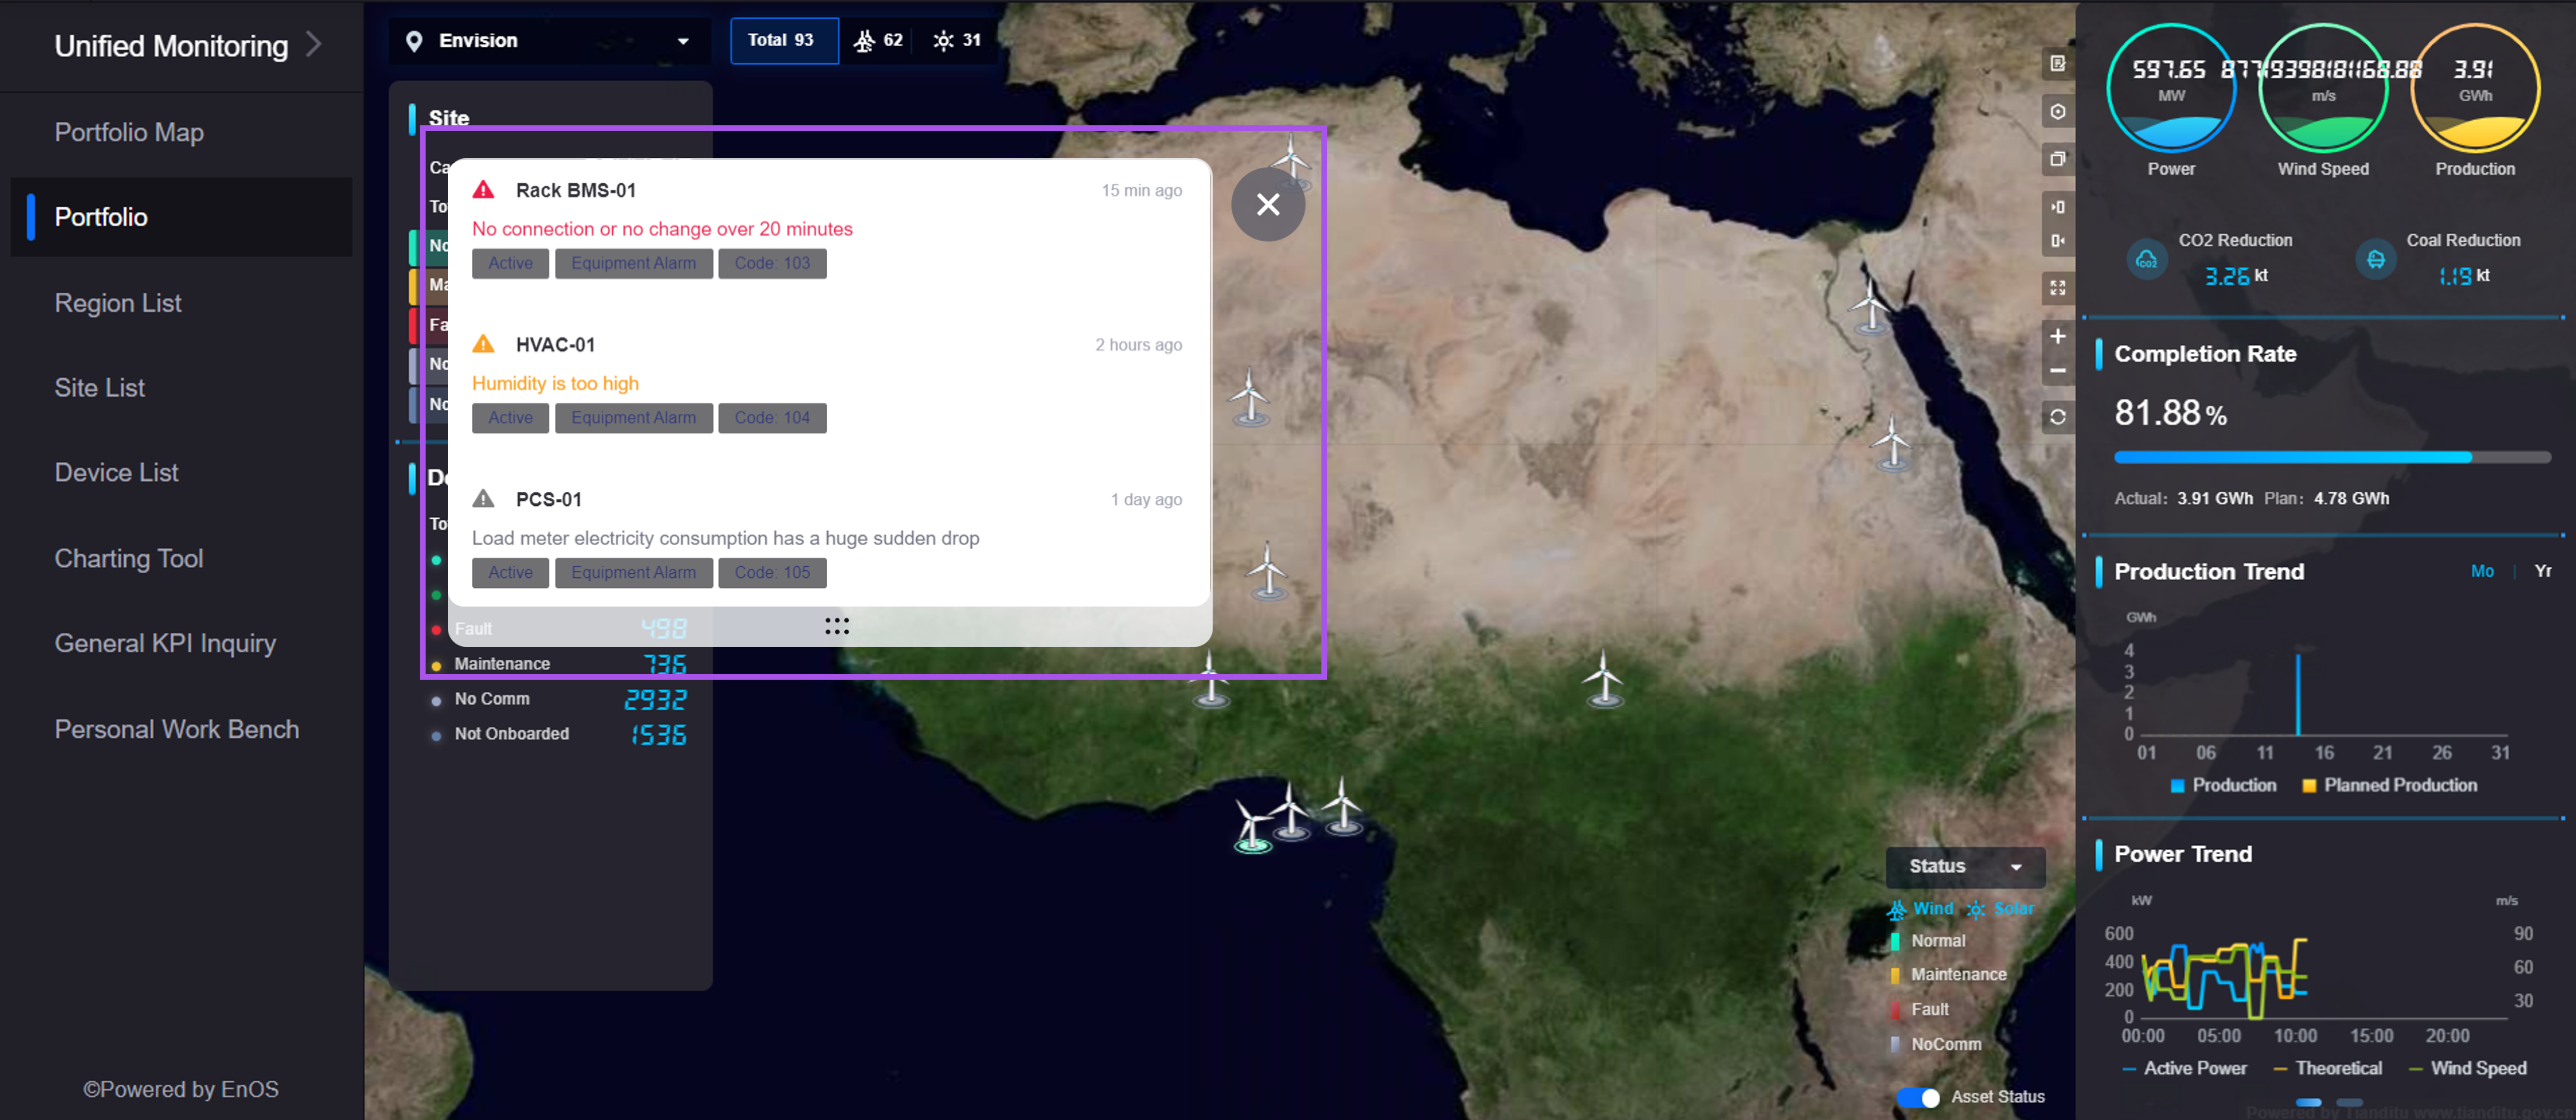
Application creators can now add pop-up windows and set their trigger conditions, contents, and styles through Application Portal SDK. When a user logs in to an OU, the pop-up window will automatically appear to push important information to the user in time.
Application creators can now configure whether the page is set to full screen by default, the full-screen style, and the default display language, either through Application Portal SDK or by modifying the login URL of SSO users.
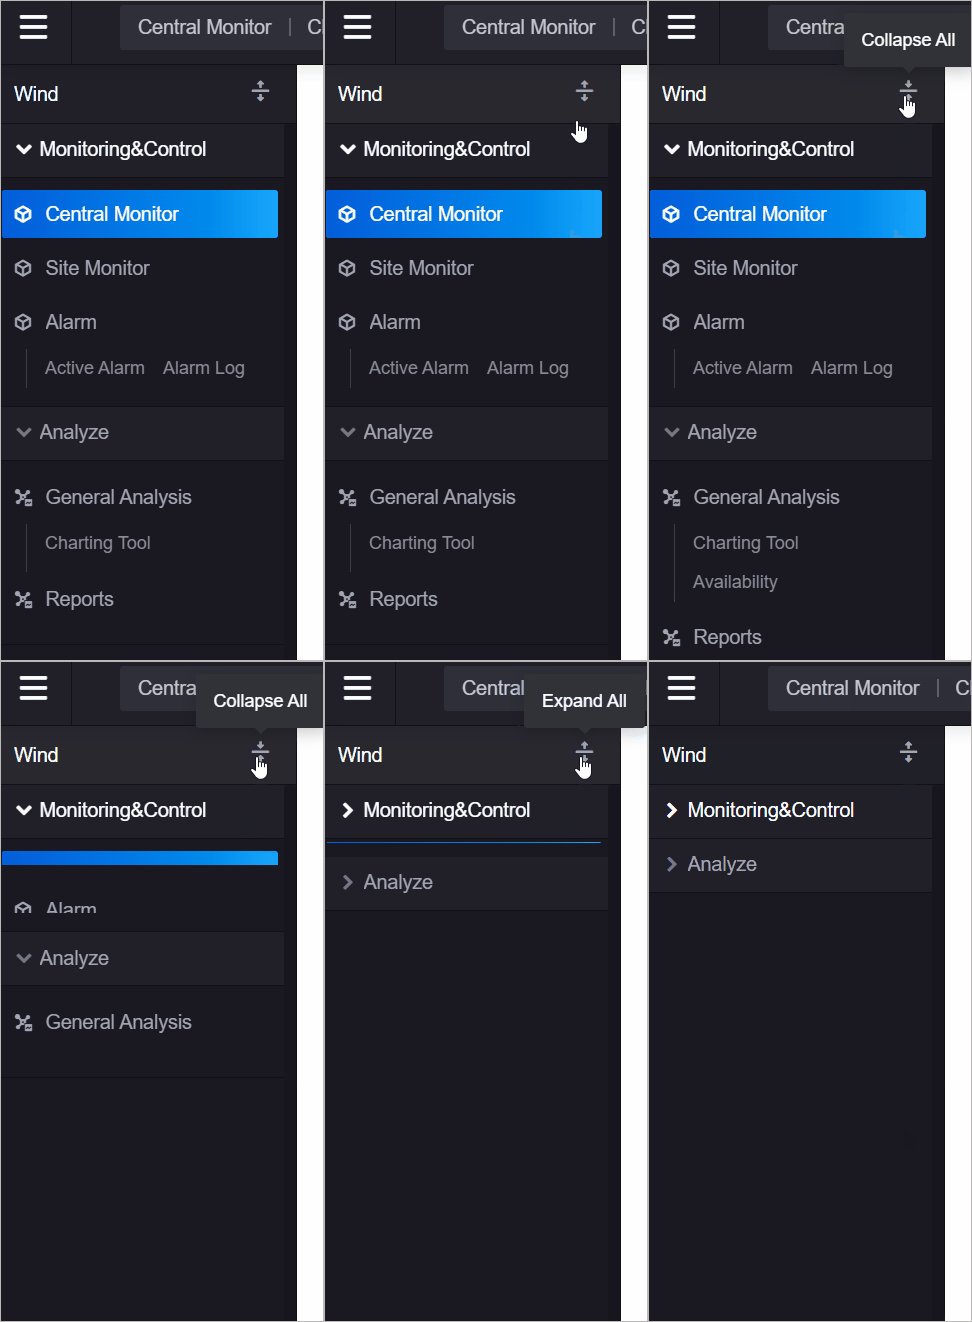
In New Navigation, applications will be displayed in a tiled layout on the left sidebar, organized by application categories. Through the newly added Expand/Collapse All button, users can expand and collapse all menus under a category with one click to locate function entrances easily.
Digital Twin Visualization
Added the DTV Center menu to integrate commonly used function entrances to improve visualization page building and management efficiency.

Added documentation entries for key configuration items to help application creators quickly learn the details of page configuration steps.
Added Groups for resources in Digital Twin Visualization to facilitate application creators in different domains to create and manage projects, pages, and templates in their respective domains within the same OU, achieving permission isolation within the OU.
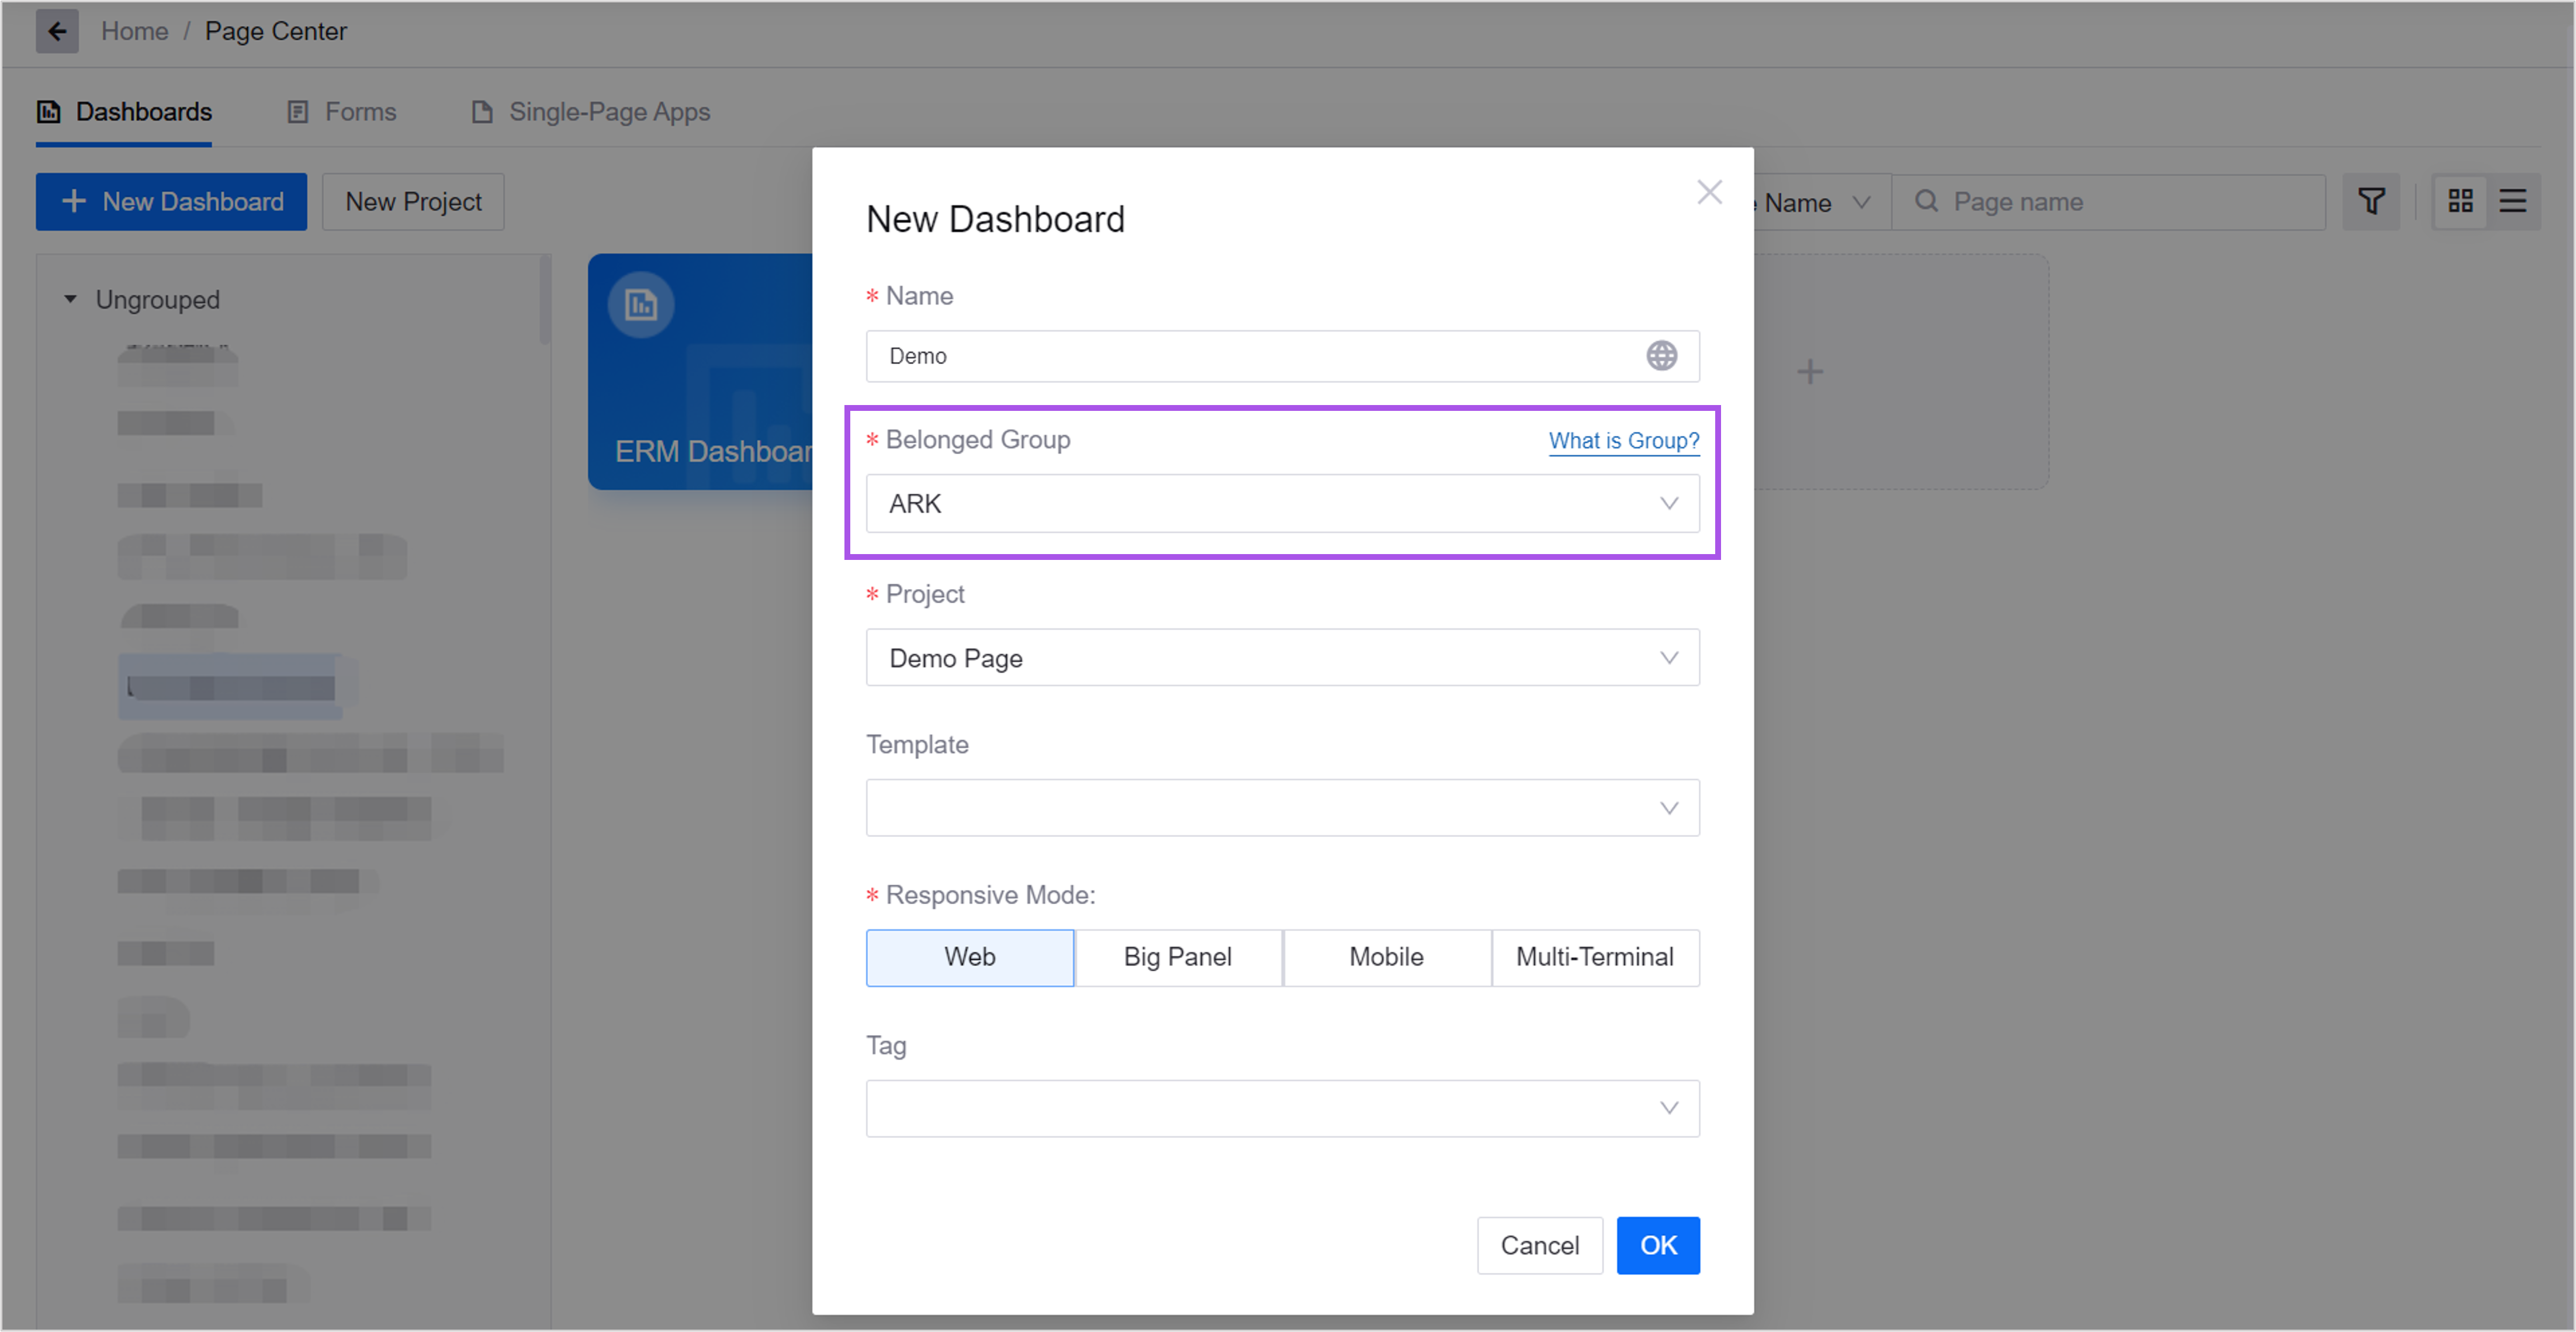
Added the Single-Page Application page type:
Application creators can now integrate multiple dashboard pages into different canvases and layers on one page in a single-page application, and unify layers and data through navigators (filters and tabs). This will improve application building efficiency, and allow users to easily switch and explore different data views.
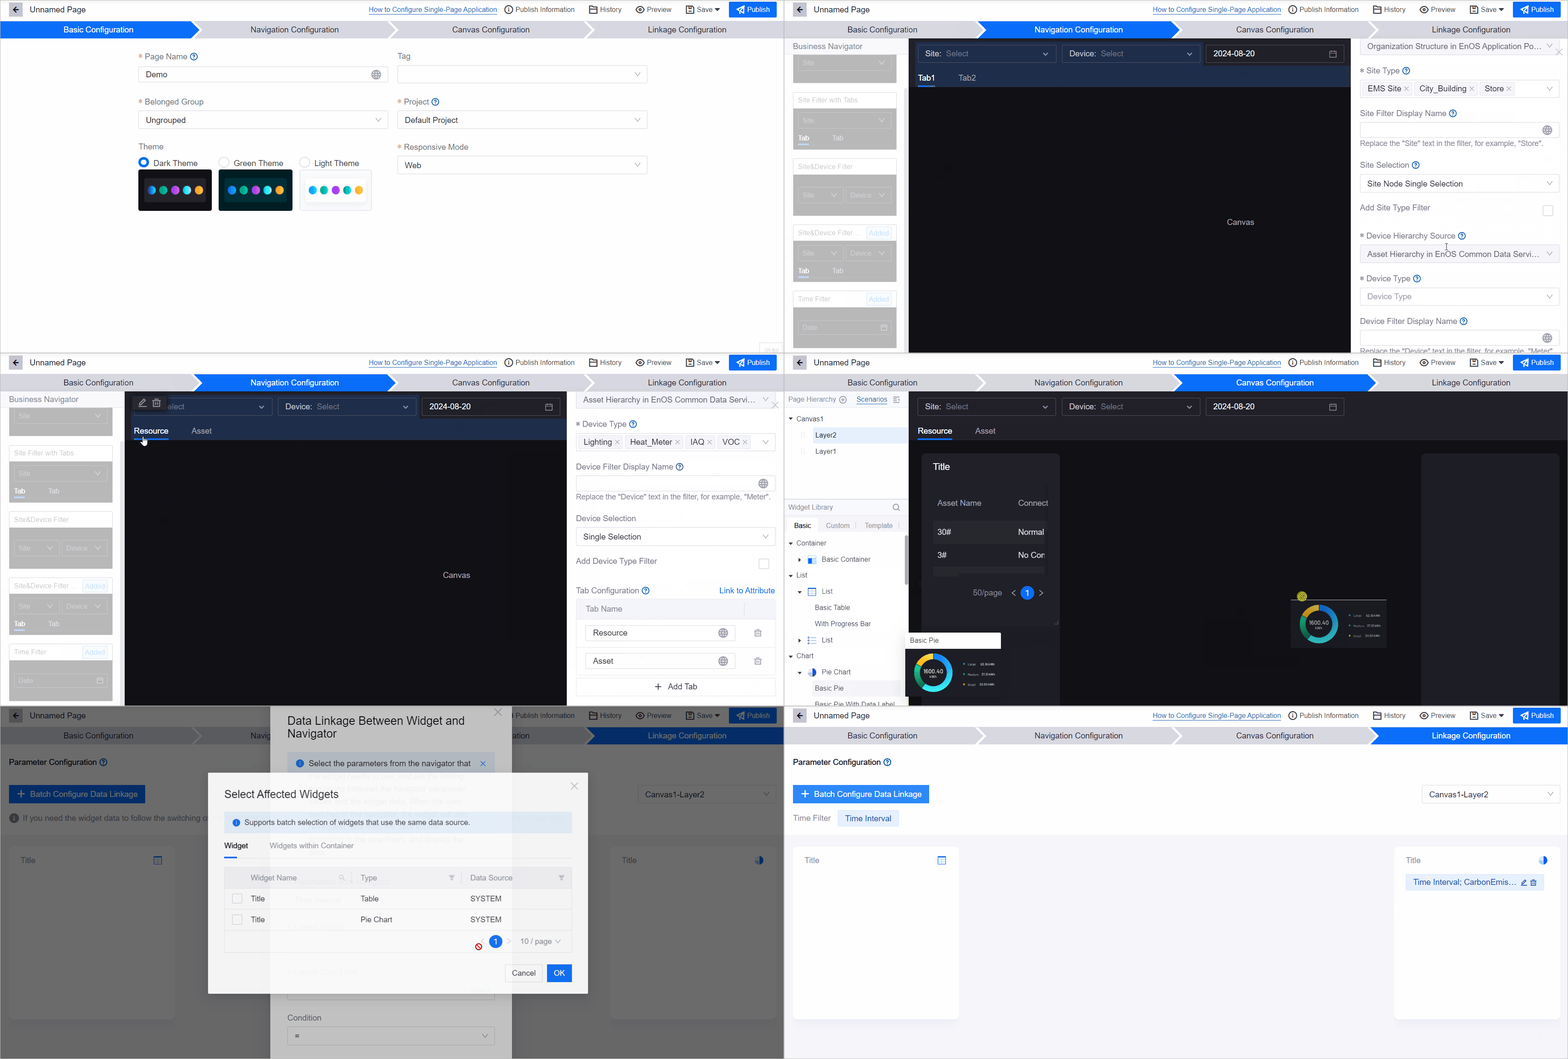
Users can now use navigators to switch layers and data simultaneously on one page, providing a more unified, flexible, and efficient data visualization experience.
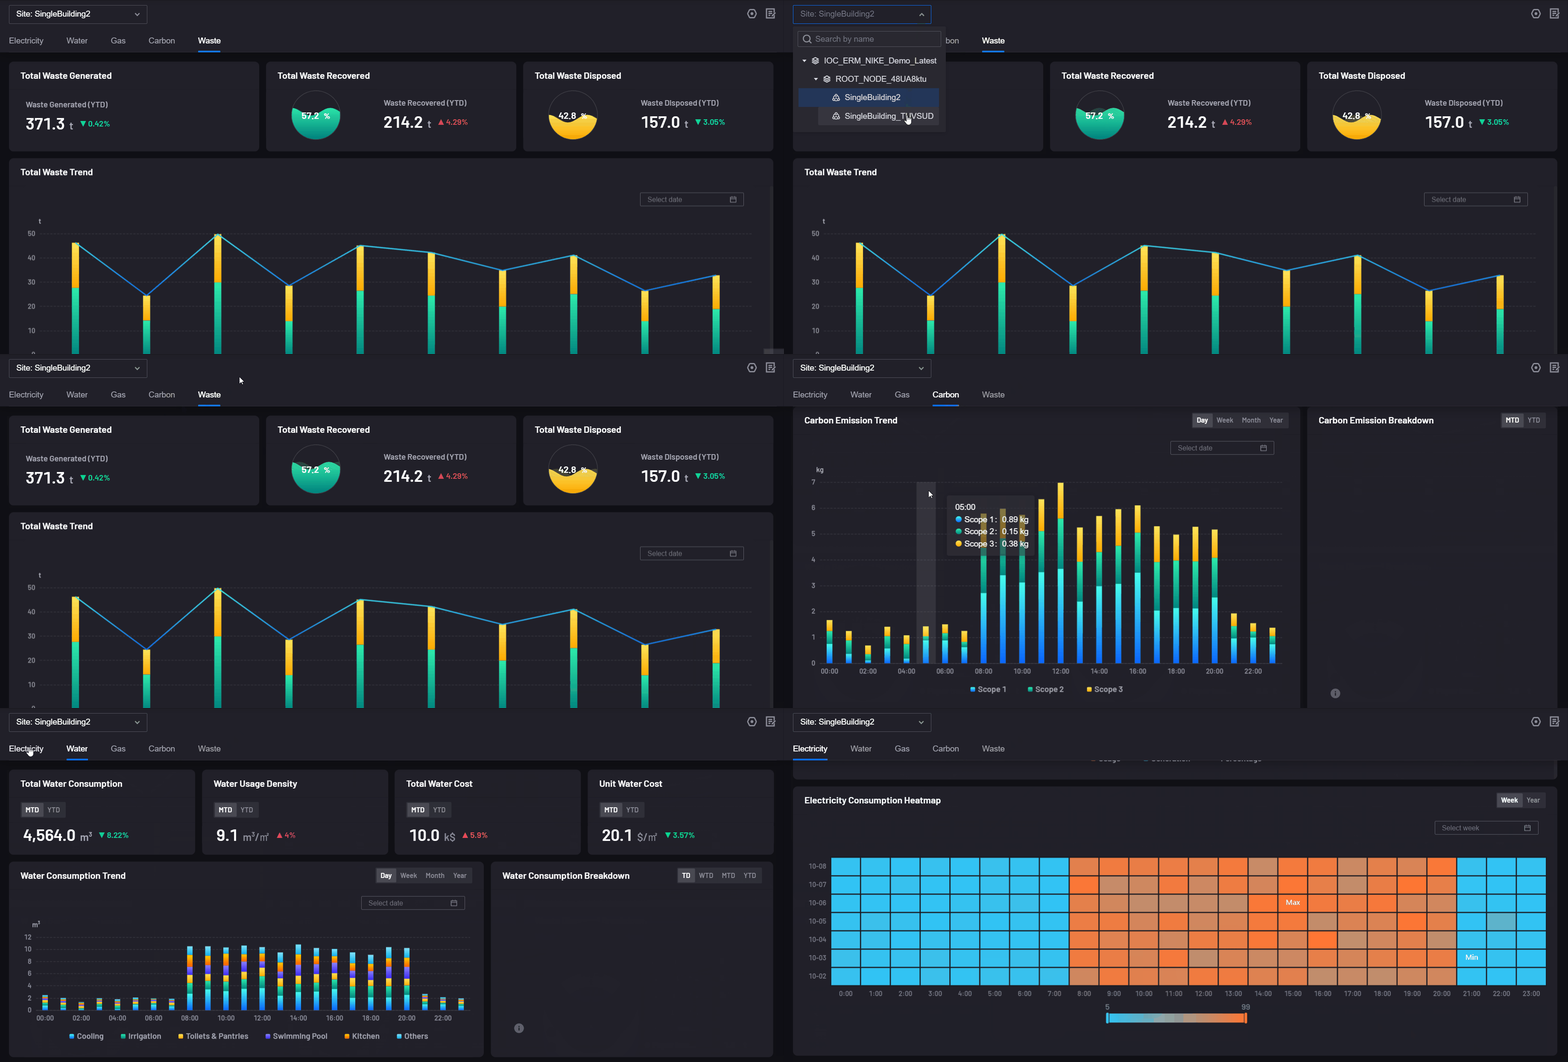
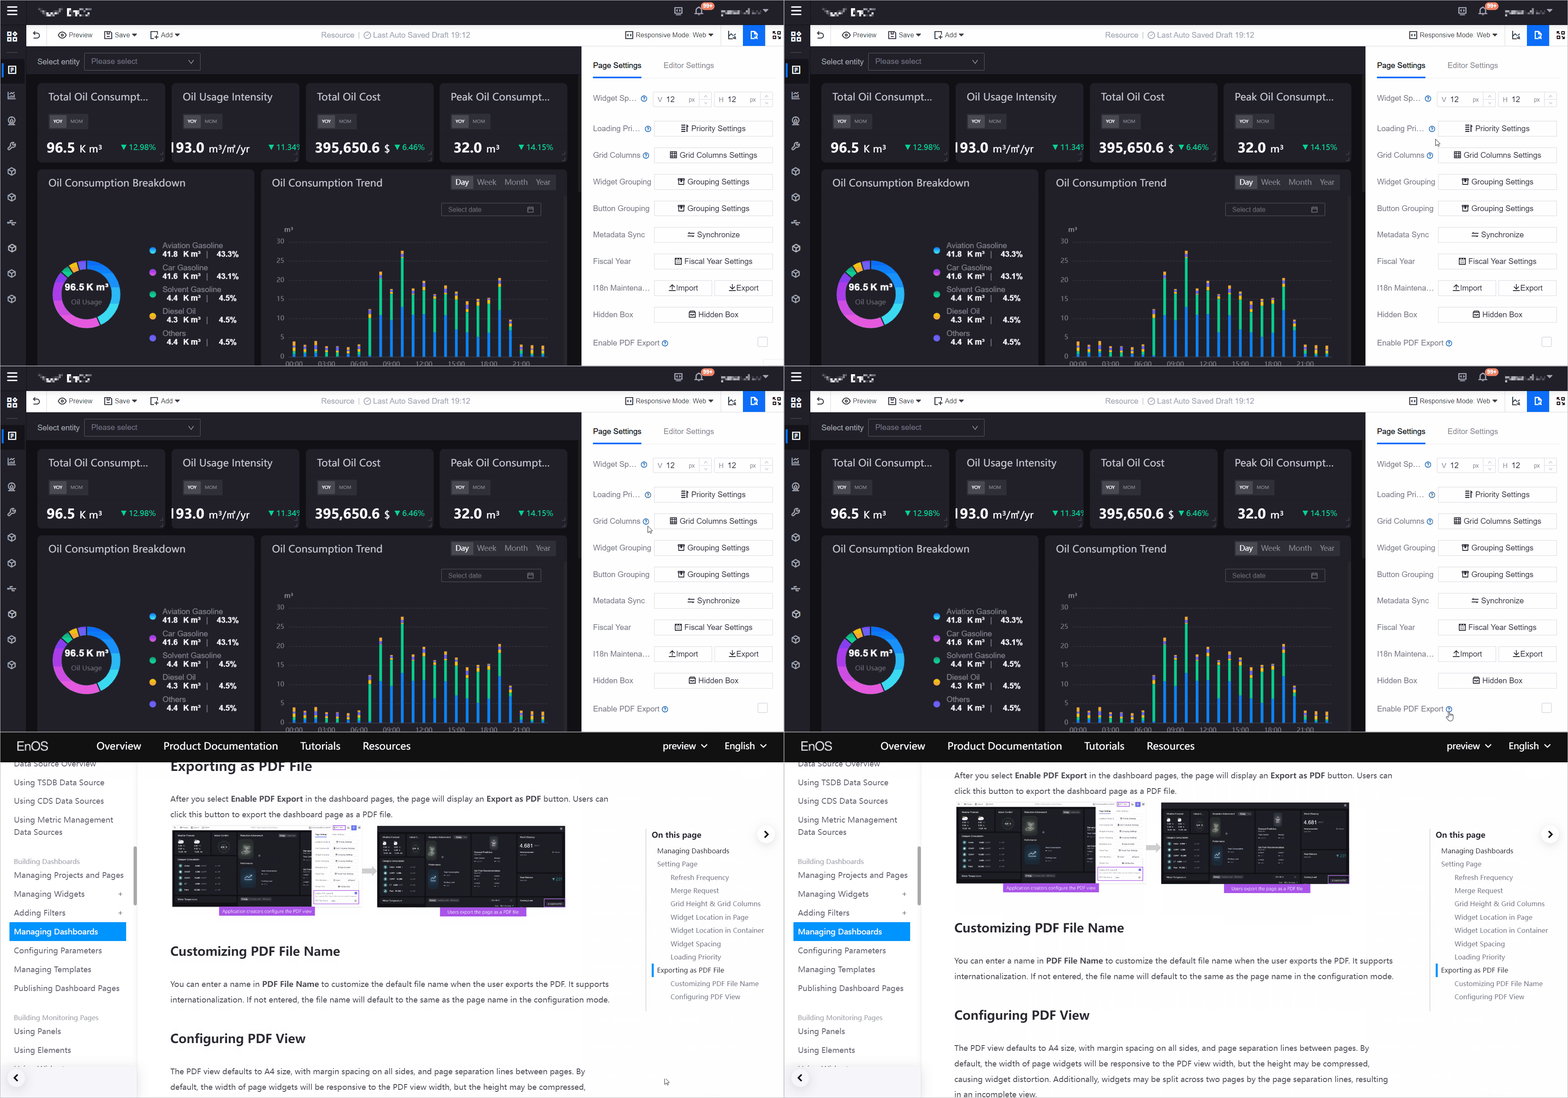
Added the Enable PDF Export option to dashboard pages. Application creators can adjust the style of the PDF view and define the default name of the exported PDF file. Users can export the dashboard page as a PDF file when viewing the page to view data visualization reports offline.

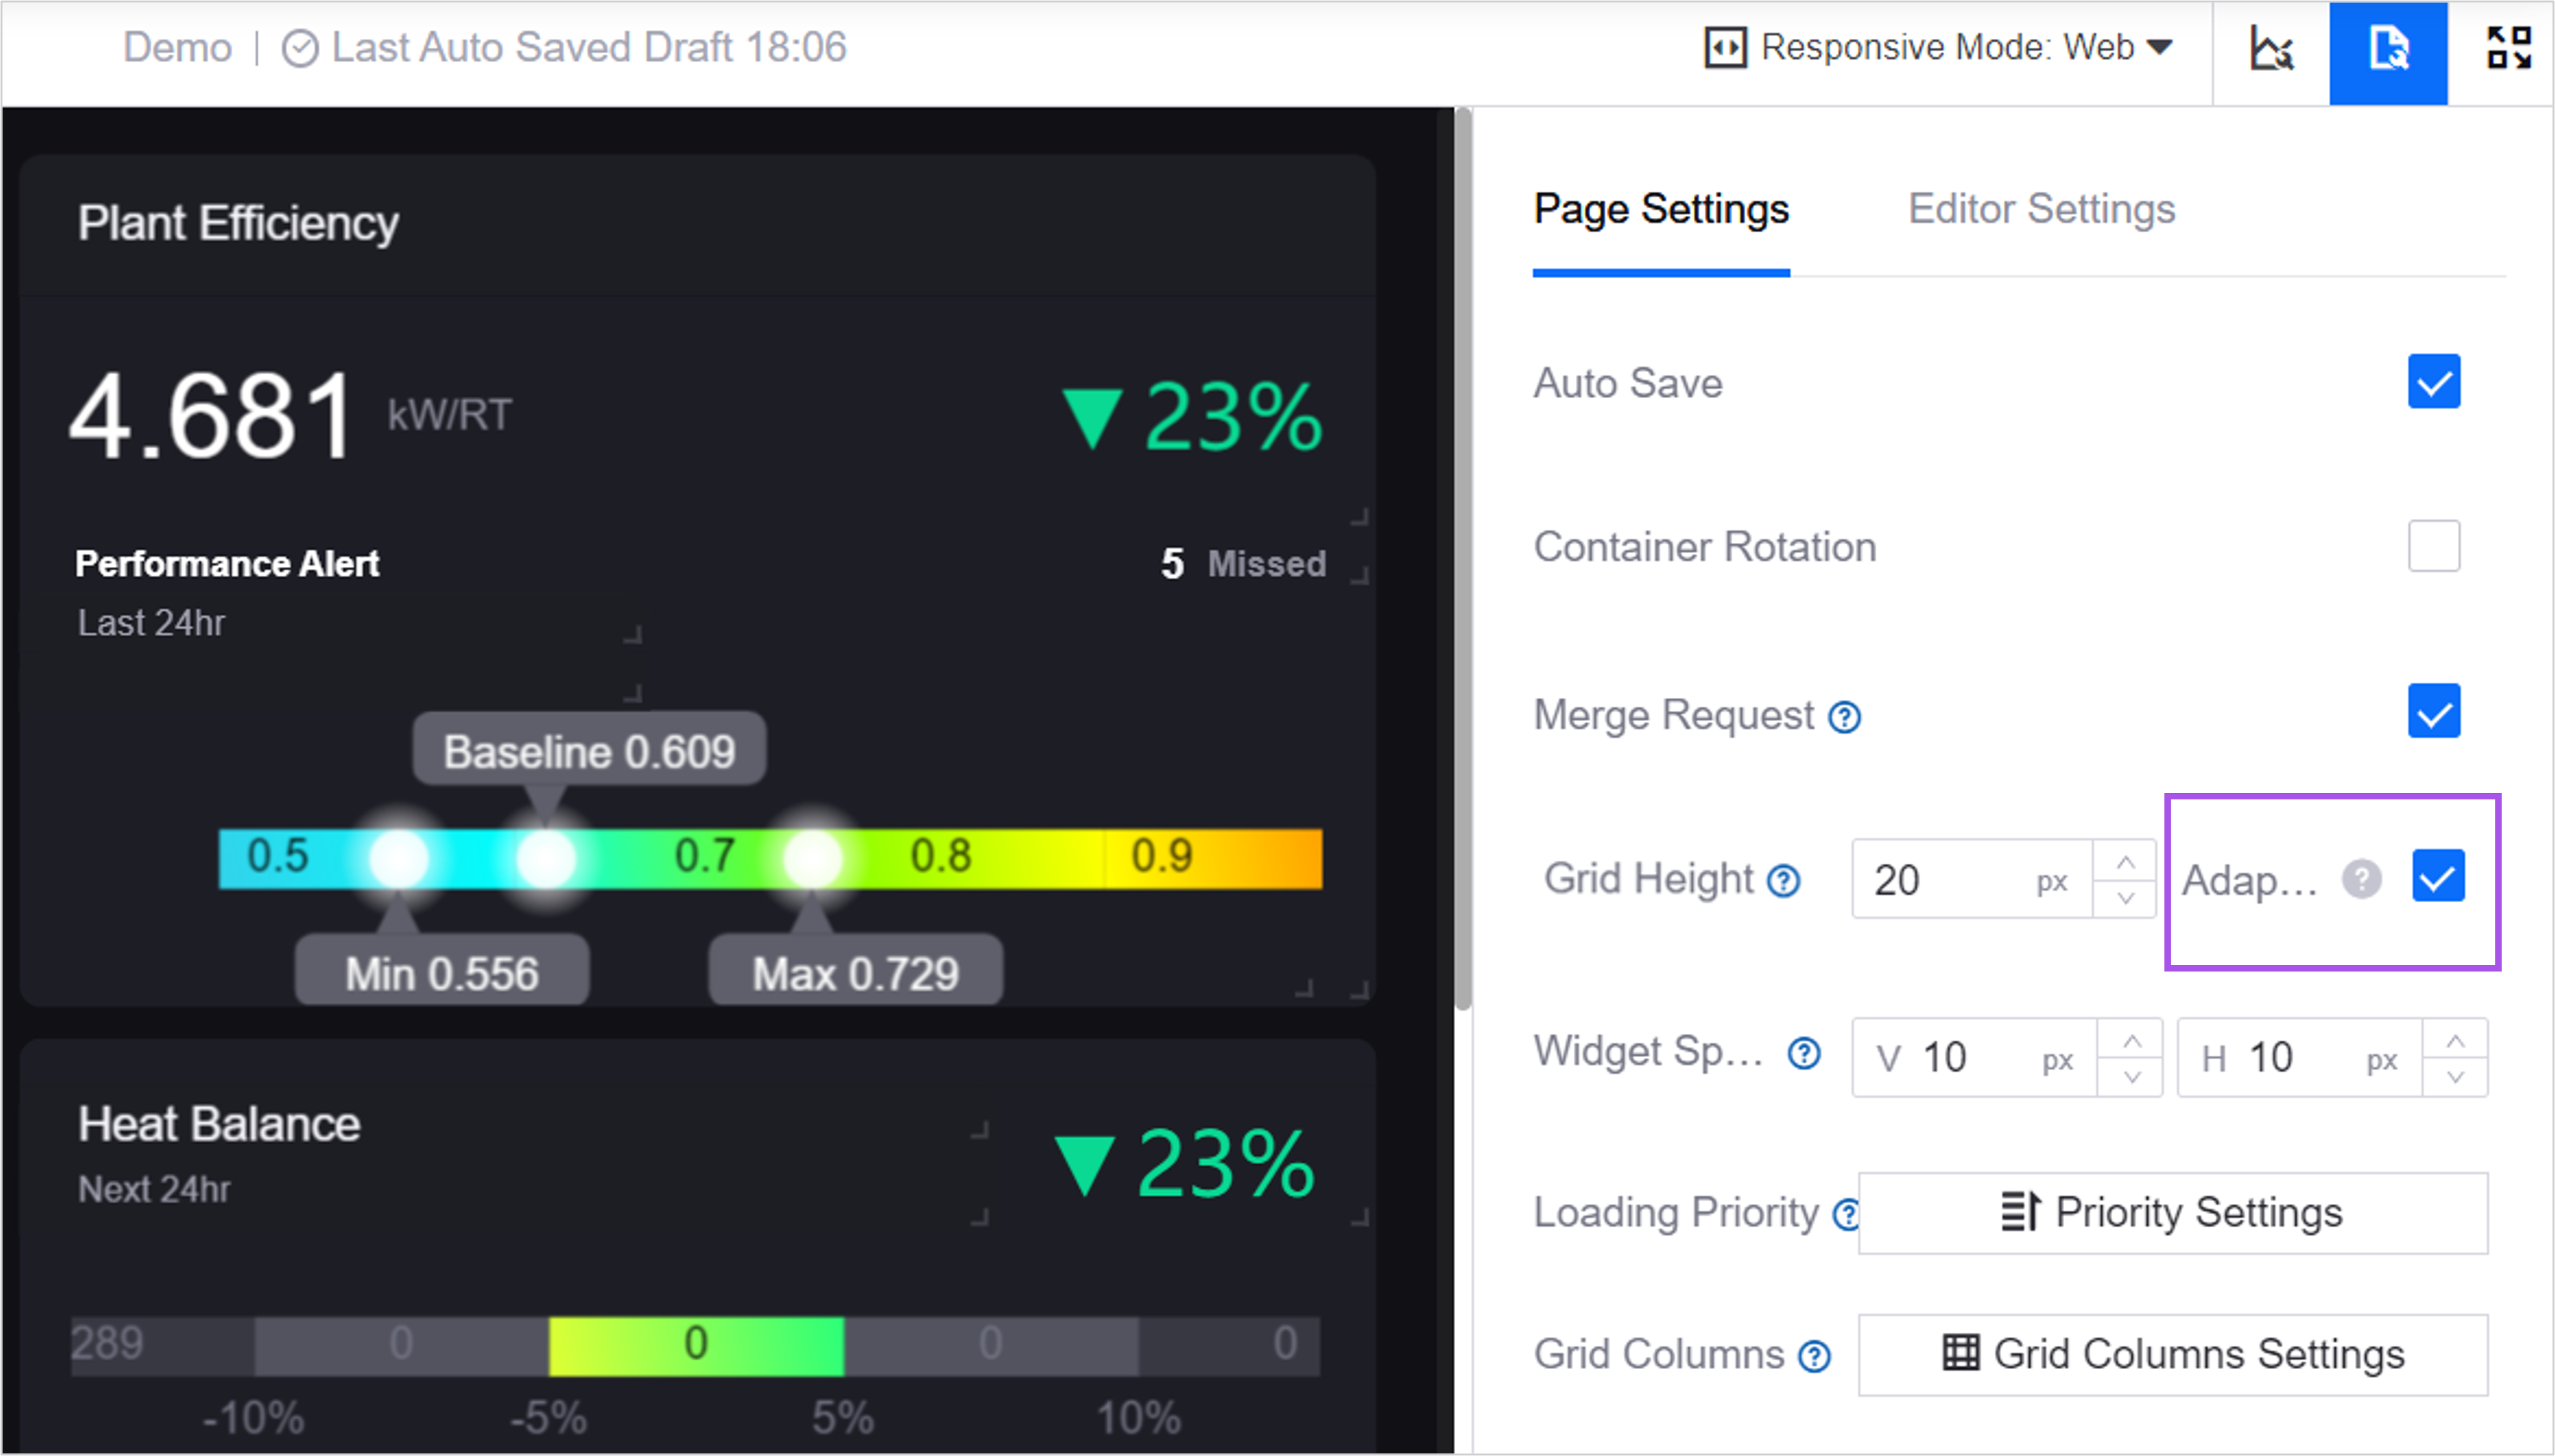
Application creators can now enable Adaptive page grid height in dashboard pages. Once enabled, the page will automatically calculate the grid height based on the screen height and the number of grids, adjusting the display size of widgets on the page to provide a better user browsing experience.
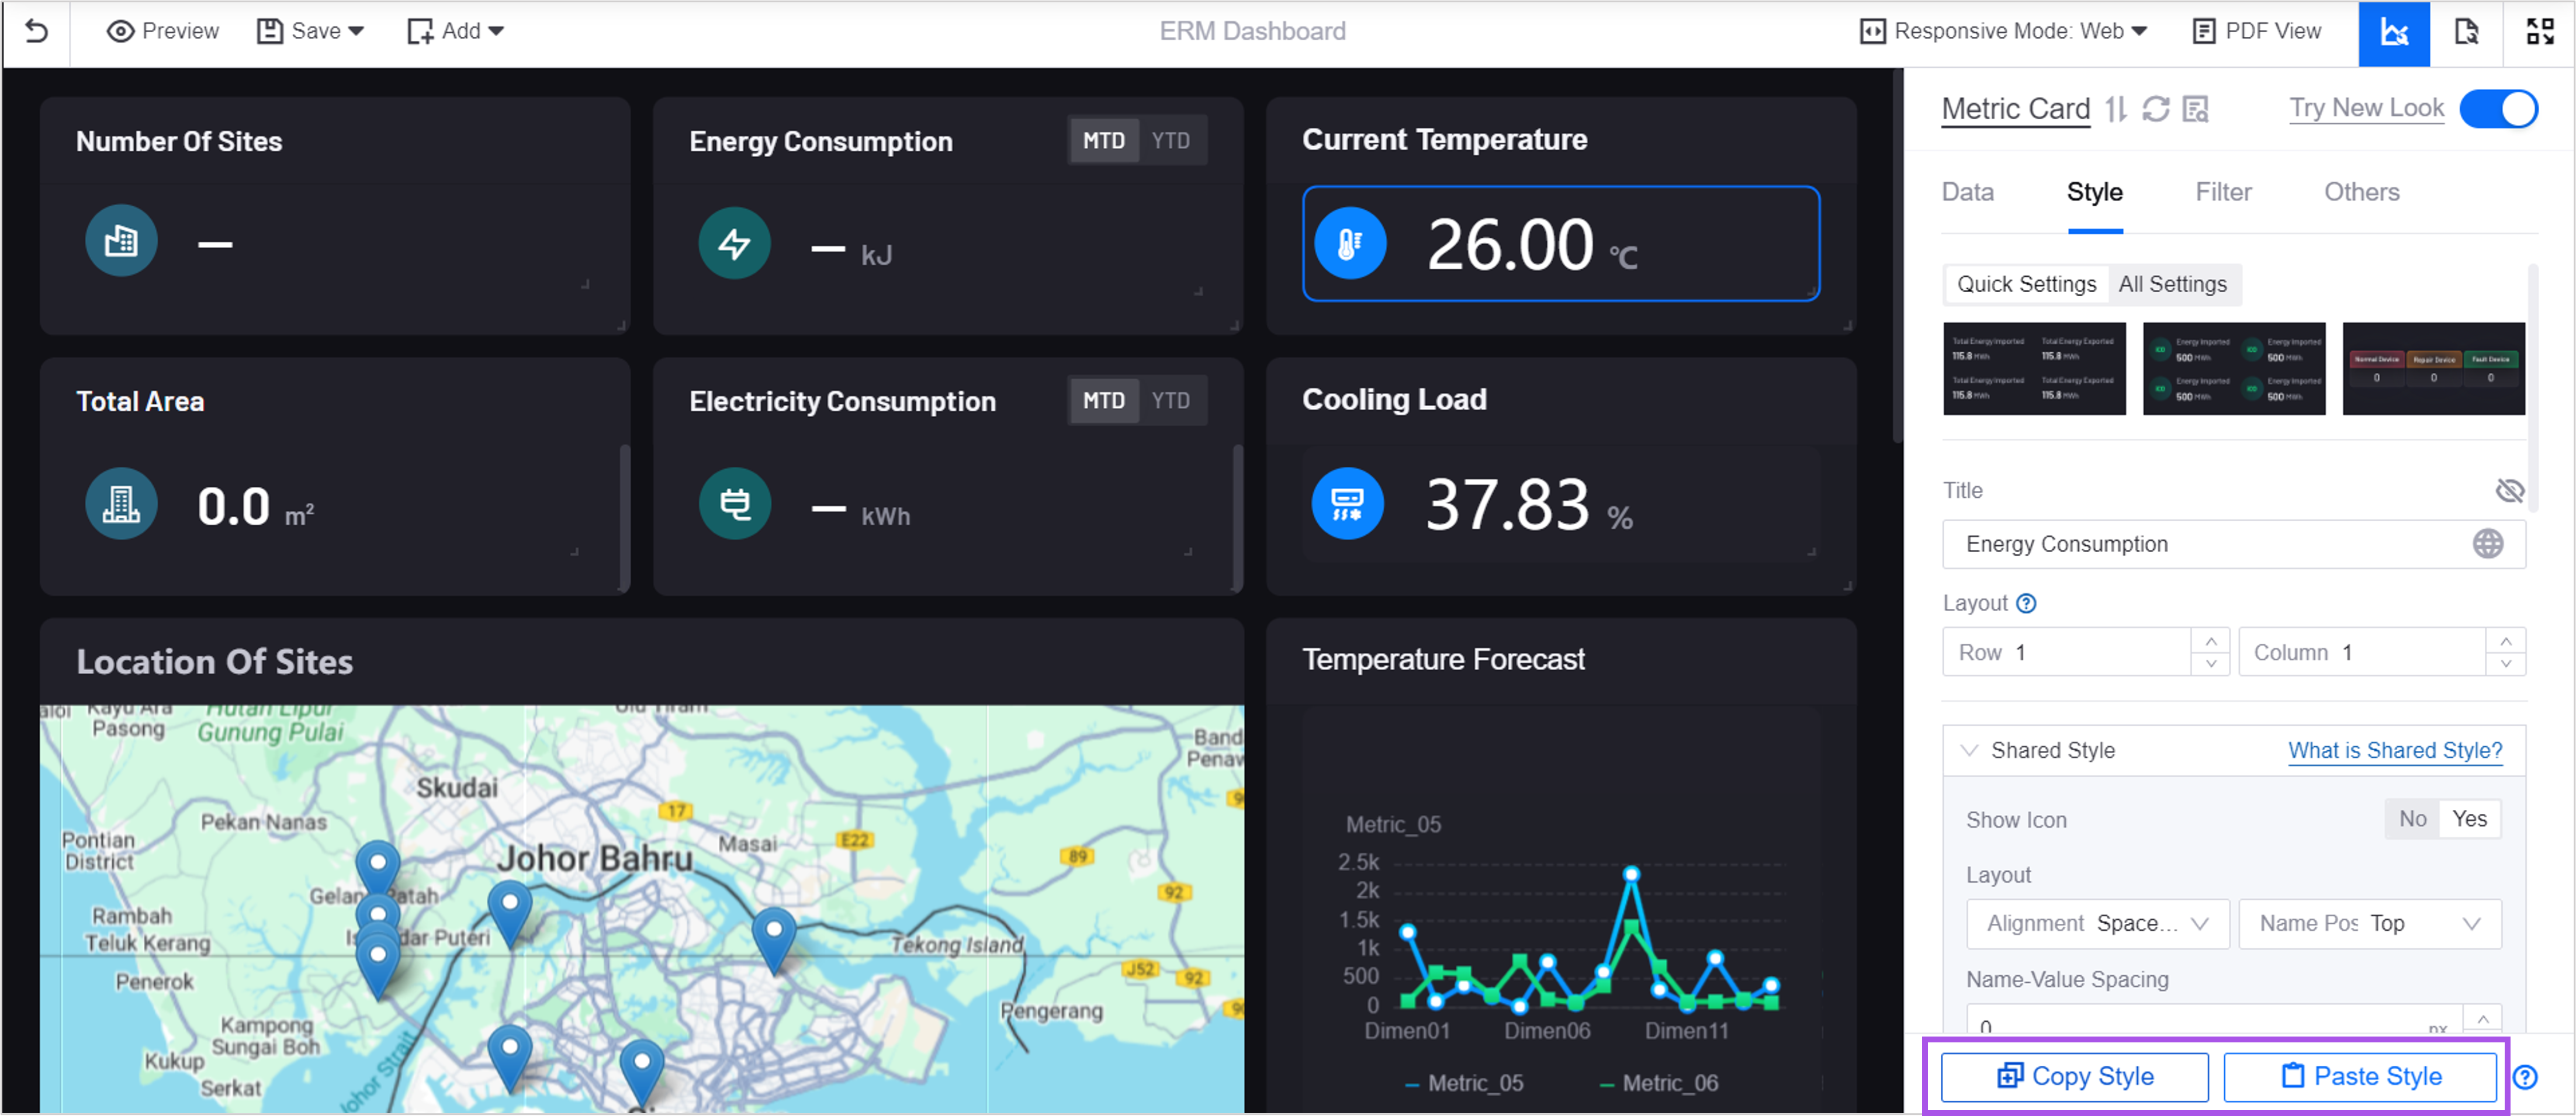
Added the Copy/Paste Style function to widgets. Application creators can now copy widget styles and paste them to the widgets of the same types to reduce duplicate configuration.
Added the Fleet Map widget:
Application creators can now build a visualization page with map interaction capabilities by adding this widget and configuring the map style, asset display, and popup interaction.
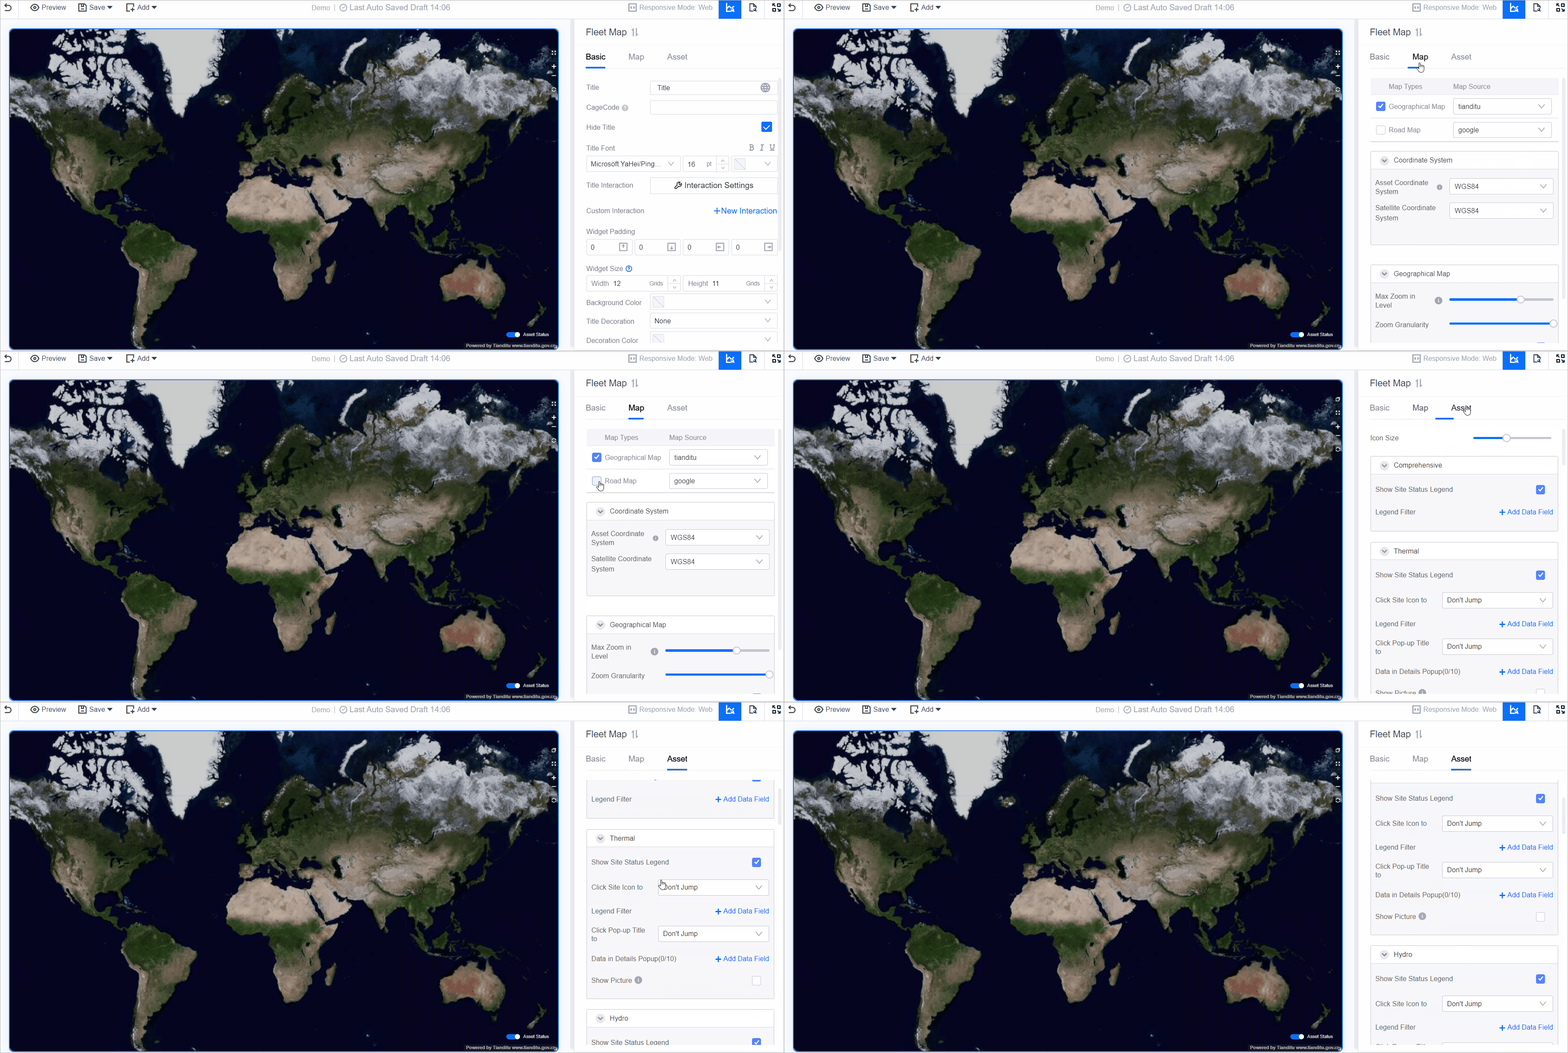
Users can now view the location of assets in various domains on the map, filter the displayed data, and view asset details in popups to obtain multi-level and multi-type asset distribution status and data.
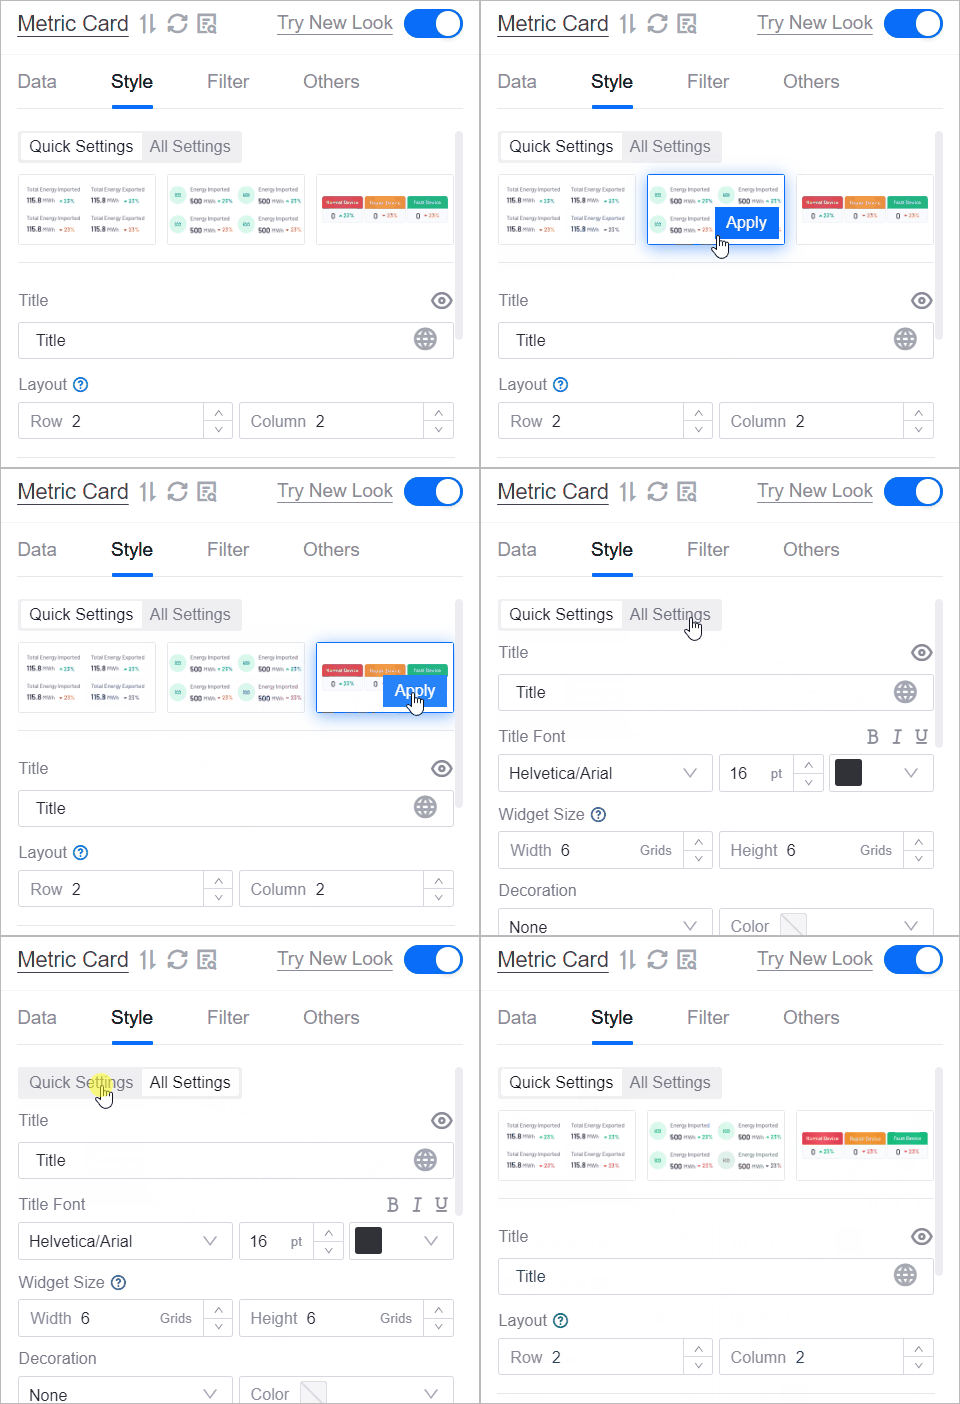
Application creators can now enable the new configuration panel in the Metric Card and Pie Chart widgets to reuse widget styles and simplify configuration process.
Application creators can now configure URL jump for the Alarm List widget, allowing users to jump to any URL. Application creators can also configure the opening method, such as Open in a Popup or Open in the Current Page, providing users with more flexible interaction options.
Unified Monitoring
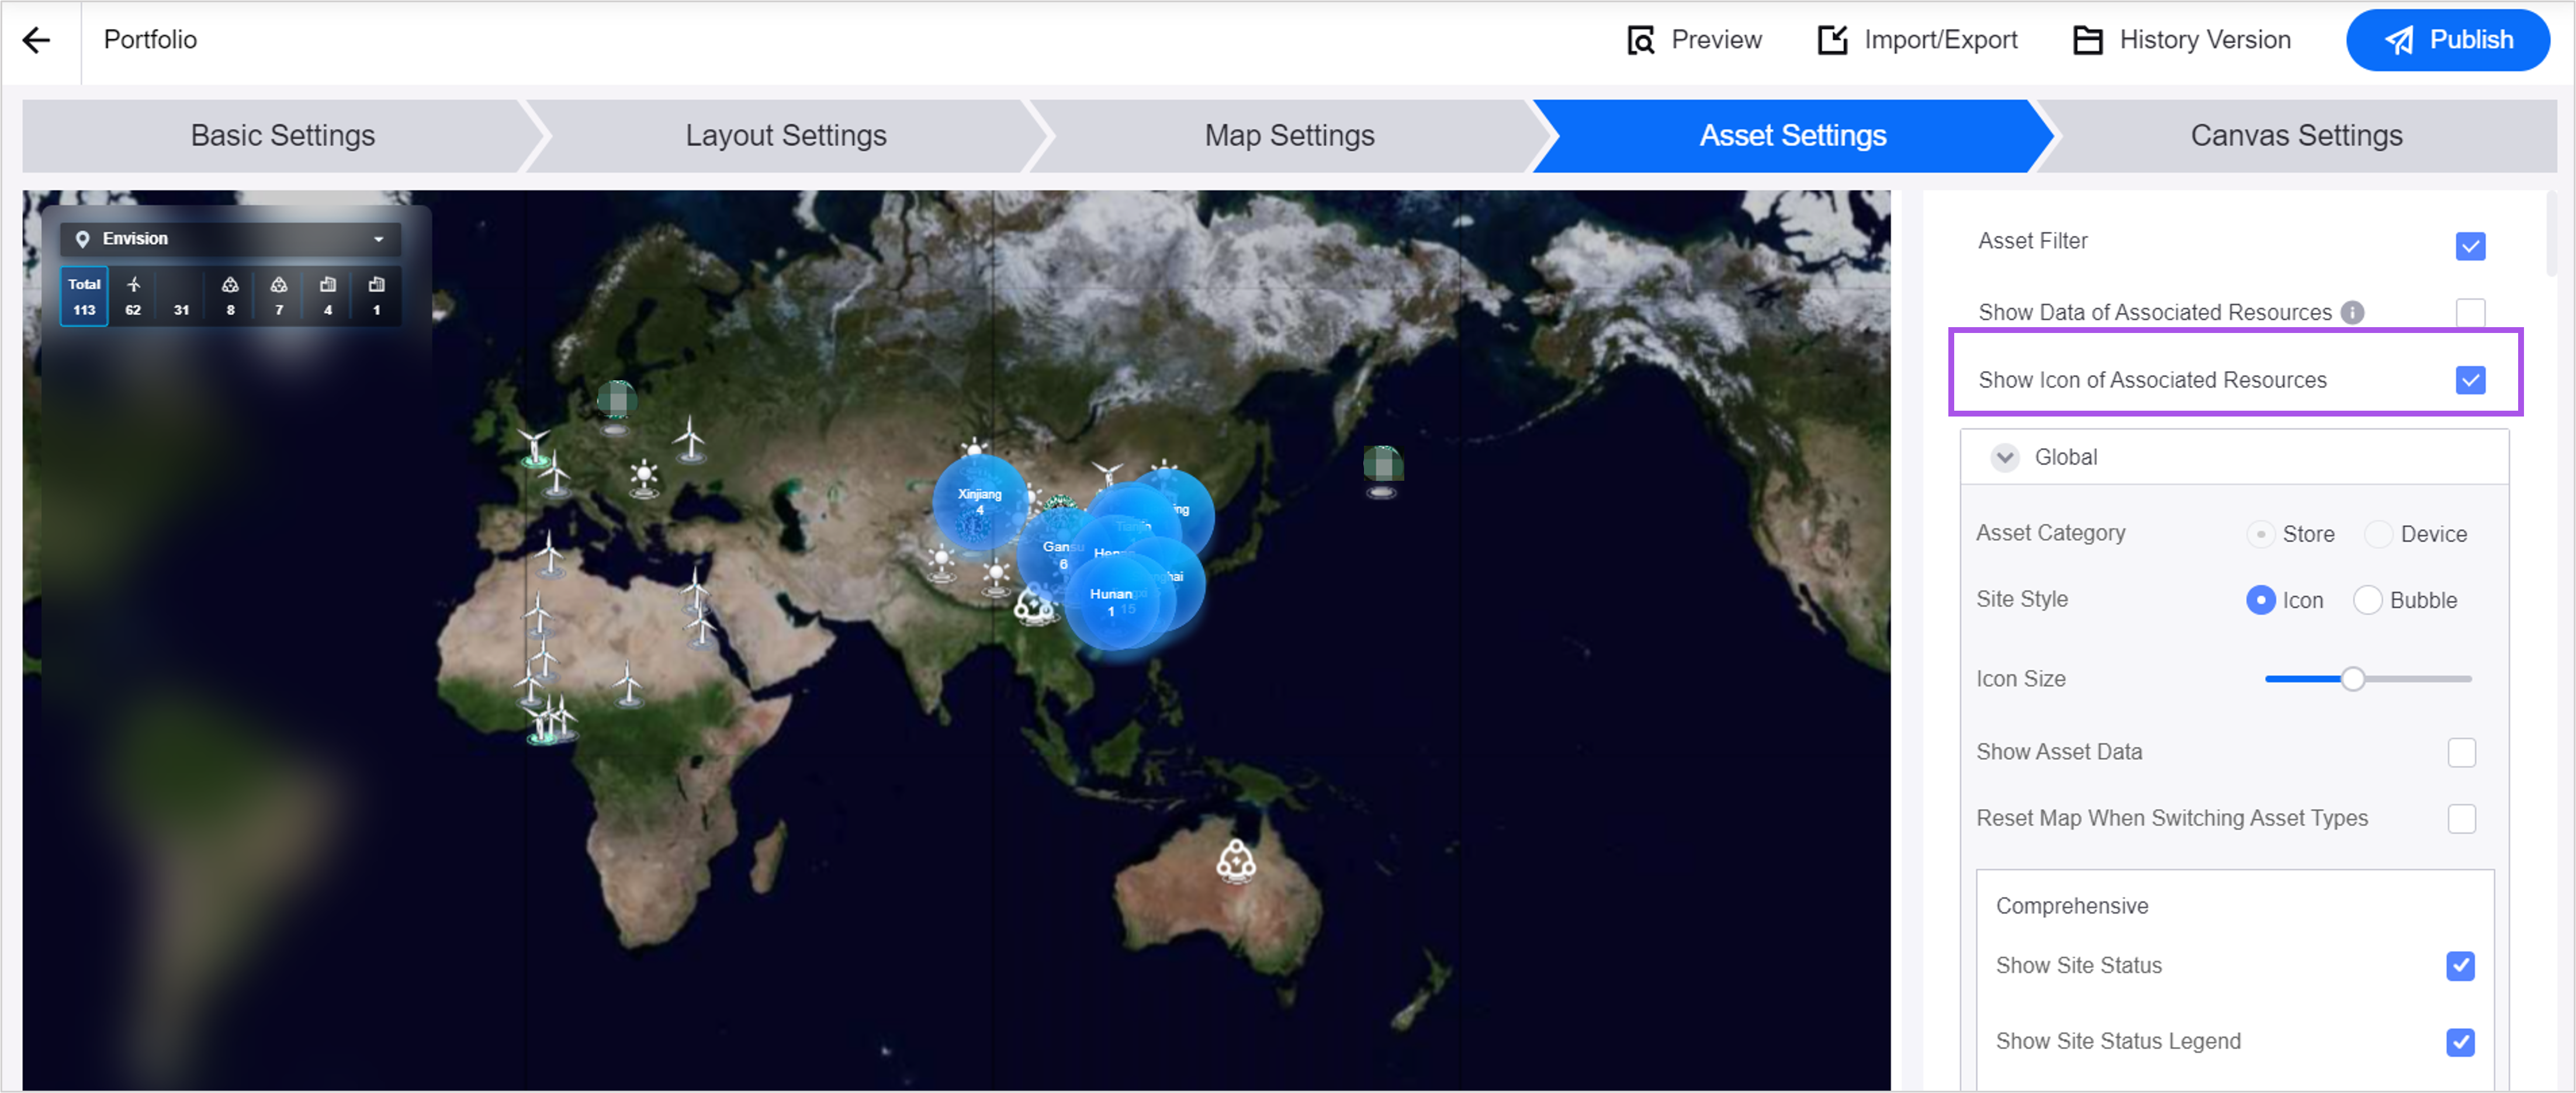
Added a new configuration item Show Icon of Associated Resources to the global map in Portfolio. After application creators enable it, if a node has associated resources in the organization structure, different types of icons will be displayed in the asset filter. When users select one of the group or region nodes in the asset filter, the locations of the assets associated with the node and its sub-nodes will be displayed on the map, intuitively presenting the asset distribution.
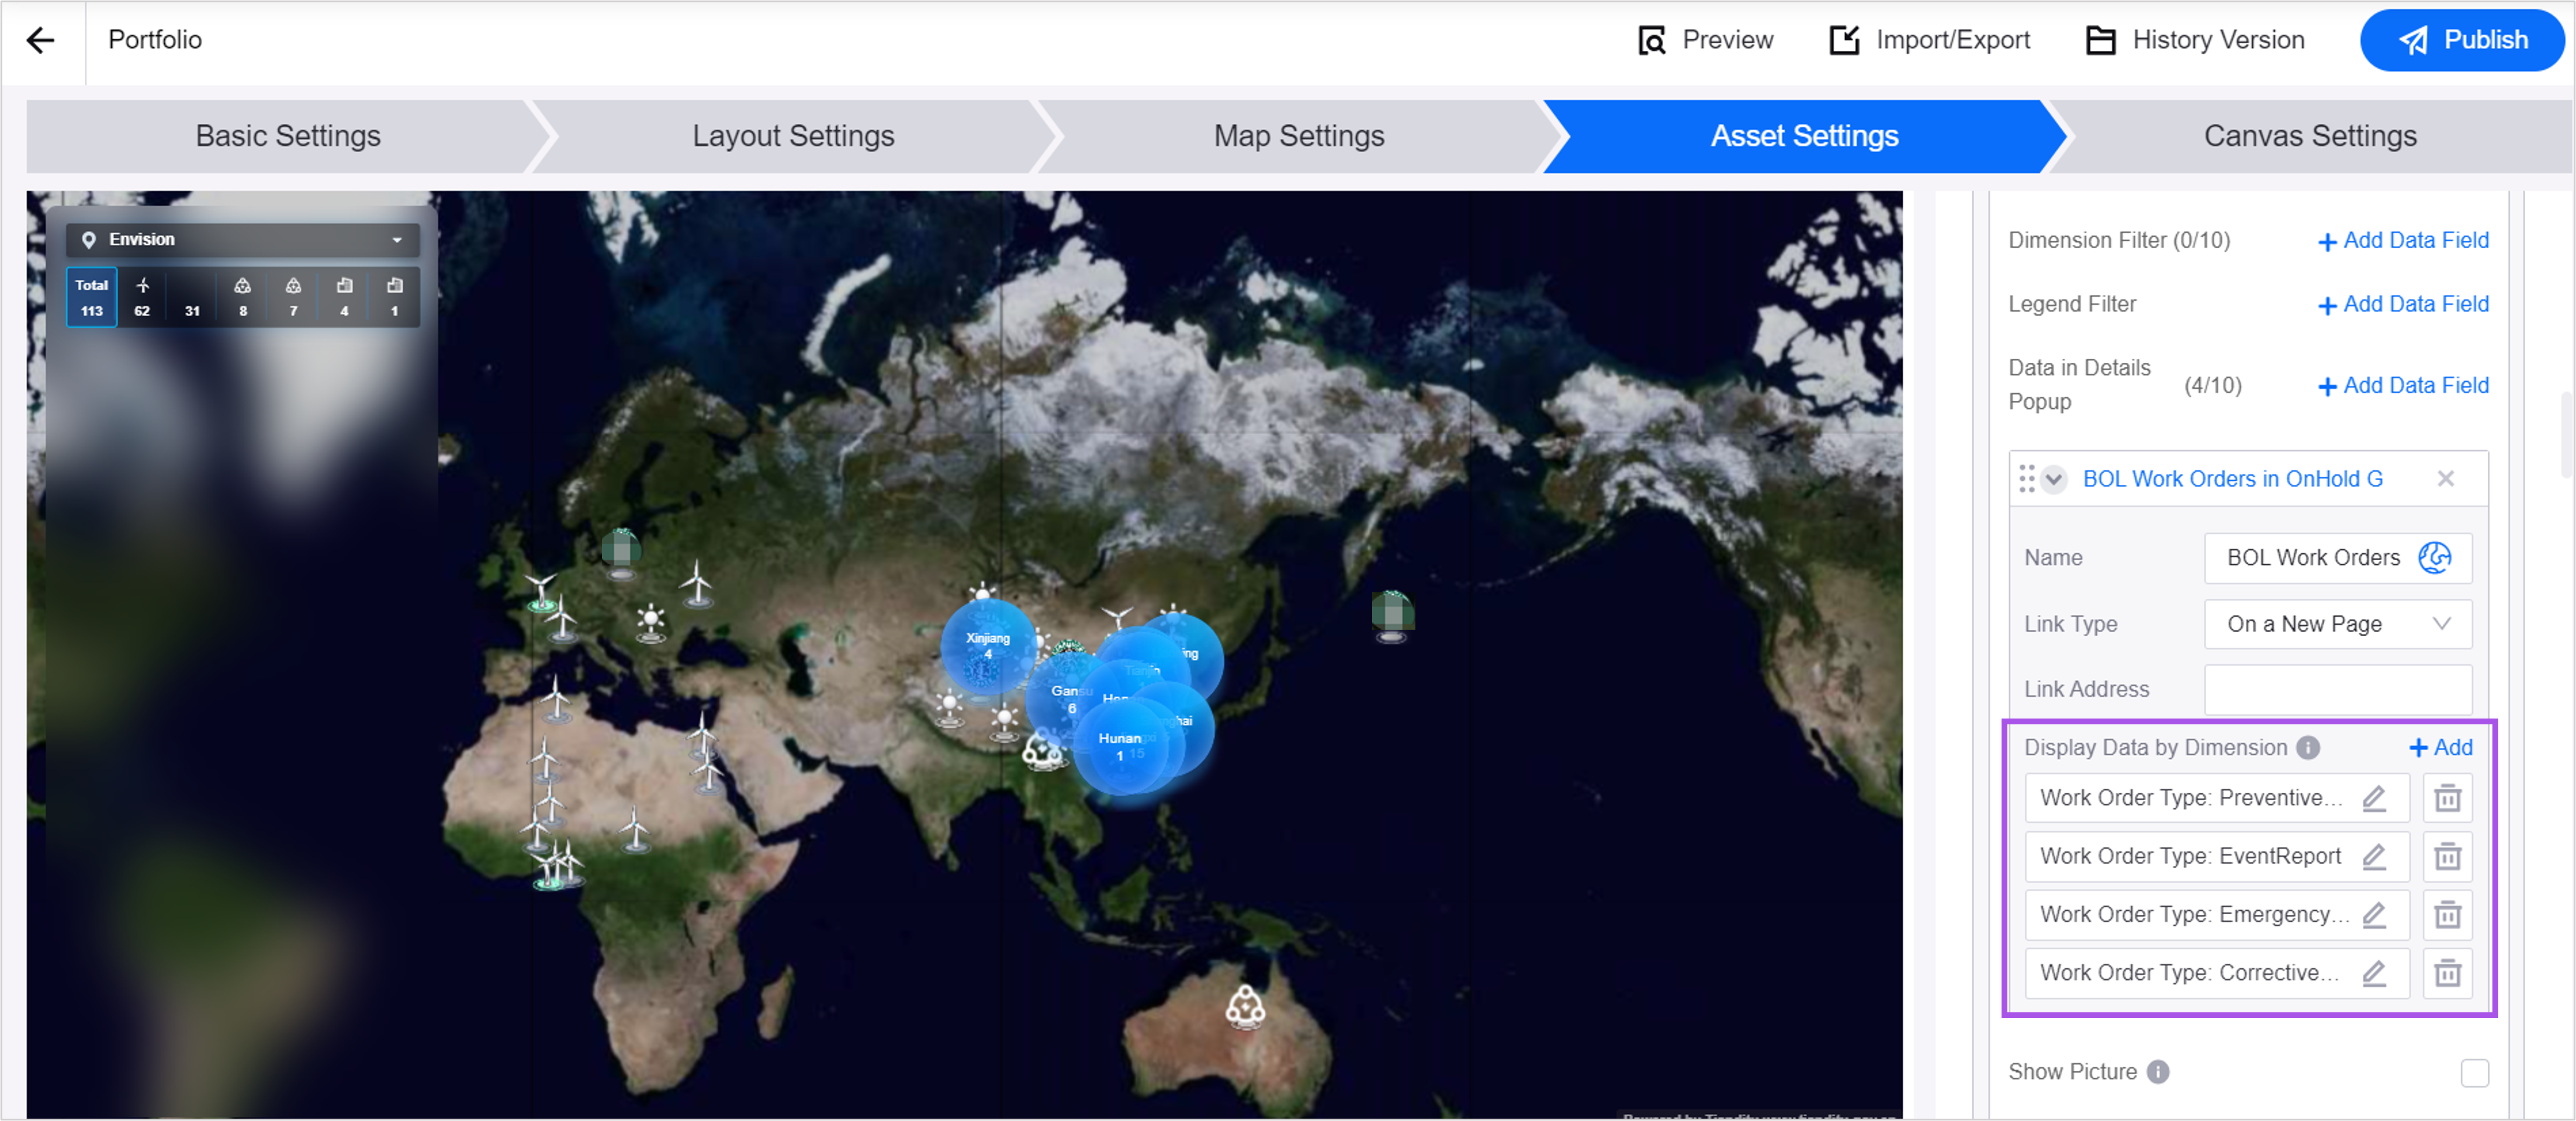
Added a new configuration item Display Data by Dimension in the site detail popup in Portfolio. Application creators can now add dimension types and dimension values to metrics. Users can now view the data of the same metric under different dimensions in the site detail popup, which can help them discover potential data patterns and trends.
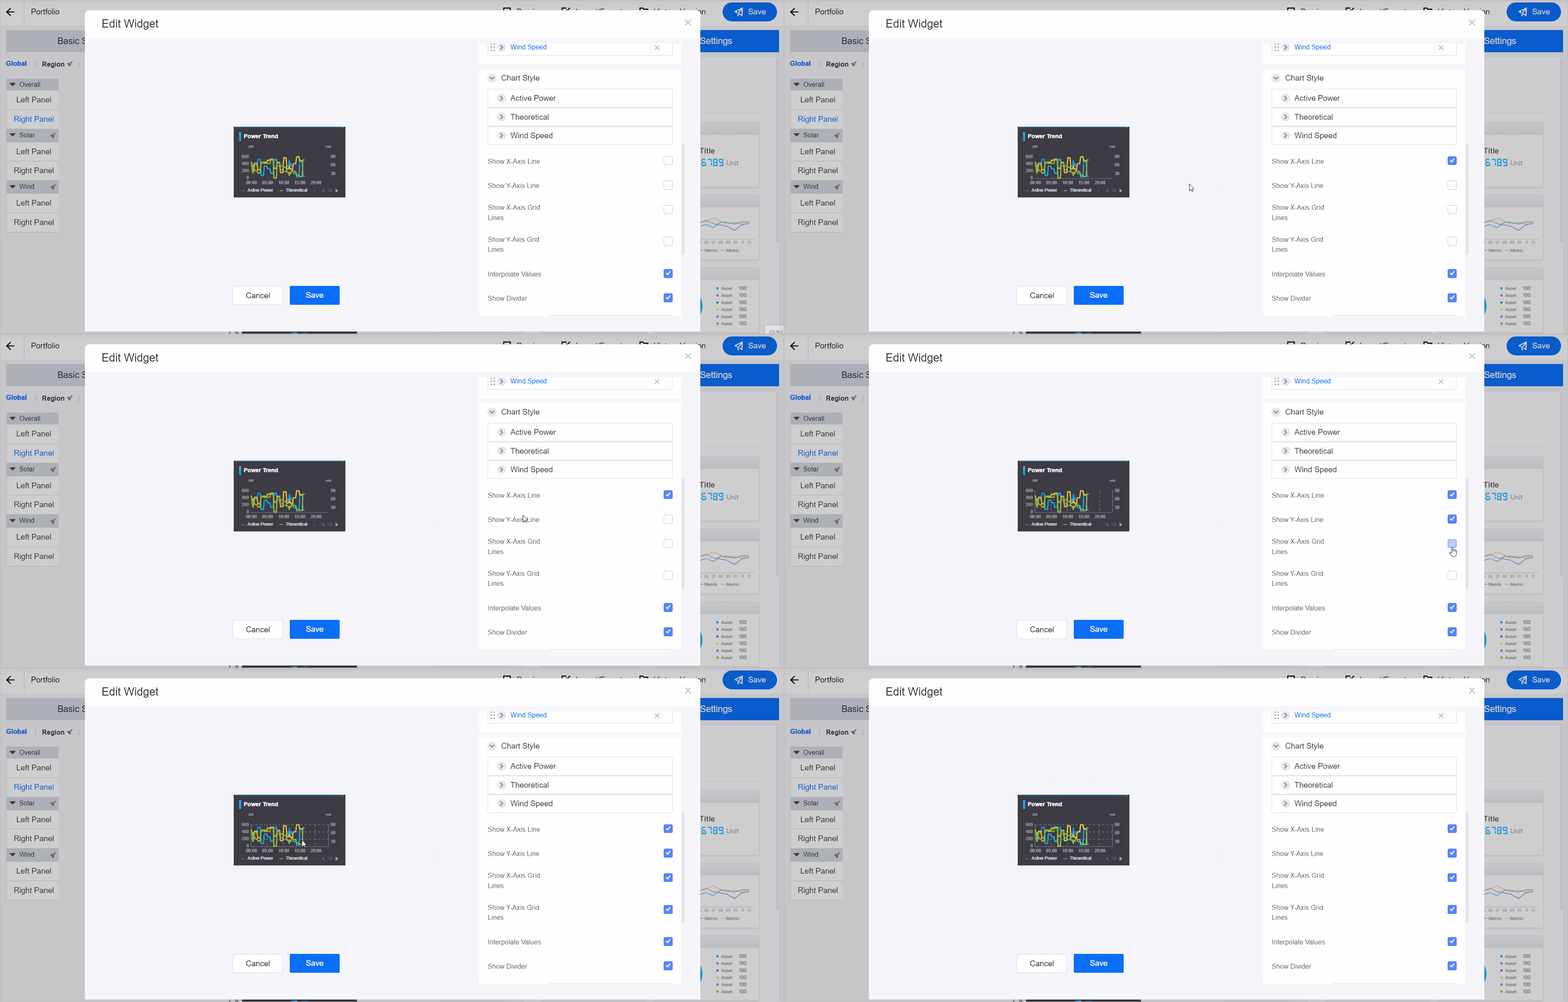
Application creators can now enable the Show X-Axis Line, Show Y-Axis Line, Show X-Axis Grid Lines, and Show Y-Axis Grid Lines configuration items in the Time Series widget in Portfolio. Once enabled, axis lines and grid lines will be displayed in the chart, providing users with clear scales and references to improve the readability of the chart.
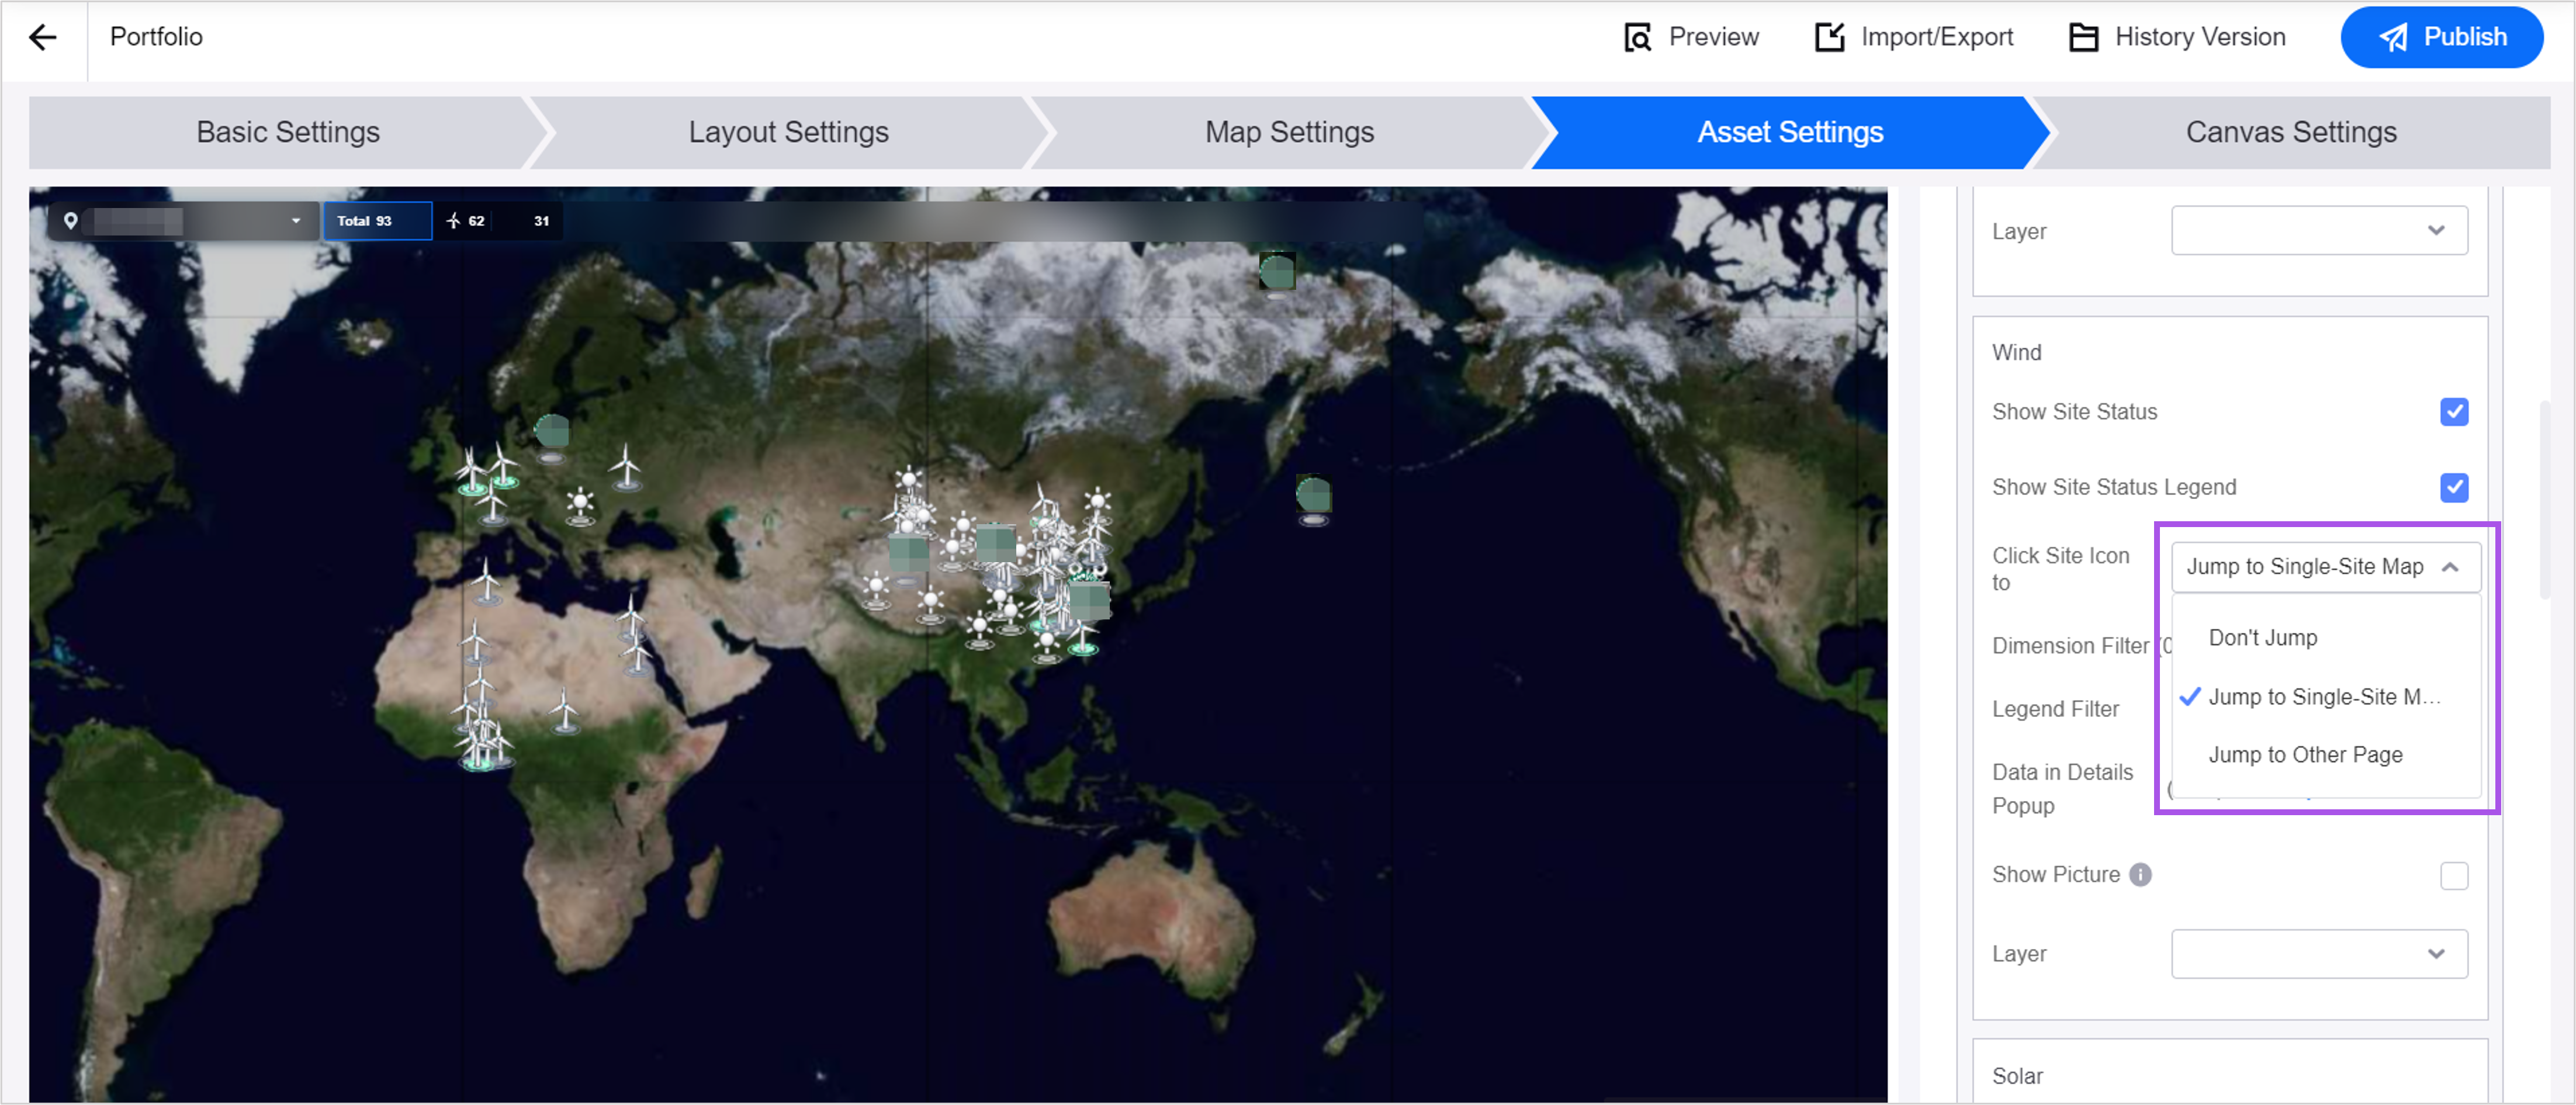
Application creators can now configure to allow users to click on a site icon in Portfolio to:
Jump to Single-Site Map: Users can click on the site icon to jump to the site map.
Jump to Other Page: Users can click on the site icon to jump to an external page.
Don’t Jump: Users can click on the site icon to zoom in to view the site map.
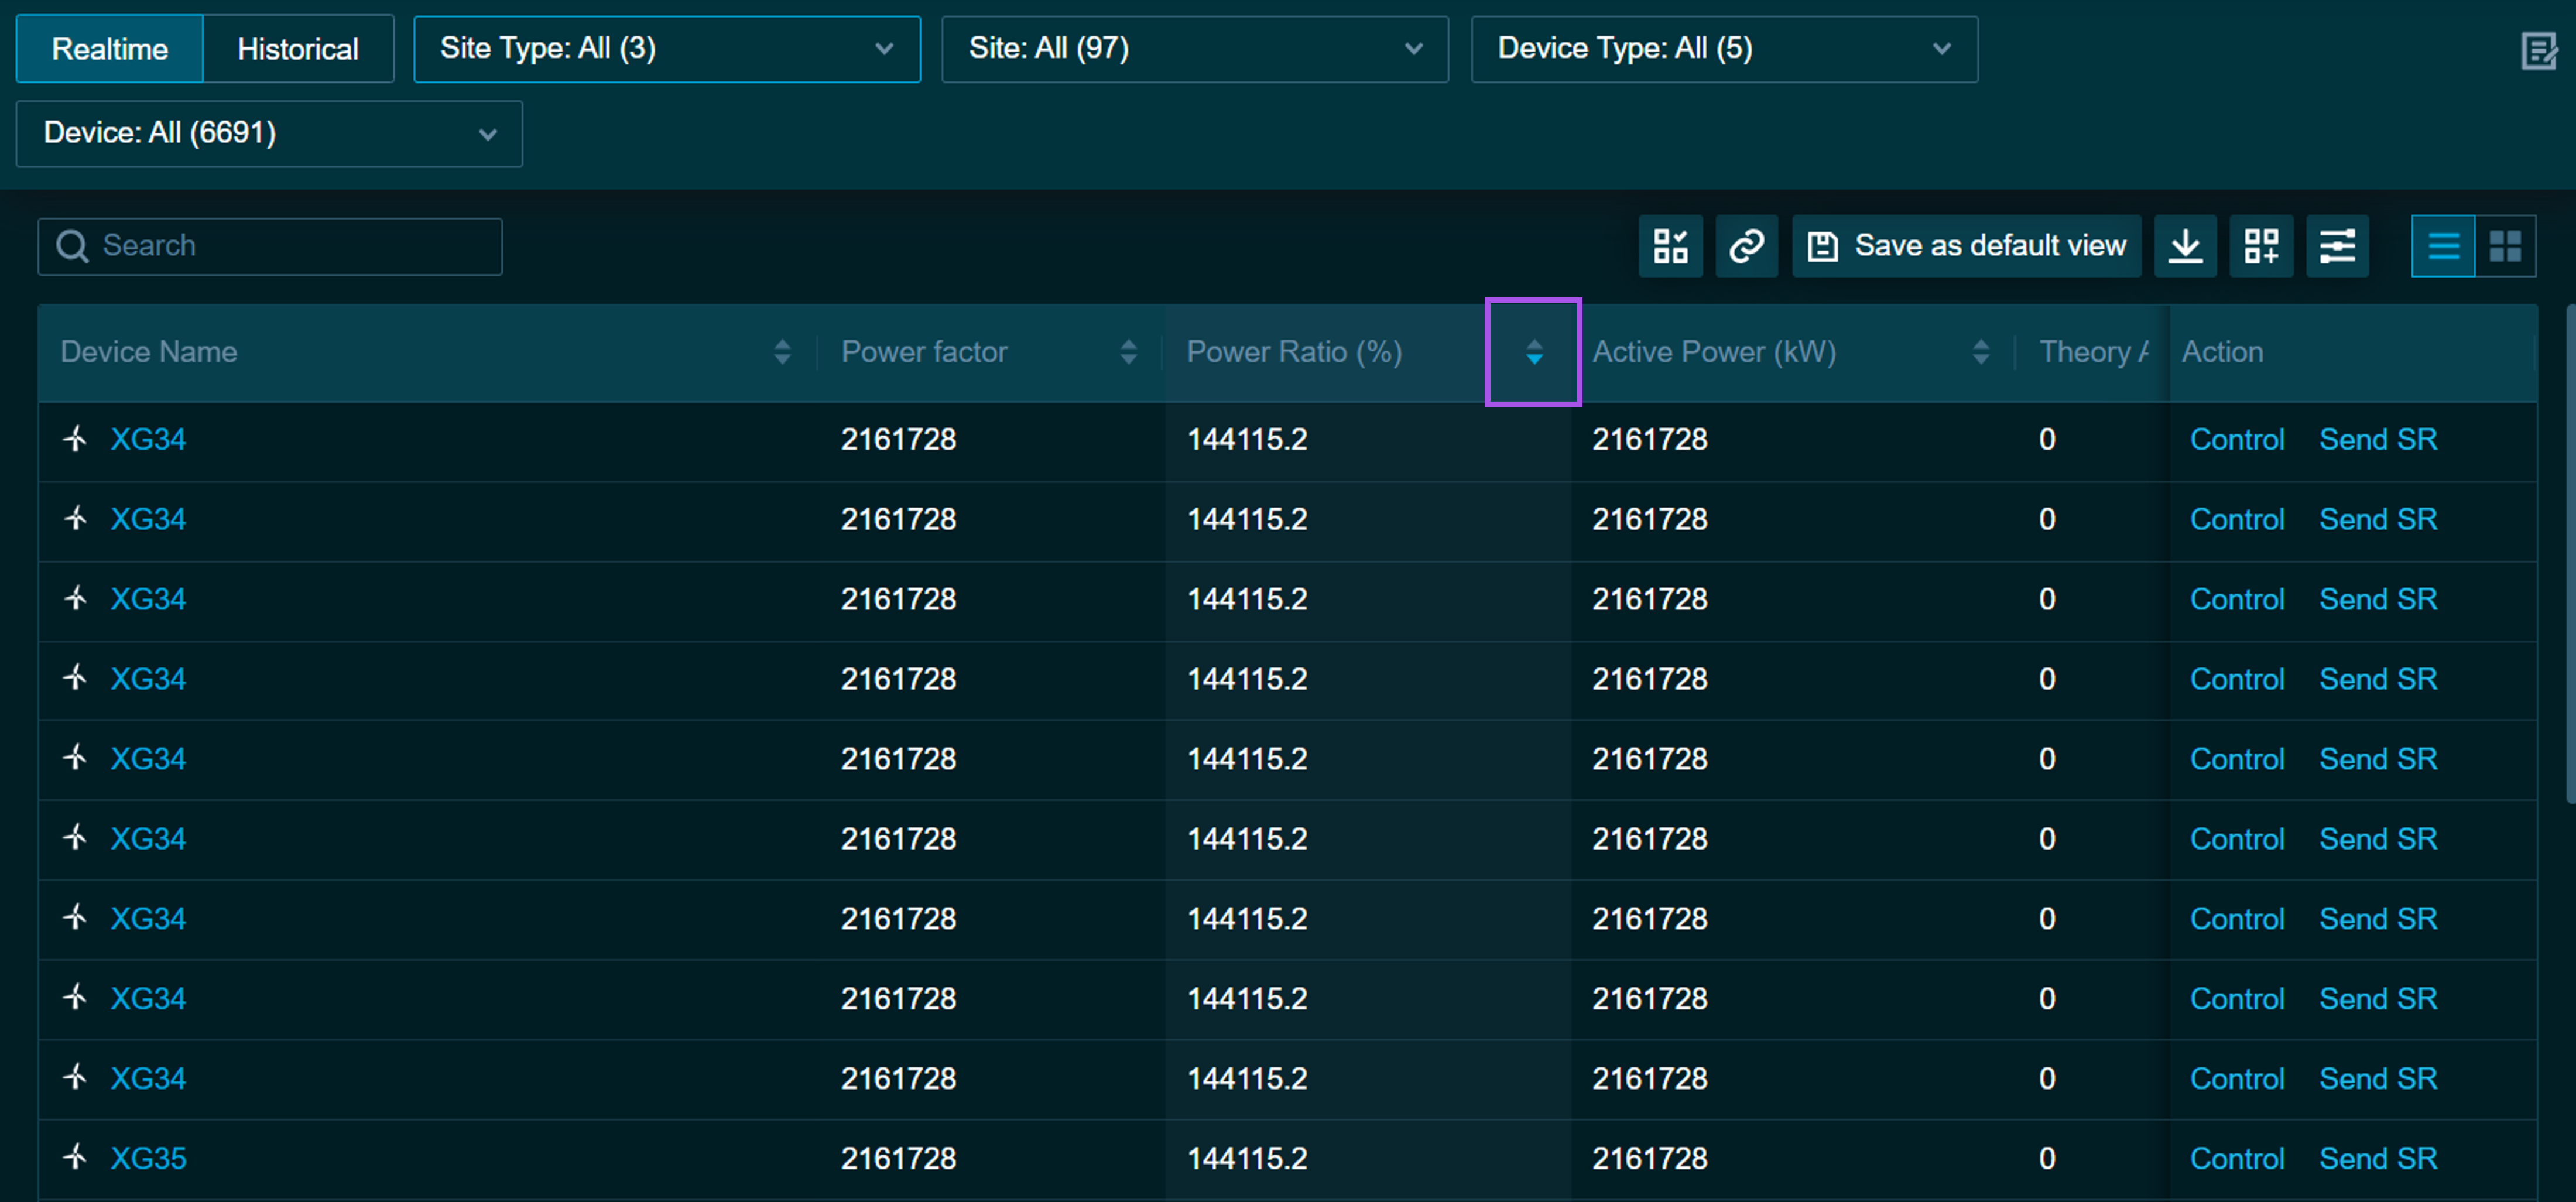
Supports sorting metric values in Asset List. When application creators set the paging method to Server-side paging, users can sort metric values that support sorting in ascending or descending order.
Added the device type filter to help users quickly identify the required data in Charting Tool.
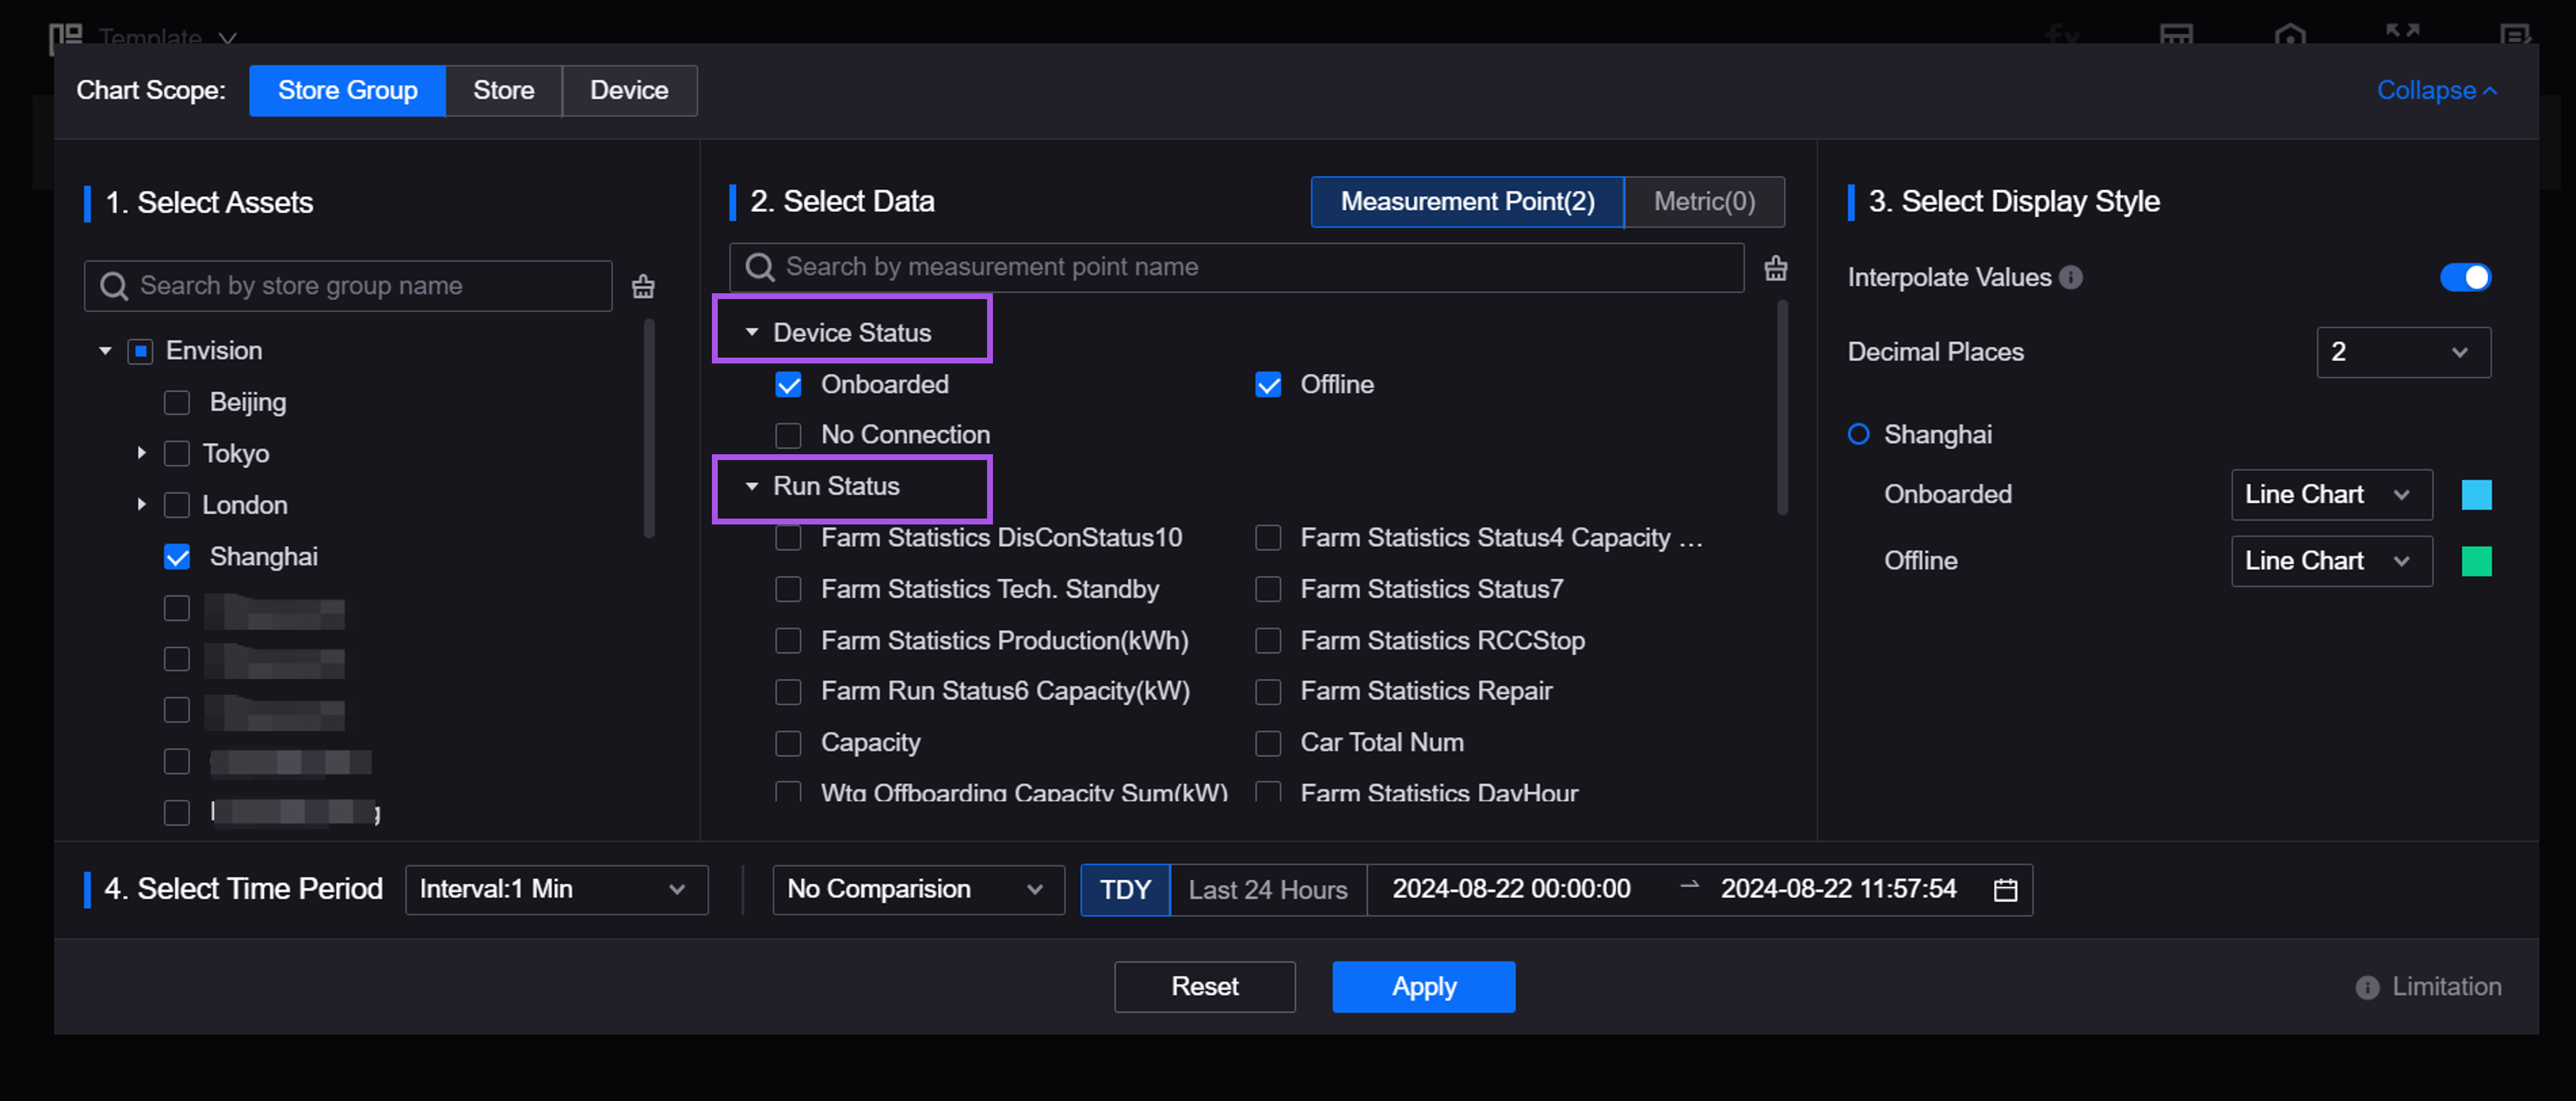
Application creators can now configure the following grouping of asset measurement points in the data filter:
Point Type:The data filter will group all measurement points by their types such as AI and PI. When the selected assets have multiple types of measurement points, each with unique data display requirements, grouping by point type can help users manage and analyze different types of data more conveniently.
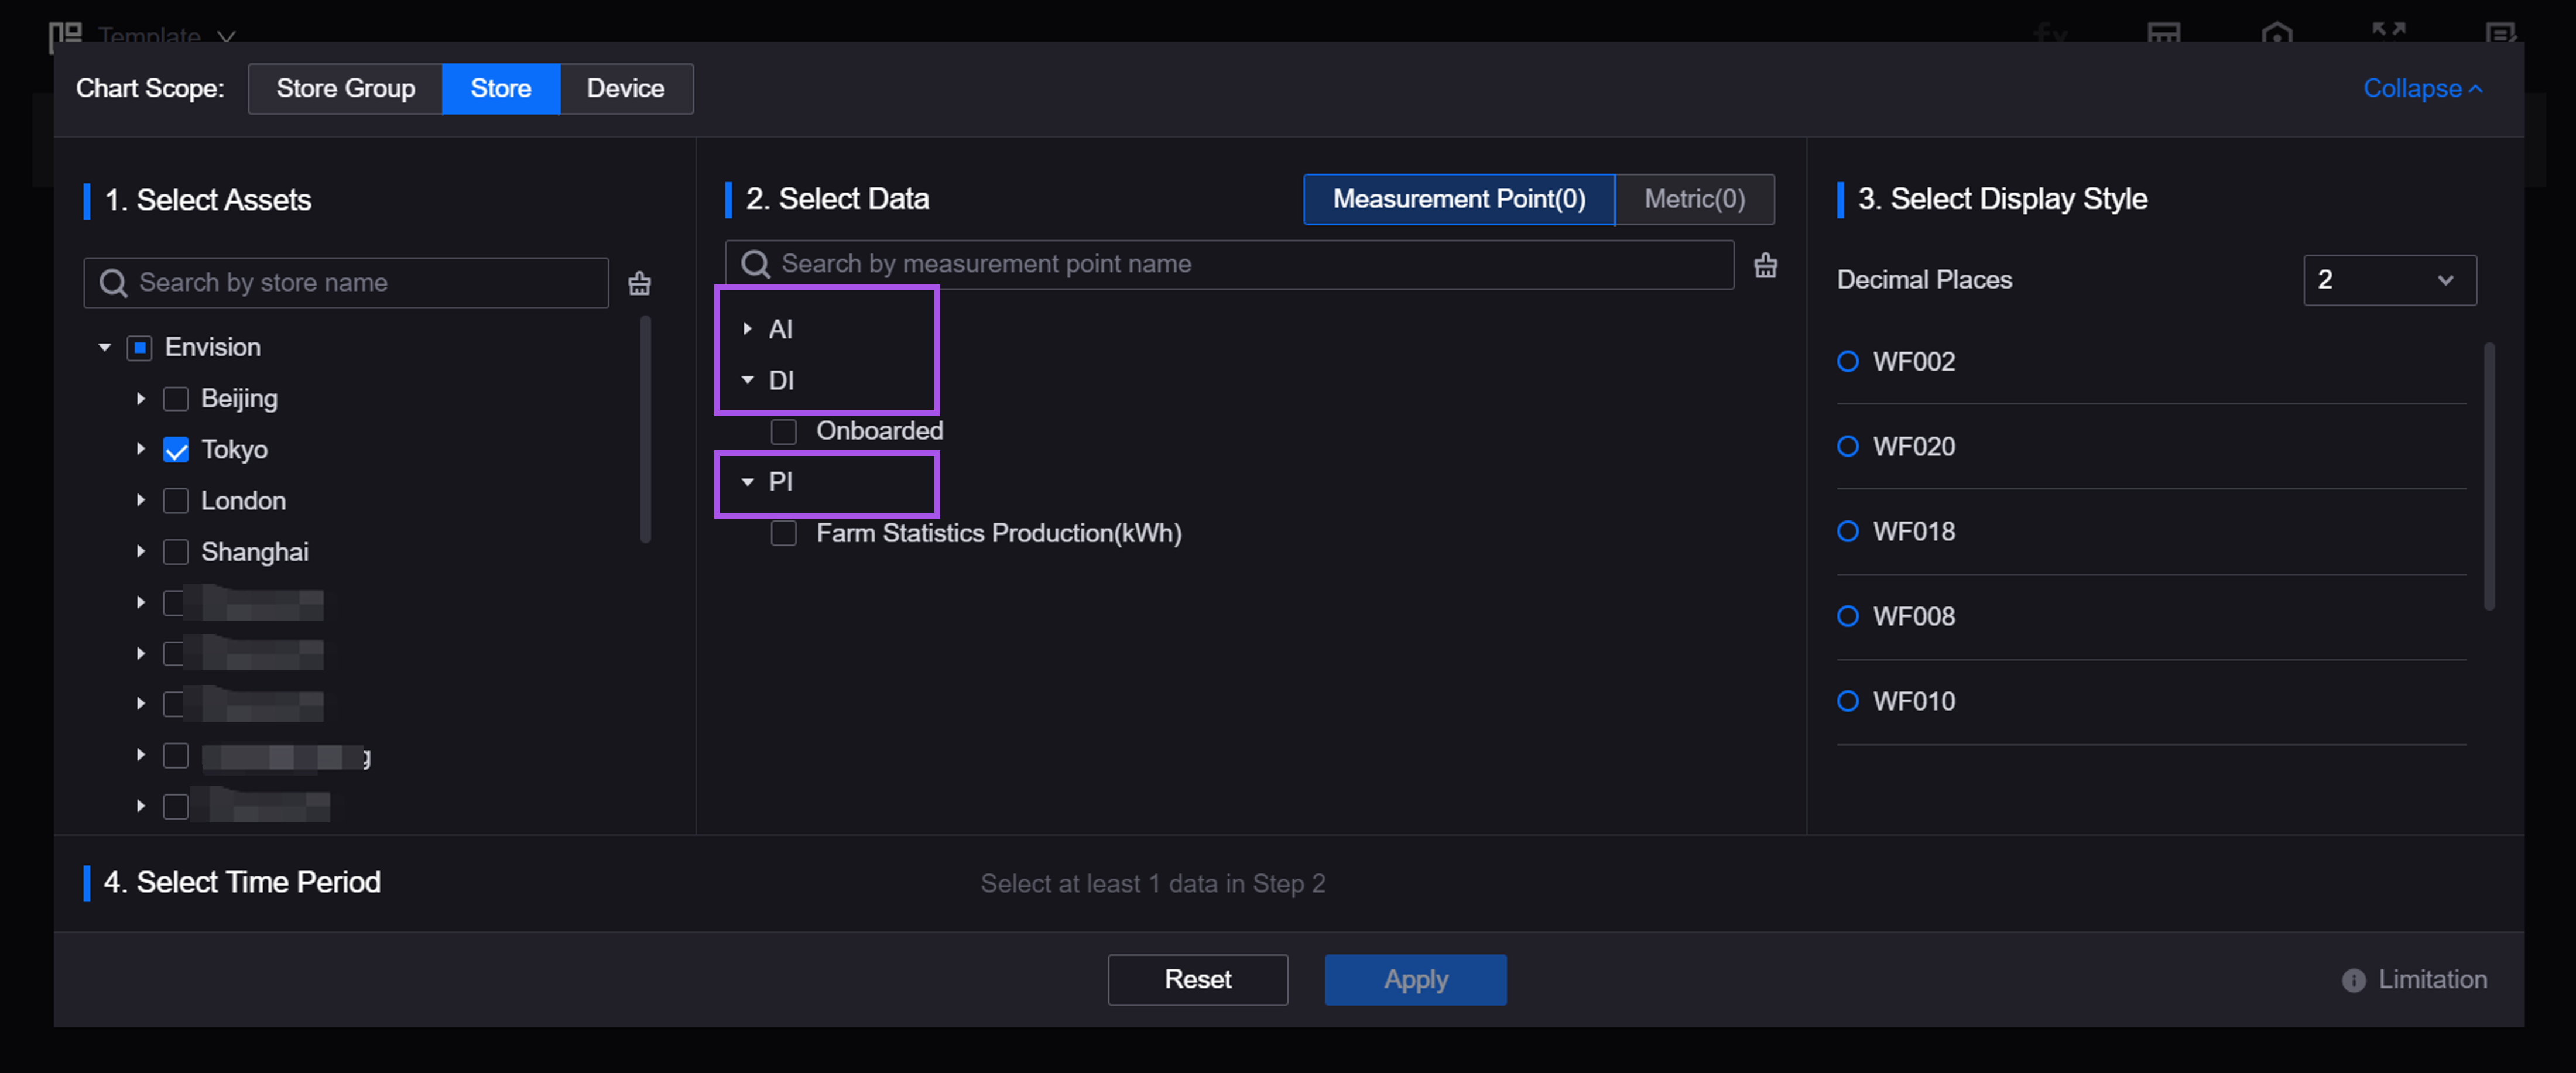
Visualization Group:The data filter will display the measurement points grouped by the visualization groups within the corresponding business objects only. When users need to simplify the data filtering process based on business processes, grouping by visualization group can help users focus on specific business contexts.
Supports the light theme for Asset List, Charting Tool, Common KPI Inquiry, Landing Page, and Unified Asset Tree.

Added Japanese as a display language, and supports configuring Japanese for internationalized fields.
Work Management
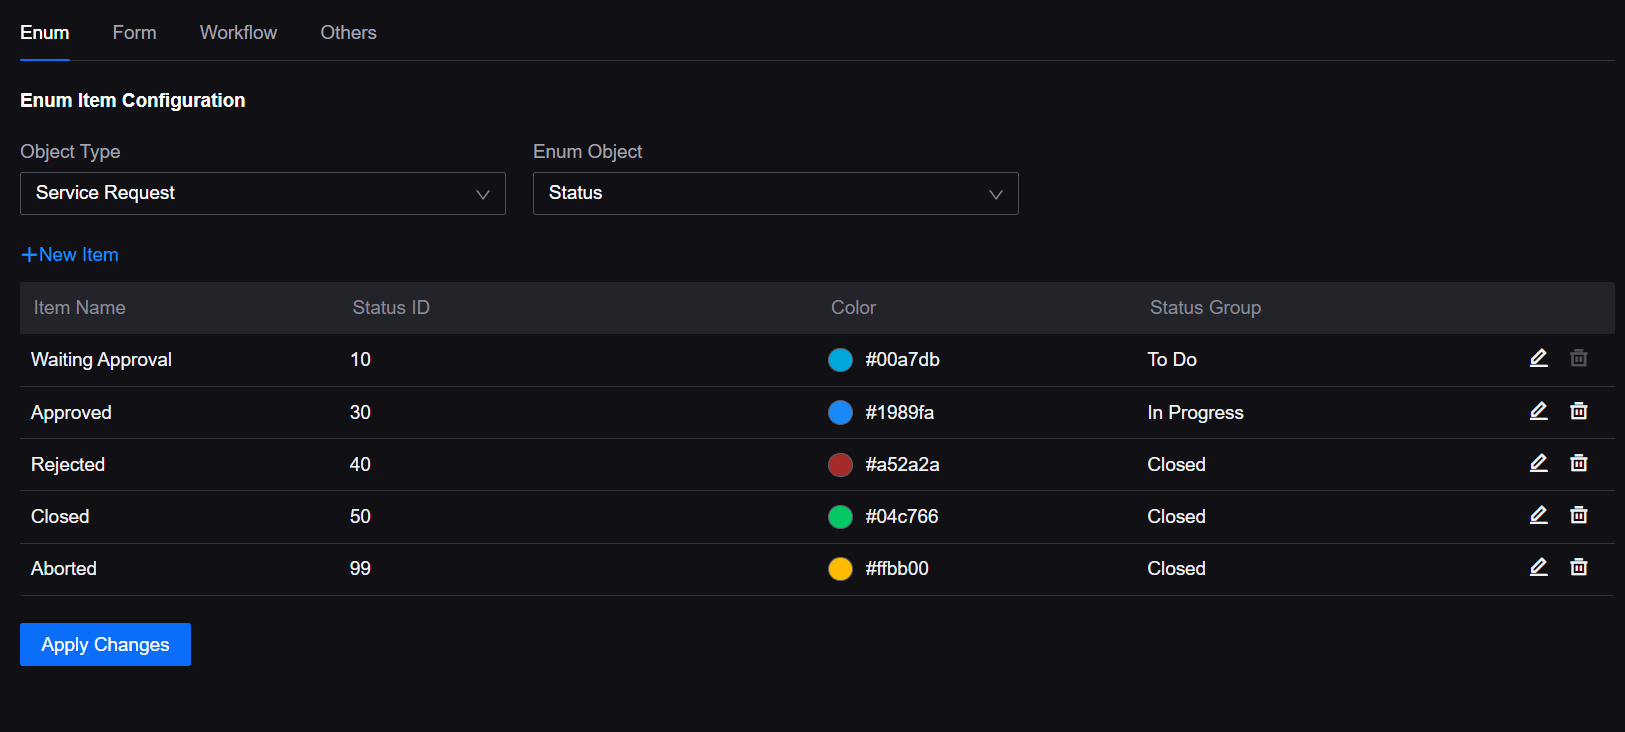
Added the Work Order Settings menu for application creators to configure the status enumeration items of work orders and service requests, configure the fields of the default form, assign viewing and editing permissions for forms, add custom workflows, and complete other settings to improve the customization capabilities of Work Management.
Fleet Control
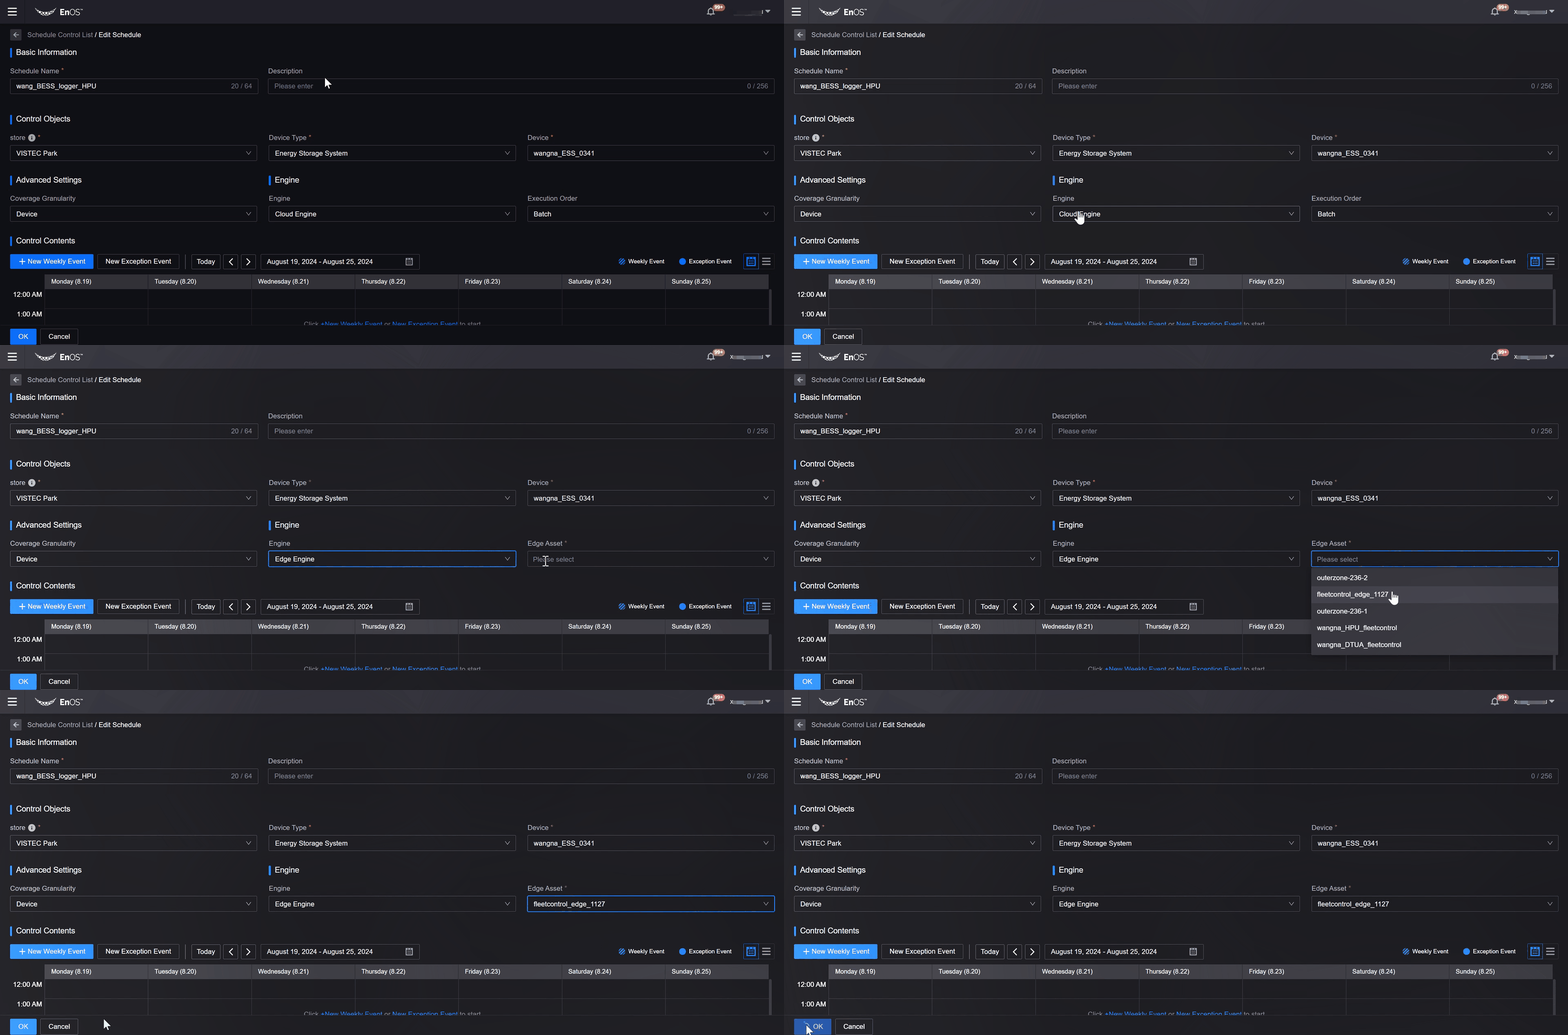
Users can now send control schedules to the Edge engine, which is used in control schedule execution scenarios under weak network. When configuring control schedules, users can select Edge Engine as the execution engine to send control schedules to EnOS Edge devices, which can autonomously execute the schedules without network connection and report the execution logs after the network is restored for users to view in Fleet Control.
Device Connection
Alarm Management
Asset administrators can now view the Alarm Generation Time field of delayed alarms in the alarm detail popup in Active Alarm and Alarm Log to evaluate the operation status of delay alarm rules.
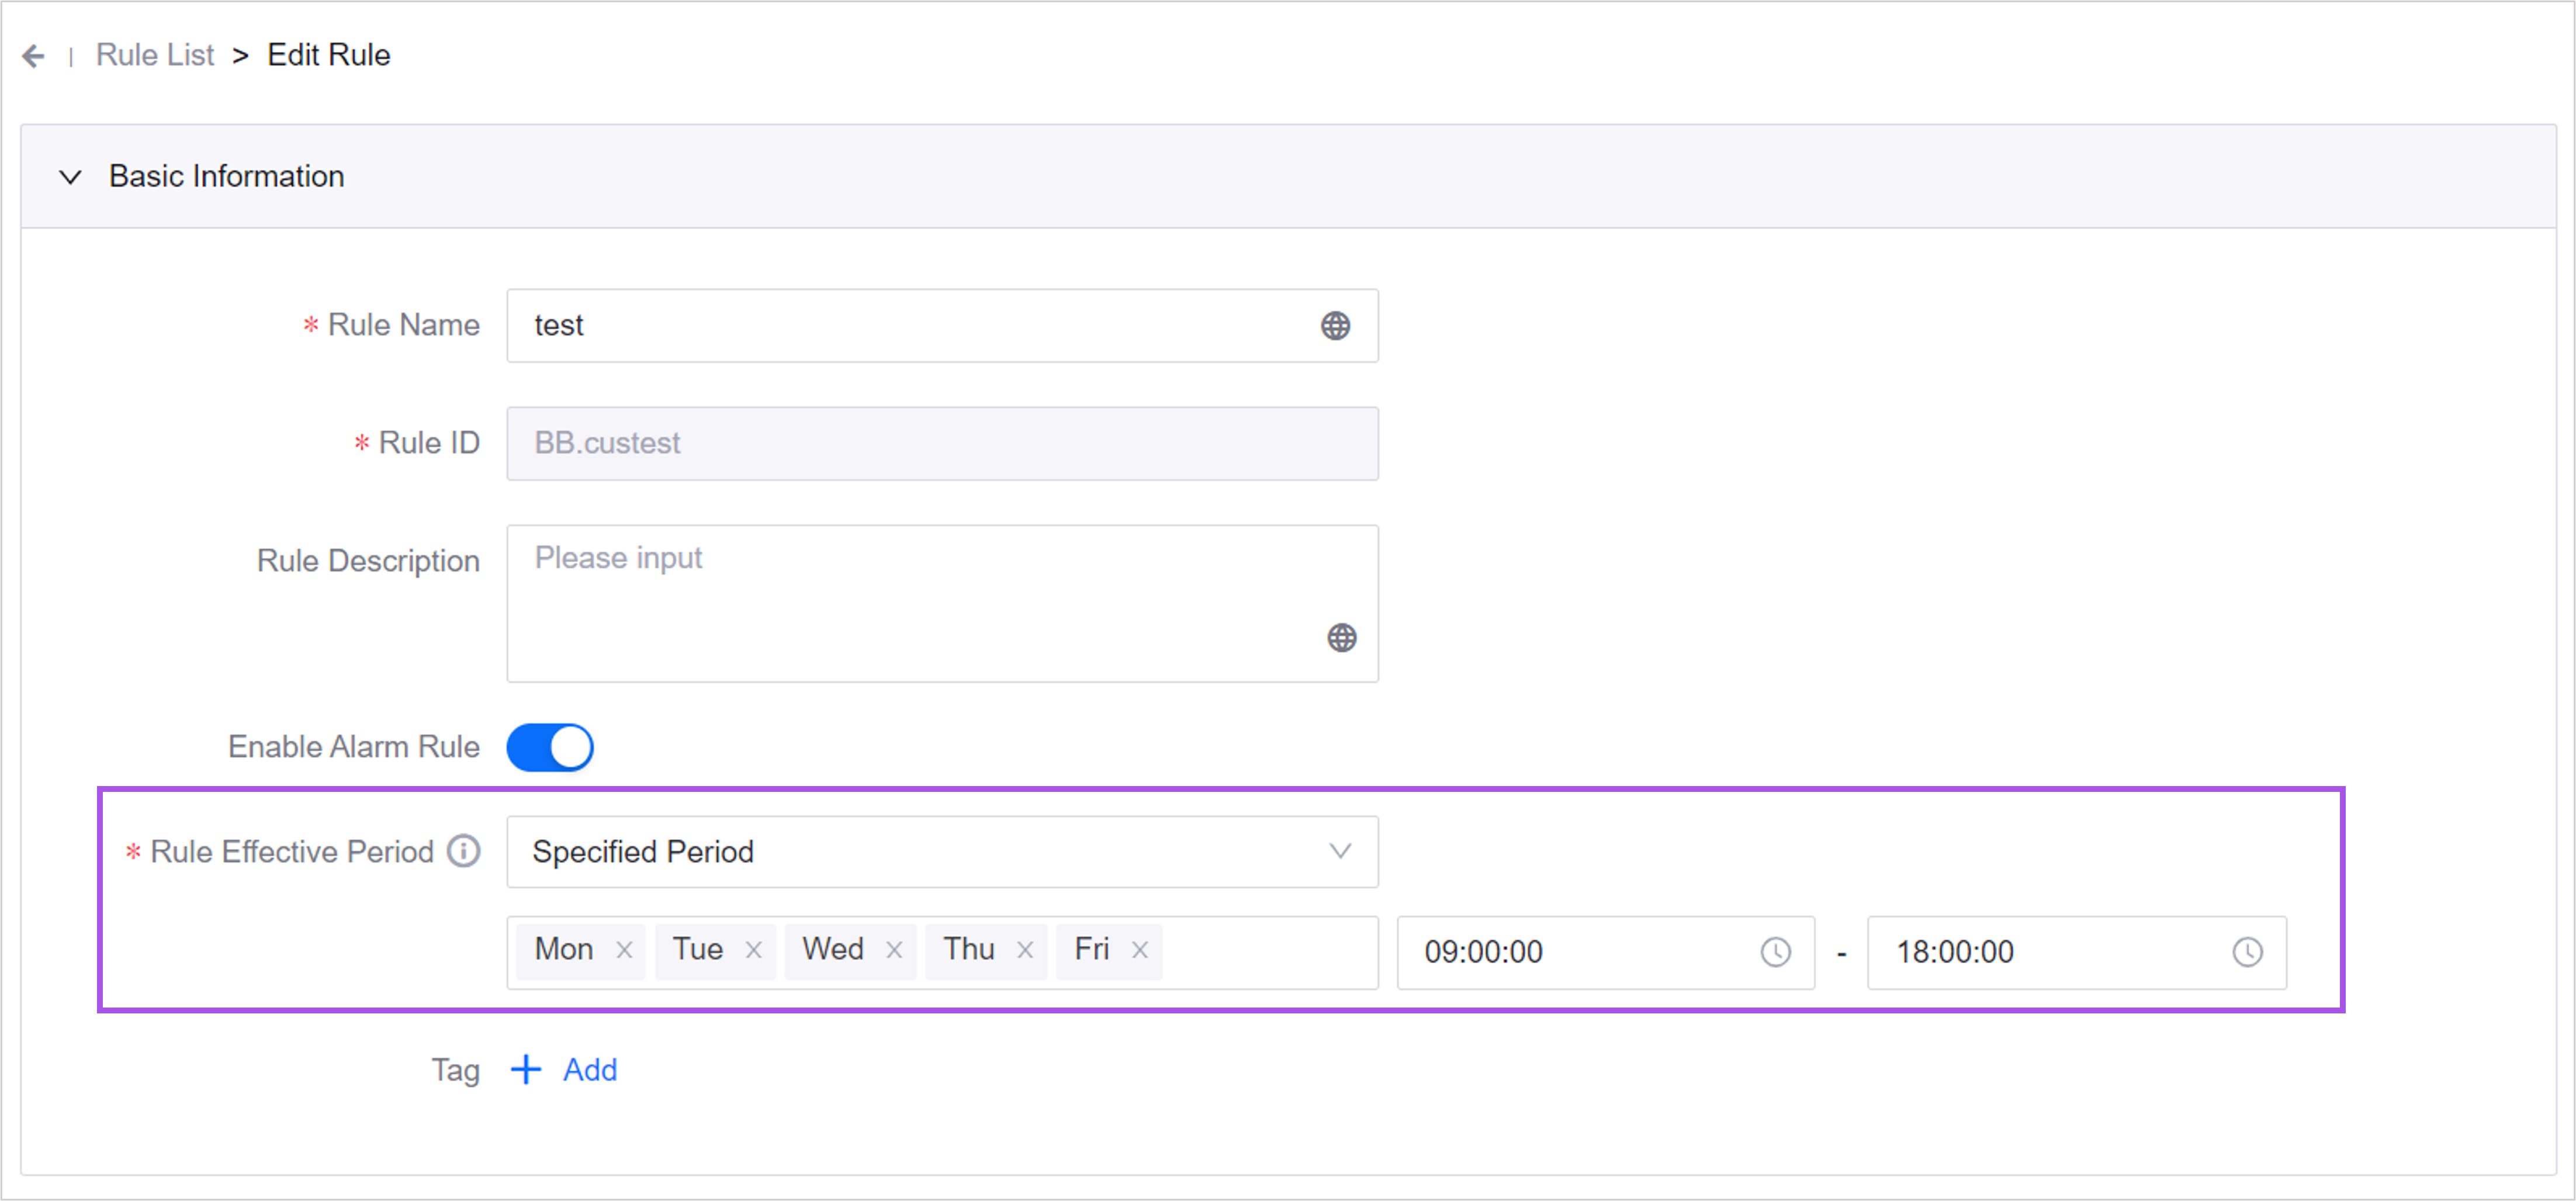
Added the Rule Effective Period configuration item in Alarm Rule. Asset administrators can now configure the effective period of an alarm rule to Always or to specify an effective period. For example, asset administrators can set the alarm rule for “Air Conditioning Power Consumption” in an office building to be effective only during the work hours on weekdays. This will avoid triggering unnecessary alarms outside of the specified time period.
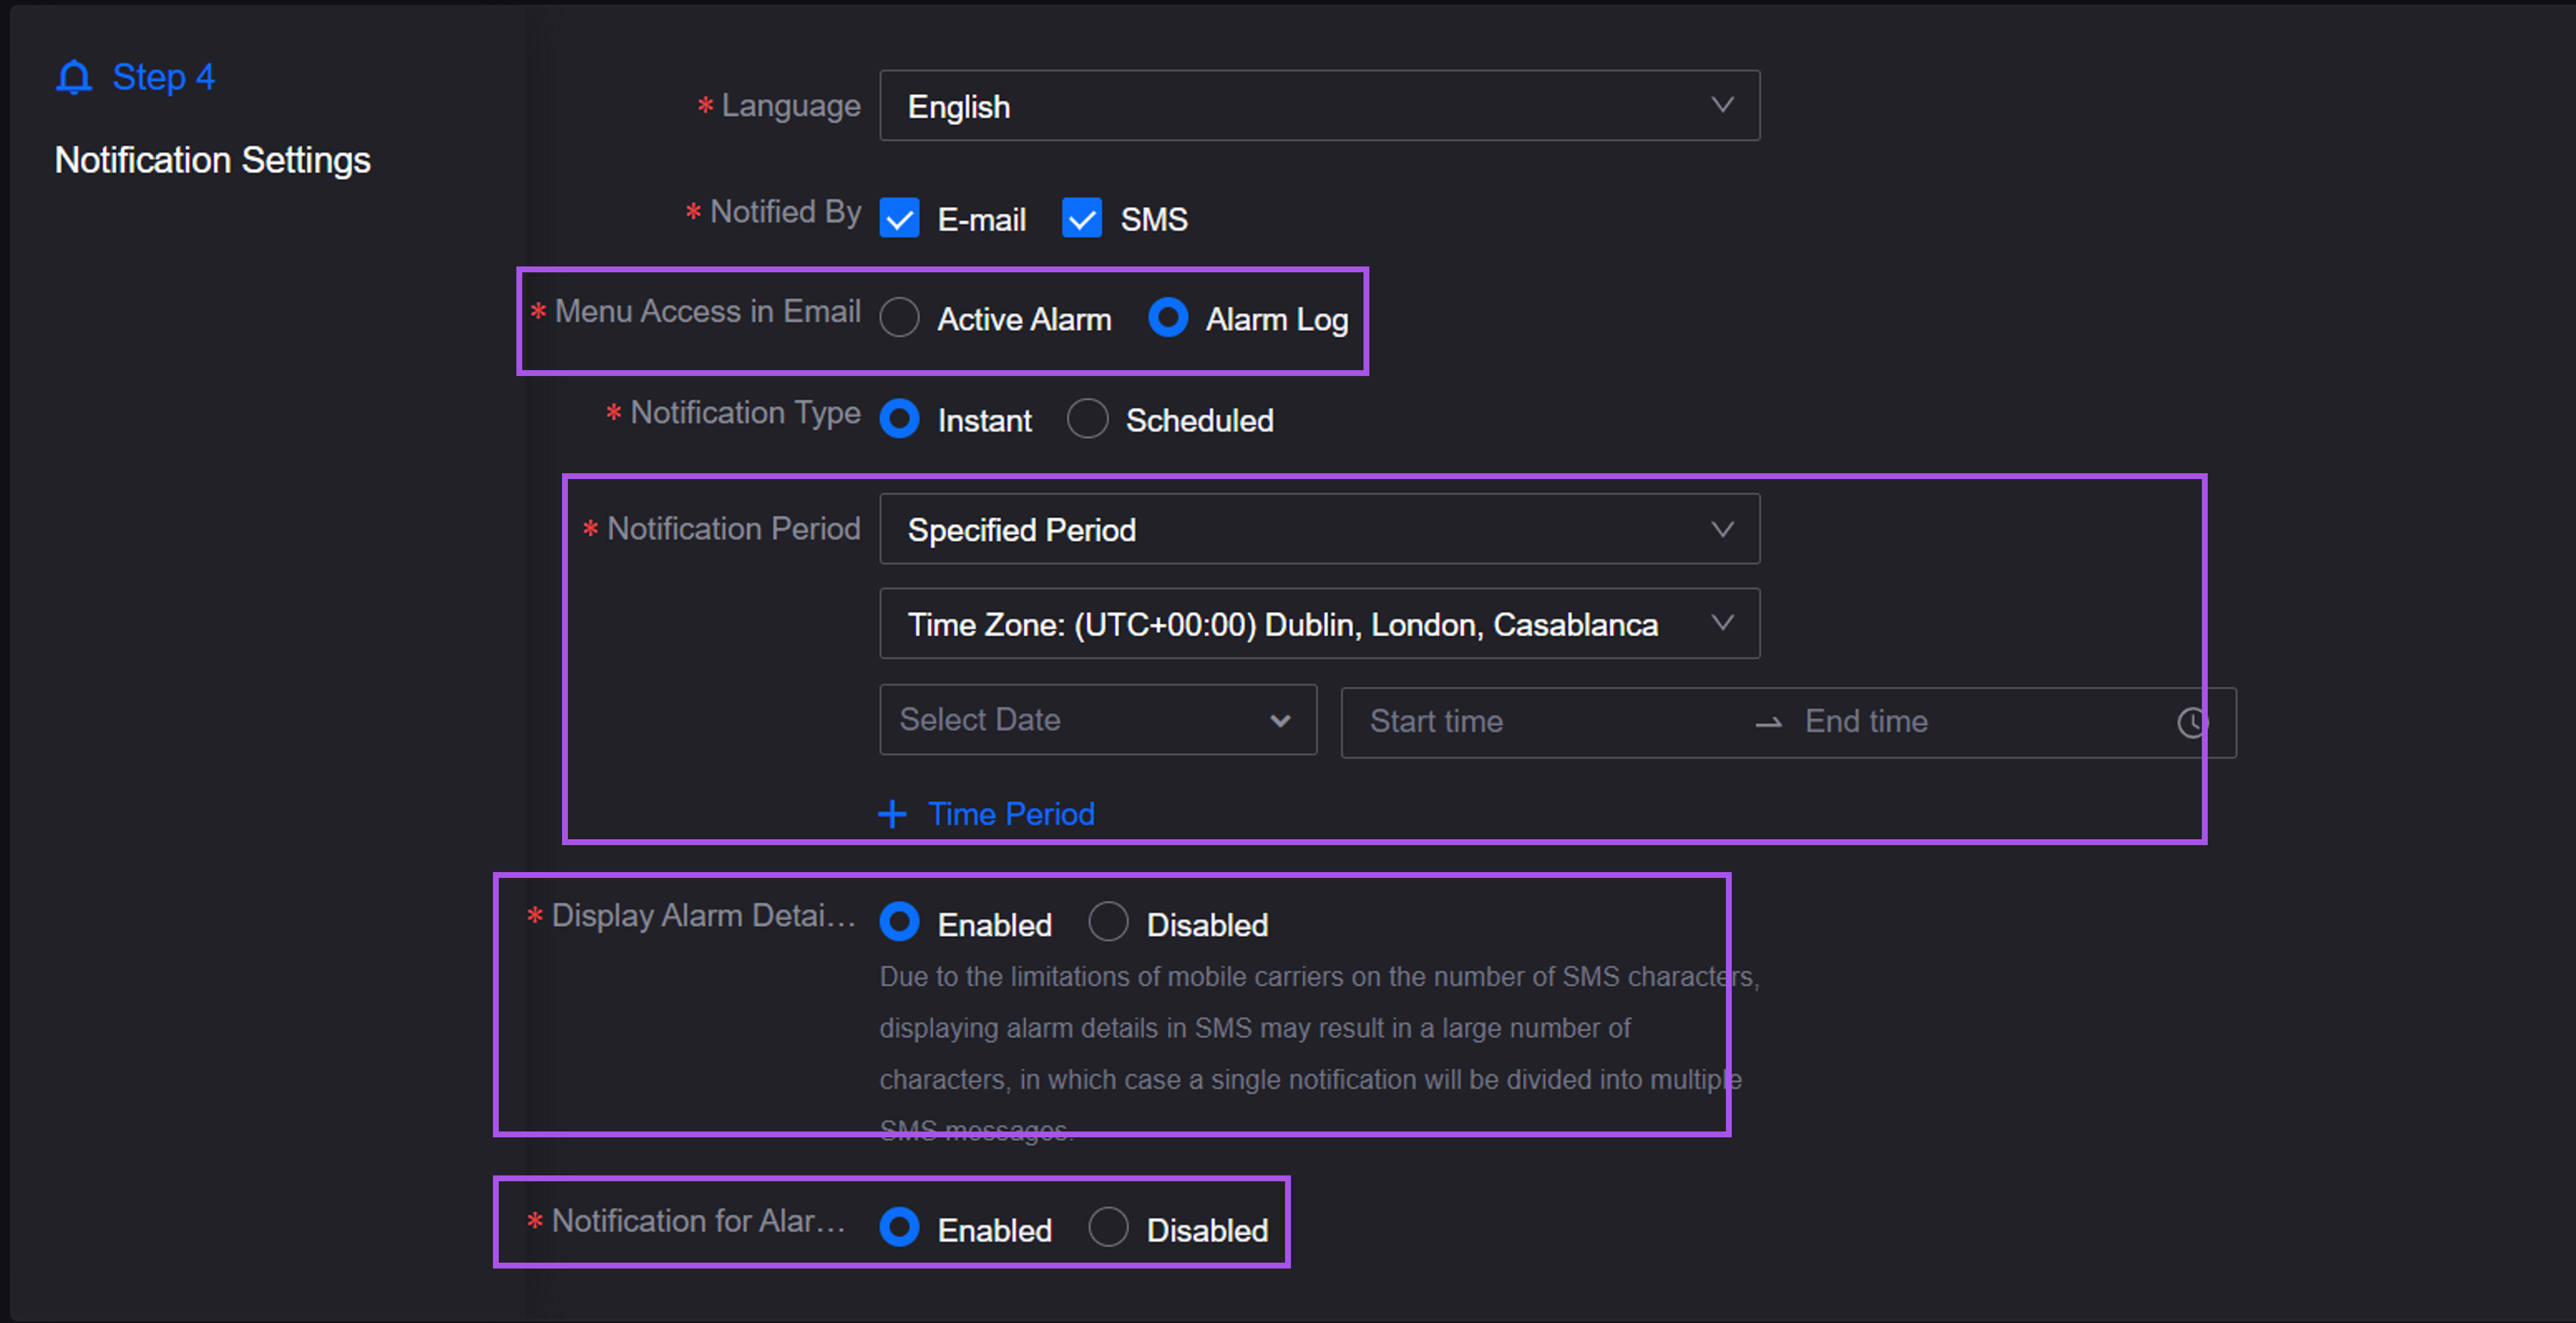
Added the following configuration items in Alarm Notification:
Menu Access in Email: Asset administrators can now configure the menu entry in alarm notification emails to redirect to either the Active Alarm menu or the Alarm Log menu. This allows for customization to meet different scenario requirements.
Notification Period: Asset administrators can now configure the period during which users will receive alarm notifications. Outside the period, users will not receive notifications to avoid being disturbed during their rest time.
Display Alarm Details in SMS: When asset administrators enable this configuration, users can view the detailed alarm information in the alarm SMS, such as asset details, alarm content, and alarm severity, so that users can quickly make judgments on alarms.
Notification for Alarm Recovery: For critical alarm events, asset administrators can enable this configuration, so that users can receive notifications both when the alarms are generated and recovered.
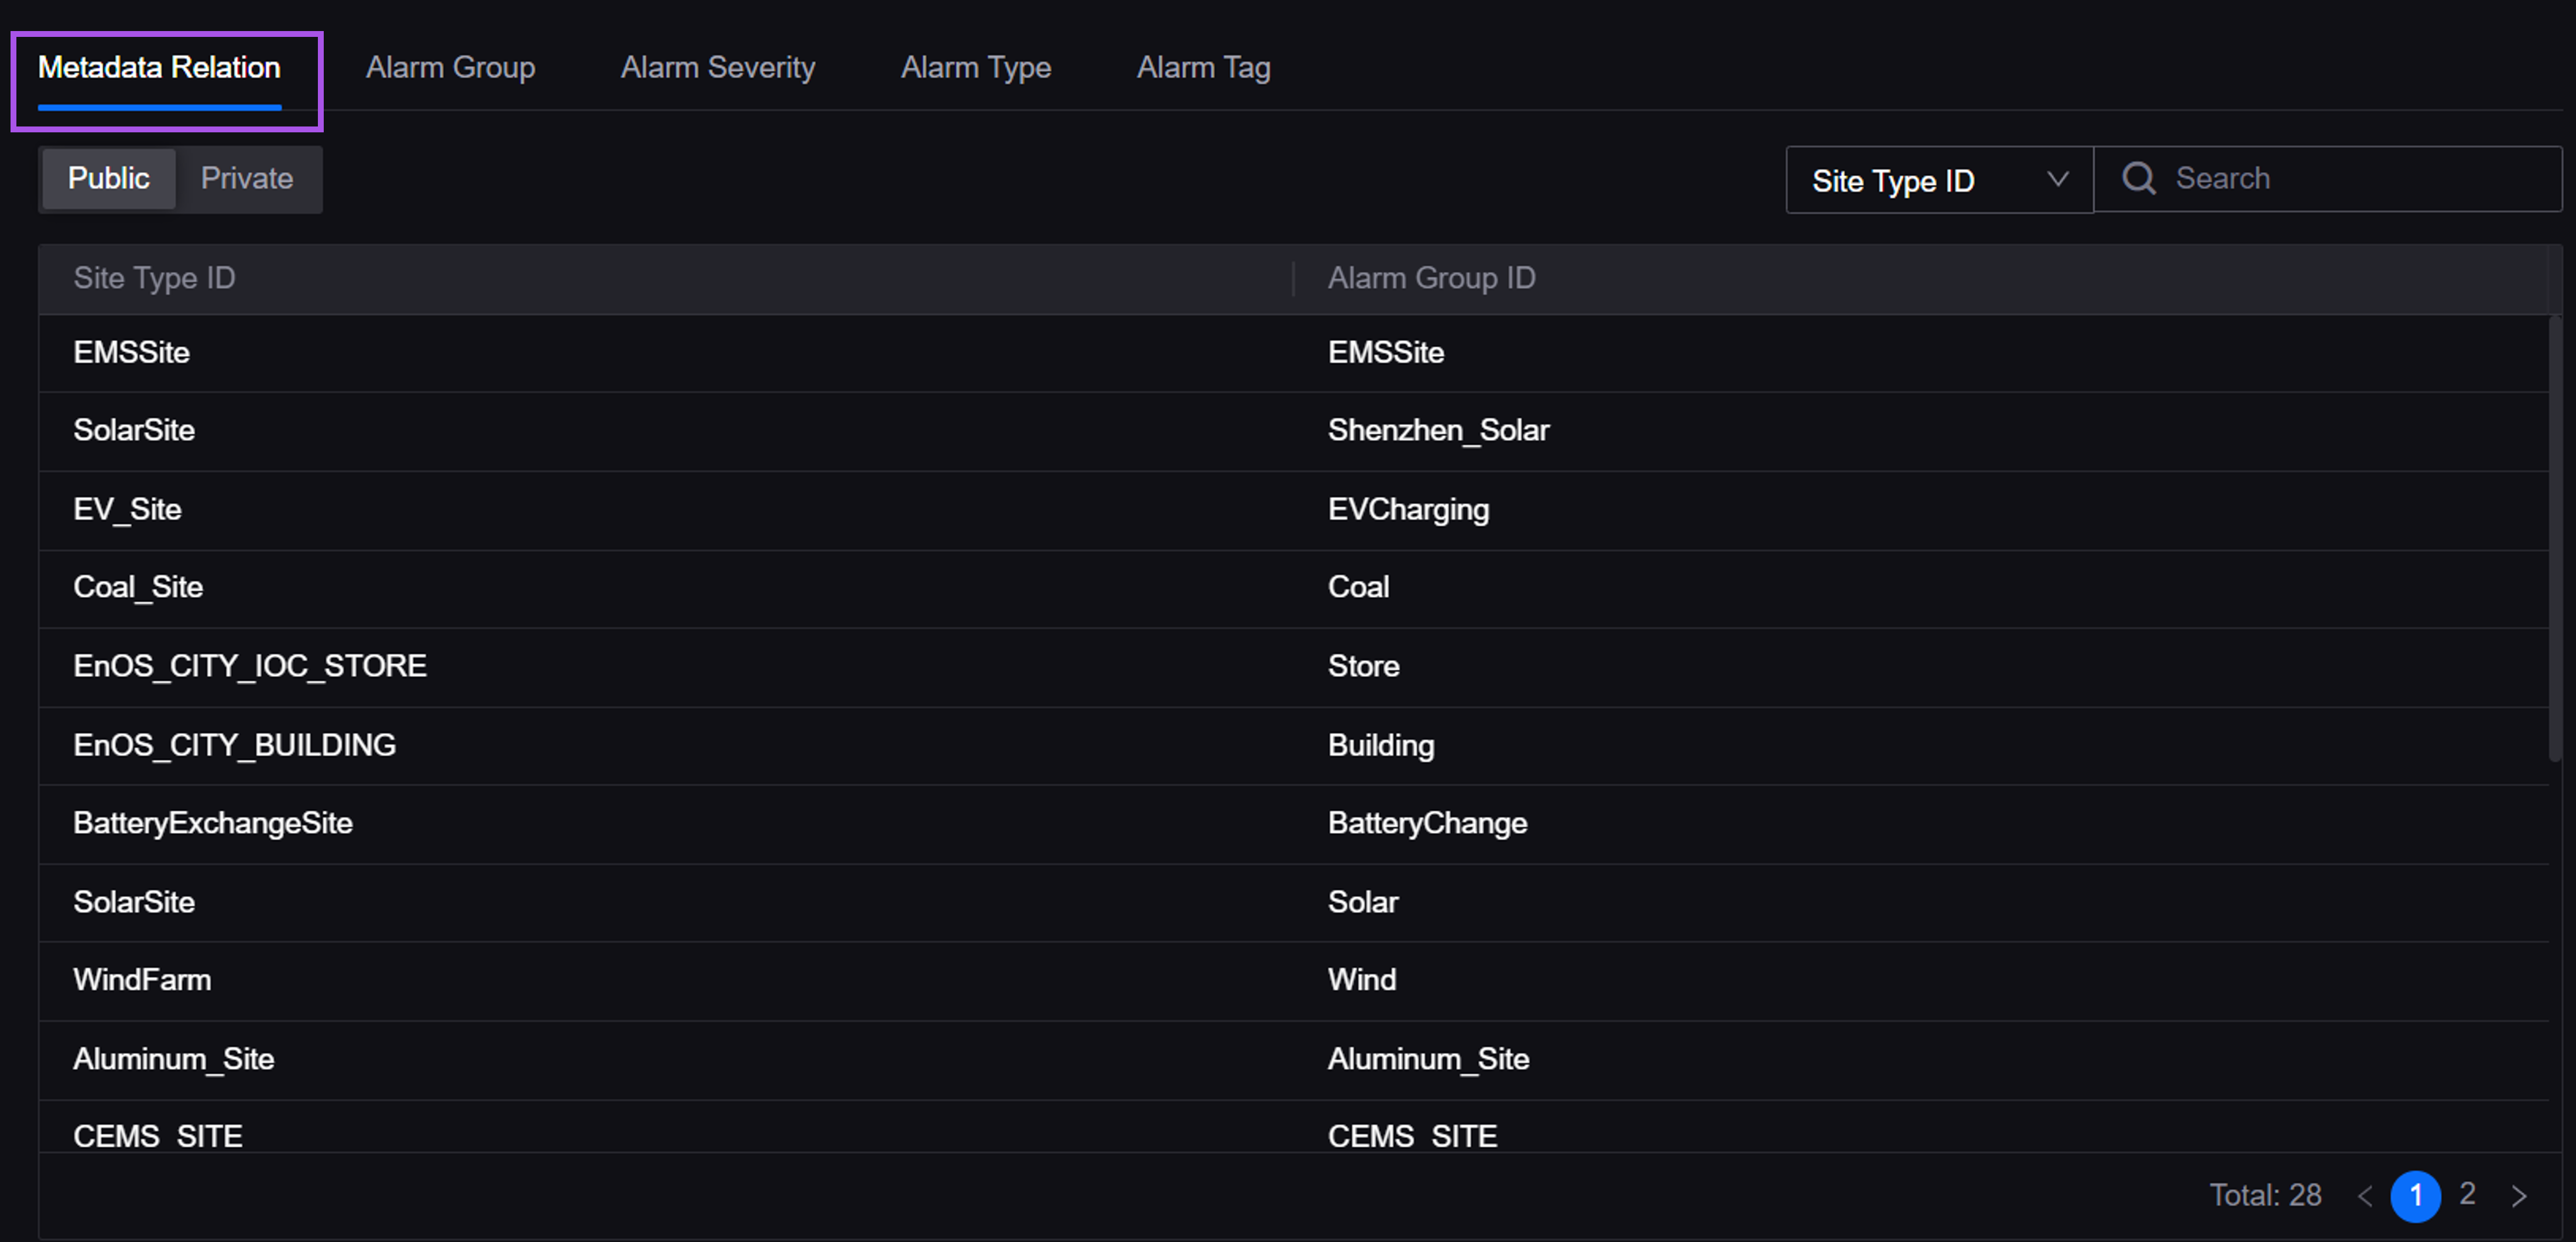
Added the Metadata Relation tab in Alarm Metadata. Asset administrators can now add and manage the relations between asset types and alarm metadata in the OU, enhancing the self-configuration capability of Alarm Management.
Added the site type filter in Alarm Shelve. Asset administrators can first filter the site type and then the site instance under the type to improve the efficiency of alarm shelving.
Added Japanese as a display language, and supports configuring Japanese for internationalized fields.
Alert Engine
Added the End Time, Alert Generation Time, and Alert Recovery Time columns in Alert Rule. Asset administrators can compare the data and analyze the alert duration.
Supports contacting the system administrator to enable the scheduled monitoring of Device Status alert records, and set the monitoring frequency. If an alert record is continuously active for more than 1 hour and has met the closing conditions, the alert record will be automatically closed, reducing meaningless alerts and improving the quality of alerts.
