What’s Changed in R2408?
EnOS R2408 introduces the following behavioral changes.
Name Changes
EnOS R2408 includes the following menu name changes.
Digital Twin Visualization
Before |
After |
|---|---|
Dashboards > Dashboard |
DTV Center > Dashboard |
Dashboards > Widget Template/Dashboard Template |
DTV Center > Template Center |
Dashboards > Data Sources |
DTV Center > Data Sources |
Monitoring > Monitor |
DTV Center > Monitoring Page |
Form Builder |
DTV Center > Forms |
DTV Tools > Tags |
DTV Center > Basic Information > Tags |
DTV Tools > Import/Export |
DTV Center > Import/Export |
DTV Tools > Import Logs |
DTV Center > Audit Logs |
DTV Tools > HMI Transform Tool |
DTV Center > Monitoring Page Tool |
Function Changes
EnOS R2408 includes the following function changes.
Application Building
Application Portal
Service / Function |
Before |
After |
Impact |
|---|---|---|---|
Login |
Users can log in only by username. |
Users can log in by username or email address. |
None |
Digital Twin Visualization
Service / Function |
Before |
After |
Impact |
|---|---|---|---|
Dashboard |
When application creators save a widget as a widget template, only the default title of the widget is saved as the template’s default name. The internationalized titles are not saved. |
Both the default and internationalized titles are saved in the template. |
None |
Dashboard |
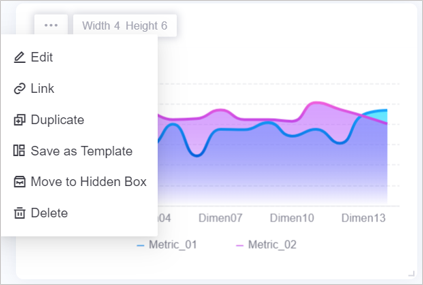
When application creators hover over a widget, they can only view the width and height of the widget. They need to click ··· and select Edit in the drop-down list to open the widget configuration panel. |
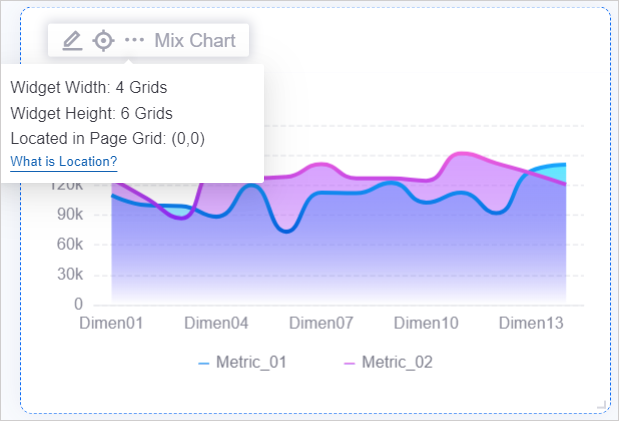
When application creators hover over a widget, they can view its width, height, and page position. They can click the Edit button to open the widget configuration panel. |
None |
Dashboard |
To view and manage widgets that have been moved to Hidden Area, application creators need to select Hidden Area in the upper-right corner. |
Application creators can select Page Settings in the upper right corner, and select Hidden Area in the pop-up window. |
None |
Unified Monitoring
Service / Function |
Before |
After |
Impact |
|---|---|---|---|
Portfolio |
The Recently Viewed list in the asset filter displays all nodes that a user has viewed. |
It displays the last 3 viewed nodes. |
None |
Charting Tool |
After a user selects data in the Measurement Point and Metric tabs and clicks the Reset button, only the selected data in the current tab is cleared. |
All the selected data in both tabs is cleared. |
None |
Charting Tool |
To change the template type or set a template as the OU default view, users need to select Save Template or Save as Template, and update the template type and default view in the Save Template popup. |
Users can select the Edit button for the template, and update the template type and default view setting in the Edit Template popup. |
None |
Asset List |
When users sort the list by a dimension’s value, the list is sorted by the name of the dimension value. |
The list is sorted by the ID of the dimension value. |
None |
Asset List |
The width of the Actions column in the list is fixed. |
The Actions column width is automatically adjusted based on the number and length of the action buttons configured by application creators. |
None |
Common KPI Inquiry |
In the metric data list, the site/device name column precedes the dimension columns by default. |
Users can drag and drop the dimension columns to precede the site/device name column. |
None |
Fleet Control
Service / Function |
Before |
After |
Impact |
|---|---|---|---|
Device Control |
Control request throughput is unlimited. |
Control request throughput now is limited. When the throughput exceeds the limit, control requests are displayed as failure. |
When a large number of device control requests need to be processed in a short period of time, limiting the throughput can improve the stability of Fleet Control and the number of controllable device accesses. |
Device Connection
Alarm Management
Service / Function |
Before |
After |
Impact |
|---|---|---|---|
Active Alarm / Alarm Log |
The sites in the site filter are displayed in a tiled layout. |
The site filter displays groups, regions, and sites according to the organization structure in EnOS Application Portal. |
None |
Active Alarm / Alarm Log |
The default data refresh frequency is 15 seconds. After the refresh, the data list automatically returns to page 1. |
Contact the system administrator to customize the data refresh frequency of the OU. After the page is automatically refreshed, the list remains on the data row that the user is viewing. |
None |
Active Alarm / Alarm Log |
When asset administrators specify multiple measurement points for an alarm rule, only the name and value of the last measurement point that triggered the alarm are displayed in the alarm record detail popup. |
The popup displays the names and values of all triggering measurement points in the form of “name1:value1,name2:value2”. |
None |
Active Alarm / Alarm Log |
The Acknowledgment Status filter is displayed by default. |
Contact the system administrator to configure whether to display the filter for the OU. |
None |
Alarm Log |
Users need to expand all the filters to filter Active/Inactive alarms. |
The Alarm Status filter are fixed in the default filter bar. Users can directly filter Active/Inactive alarms. |
None |
Alarm Rule |
When asset administrators select the triggering measurement points or metrics for an alarm rule, they need to select among all the measurement points defined in the selected model and all the metrics associated with the model. |
Asset administrators can select only the measurement points and metrics configured in the visualization groups of the corresponding business object. If no visualization groups are configured for the business object, they need to select among all the measurement points and metrics associated with the model. |
None |
Alarm Rule |
If a dimension is already configured for an metric, asset administrators need to specify 1 dimension and 1 dimension value when configuring the alarm rule for the metric. |
Asset administrators can leave the dimension and dimension value unspecified. If unspecified, the alarm rule will be triggered based on the metric data across all dimensions. |
None |
Alarm Shelve |
All users can individually or batch shelve alarm records in Active Alarm / Alarm Log. |
Users can only shelve alarm records if OU administrators have assigned the corresponding permission to their accounts. |
None |
Alert Engine
Service / Function |
Before |
After |
Impact |
|---|---|---|---|
Alert Rule |
When asset administrators specify the asset scope for an alert rule, they can only select assets under the specified model. |
Assets under the model and its sub-models can all be specified. |
None |

