Tutorial: PC Device Data Integration
Different devices have different data formats. There are standard SDKs, protocols, and authentication methods for integrating the device data to IoT Hub. The Device Integration Service helps to quickly integrate device data without worrying about the underlying different data formats and protocols.
This tutorial uses a PC to stimulate data and will guide you on how to use the Device Integration Service to create and configure an HTTP Server and manage PC data by connecting it to EnOS in a custom format via HTTP protocol, completing the online management of PC devices and data collection by EnOS.
The scenario is as per the below:

About This Tutorial
This tutorial enables you to:
Understand the application scenarios of the device integration service.
Learn how to use the flow designer and monitor the device integration service.
Complete the creation and configuration of a HTTP Server.
Complete the server authentication, asset mapping, and device online function configurations for device connection.
Complete device data access using a custom protocol, conversion and mapping of data and model measurement point by writing a simple JavaScript script, and upload the measurement point data to IoT Hub.
Before You Start
Go through Connecting a PC to EnOS tutorial as this tutorial will use the models and devices in the document.
Ensure that you have a tool to send HTTP protocol, such as Postman or cURL. This tutorial will be using Postman’s GUI.
Ensure that you have requested for the Device Integration Resource.
Step 1: Create Integration Flow
Log in to the EnOS Management Console, and click Device Integration > Flow Designer from the left navigation menu.
Click New Integration Flow, enter the flow name DIS-Demo, and click OK.
Step 2: Design Flow
You will enter the Flow Designer page with a blank canvas. A list of nodes will be displayed on the left.
Design and connect the flow with the following nodes in the order shown below.
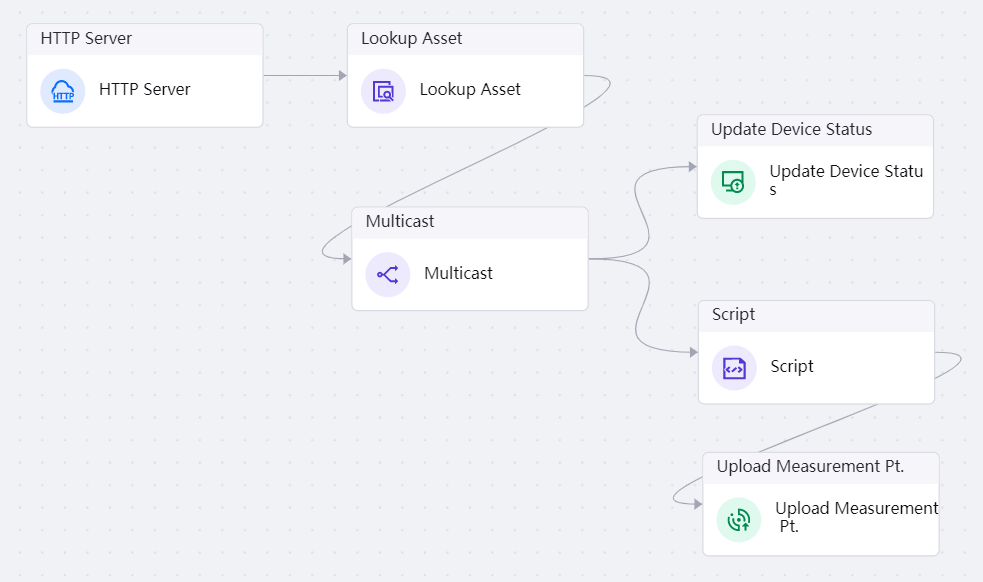
Configure the HTTP Server
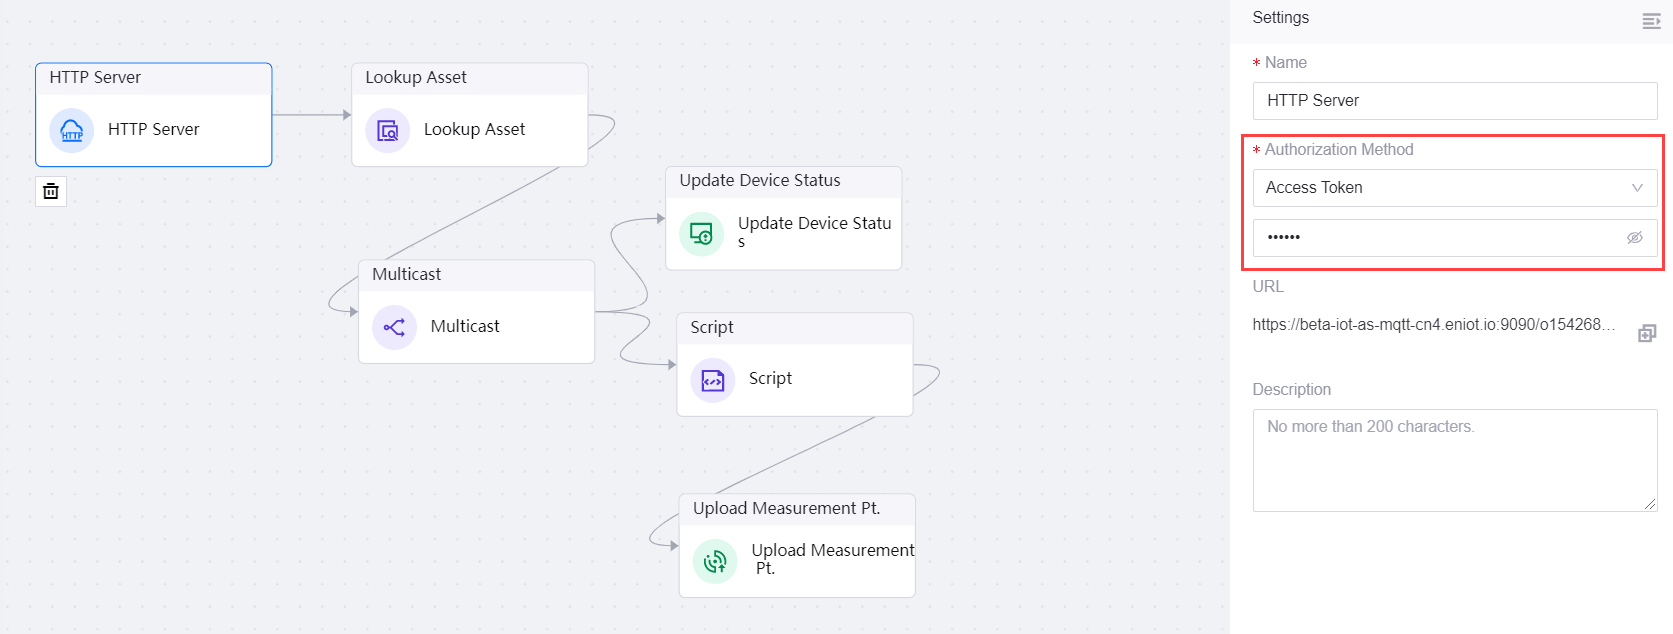
The HTTP Server node establishes an HTTP server. You can configure its authentication function in Settings.
Click the HTTP Server node.
Select Access Token from the Authentication Method drop-down and enter abc123 as the authentication token.
Note
The URL is the access address of the HTTPS service that is automatically assigned by the device integration service and cannot be edited.
For more information about the HTTP Server node, see HTTP Server.
Configue the Asset Mapping
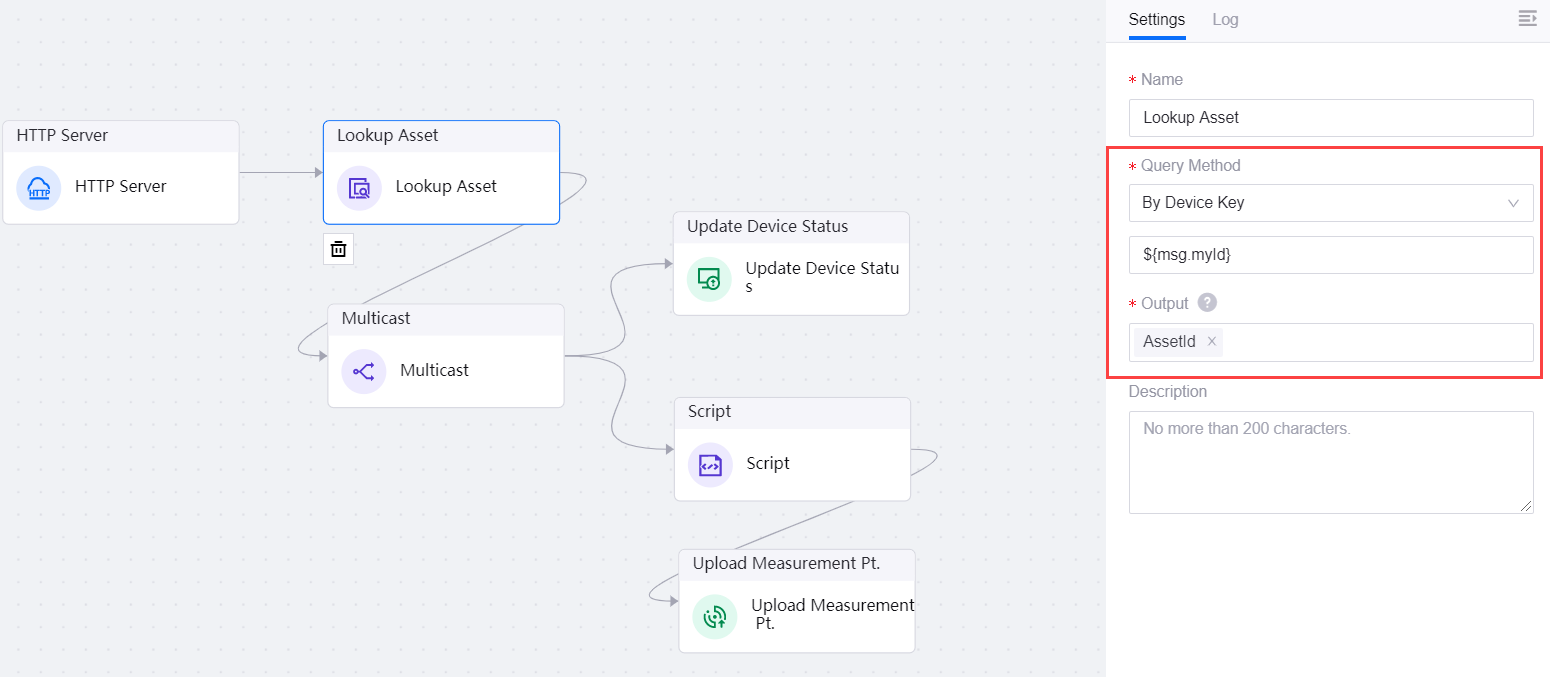
The PC device will send myID as the device ID defined by IoT Hub through the HTTP protocol, which is mapped to the asset ID in IoT Hub through the Lookup Asset node.
Click the Lookup Asset node.
Select By Device Key from the Query Method drop-down and enter the expression ${msg.myId} in the text field below. For more information about expressions, see Expressions.
Note
The data in the integration flow is stored in the msg and metadata variables and transferred between the nodes using the format key:value. For example, if you need to configure the msg variables, you can enter ${msg.key}. In the case above, by using ${msg.myId}, the myId parameter value coming from the HTTP Server node can be obtained.
For more information about the Lookup Asset node, see Lookup Asset.
Broadcast Data to Different Branches
The Multicast node copies the data from the previous node and distribute it to each subsequent connected downstream node, where the nodes will process the data accordingly.
For more information about the Multicast node, see Multicast.
Configuring the Update Device Status Branch
Click the Update Device Status node.
Enter ${msg.assetId} for AssetId, select Online for Status, and enter 60 for the Login Duration.
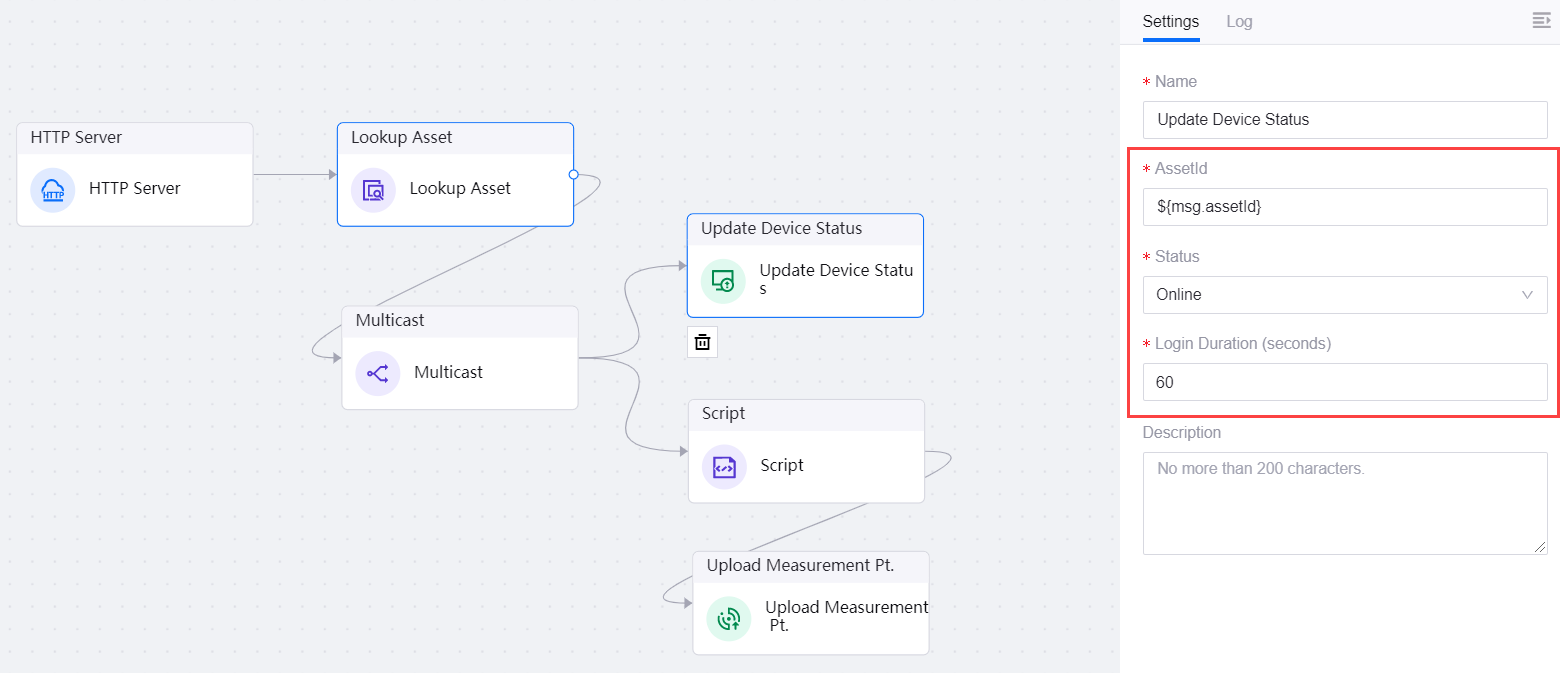
For more information about the Update Device Status node, see Update Device Status.
Configure the Device Data Conversion Branch
Conversion of the data to the EnOS IoT Hub standard format can be done through the Script node by using Javascript. The converted data is then uploaded to IoT Hub.
Click the Script node.
Click the Script tab.
Write a measurement point conversion function according the the data format required by IoT Hub as per the below.
function transformMyData(assetId, pointValue) {
    return [{
        "assetId": assetId,
        "measurepoints": {
            "cpu_used": 0.2+(Math.random()/10.0),
            "mem_used": pointValue
        },
        "time": new Date().getTime(),
        },
    ]
}
After which, write the code to complete the data conversion and return it in JSON format.
var data = transformMyData(msg.assetId, msg.myValue);
return tools.resultBuilder.build(true, JSON.stringify(data));
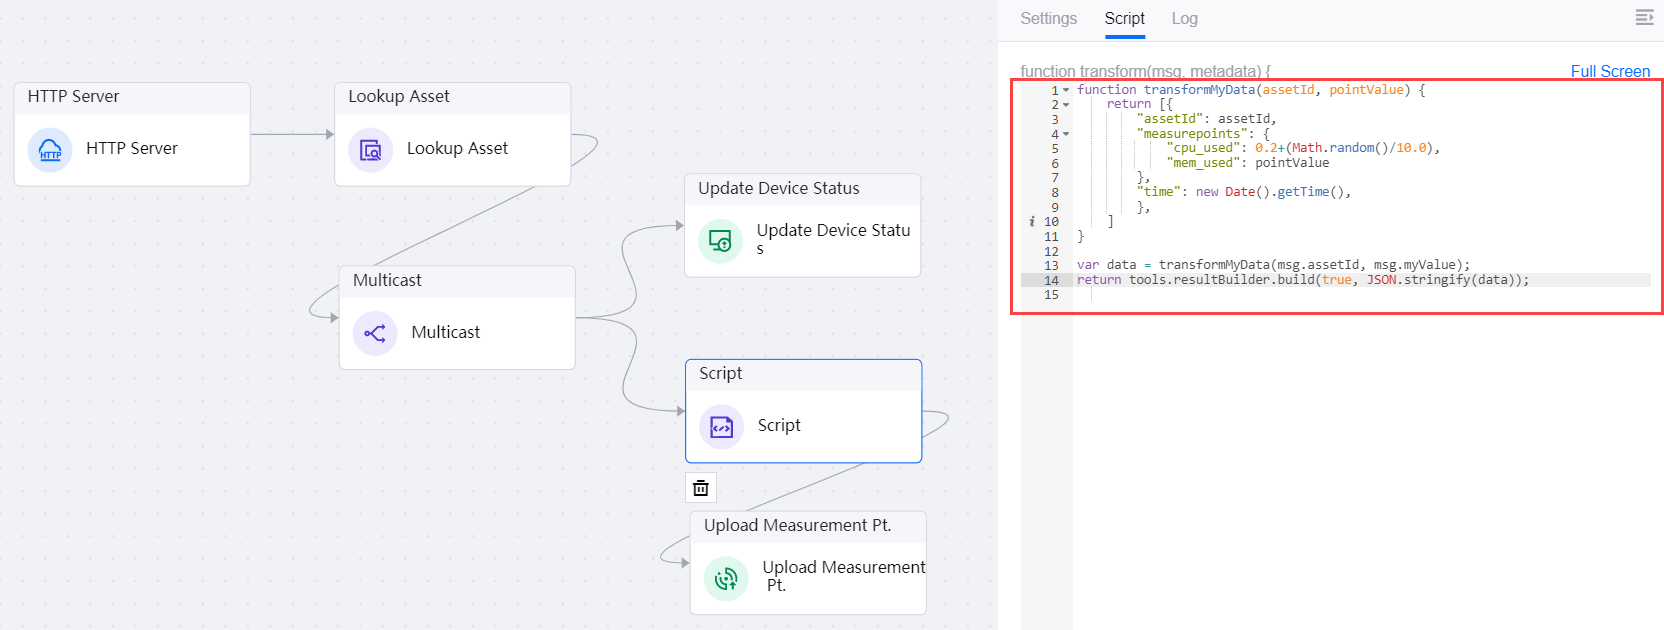
Click Test.
In the Input Msg text box, enter the stimulation data format sent by the device as per the below.
{
    "myId": "DIS-PC1000",
    "myValue": 50
}
Click Test.
Check for abnormalities in the data in Output Msg and click the OK button to complete the script test.
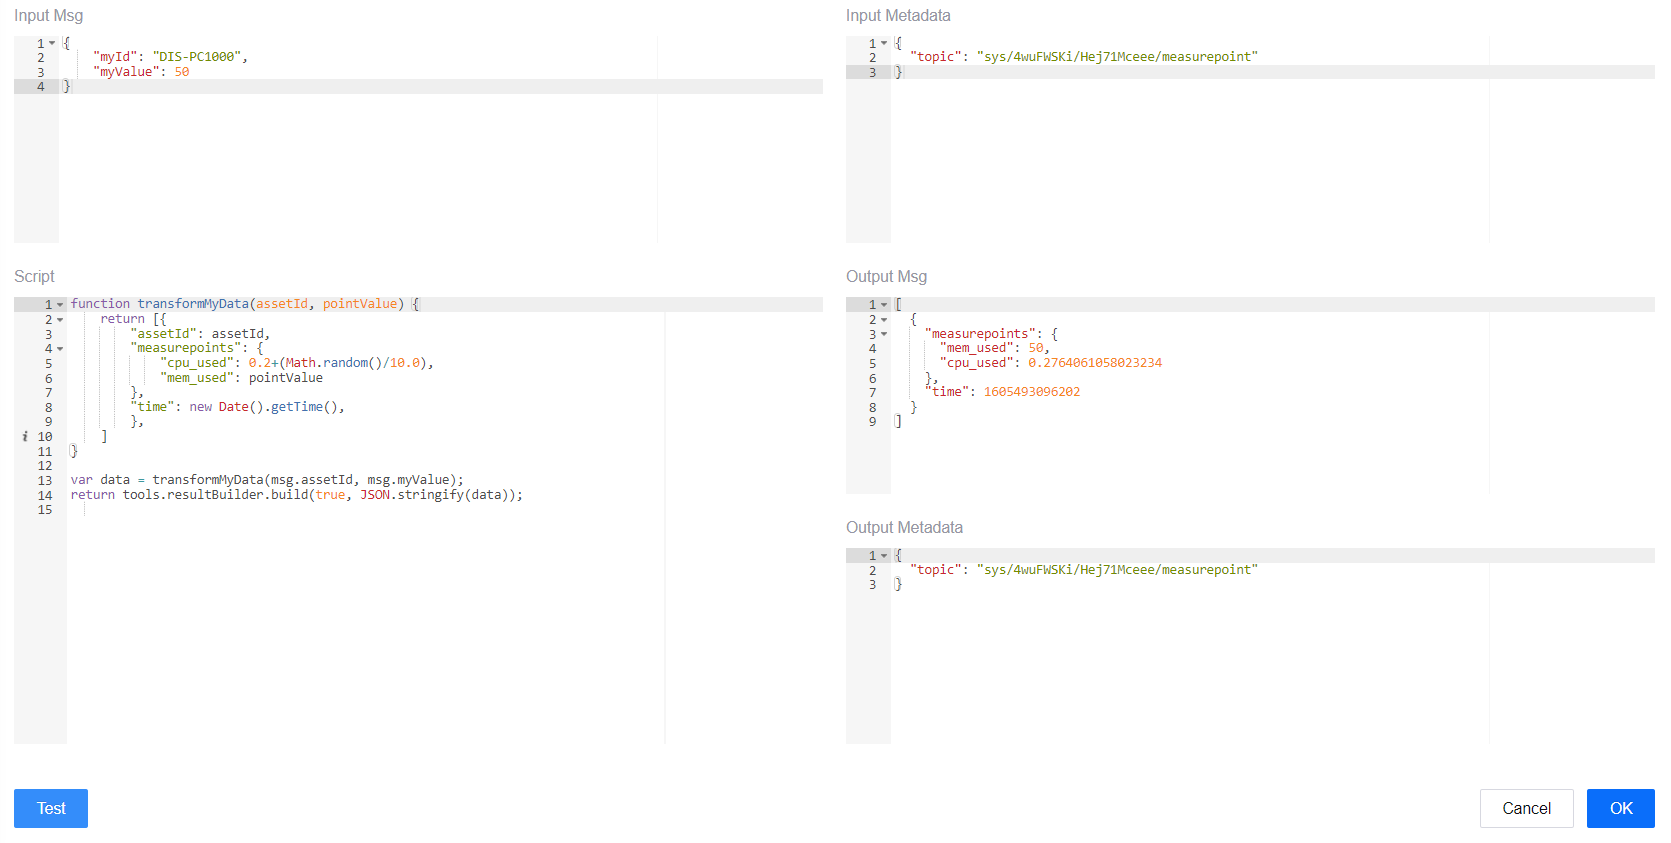
For more information about the Script node, see Script.
Upload Device Data to IoT Hub
The Upload Measurement Pt. node uploads the input from the previous node to IoT Hub.
Note
The input data format from the previous node must be the format required by IoT Hub. For more information, see Upload Measurement Point.
Step 3: Publish Flow
Enable the Debug switch at the top right corner, click Save and Publish.

Return to the list of integration flows and you will be able to see its running status.
After publishing successfully, the integration flow will have a Running status where the flow operations will be carried out.

Data Integration Testing
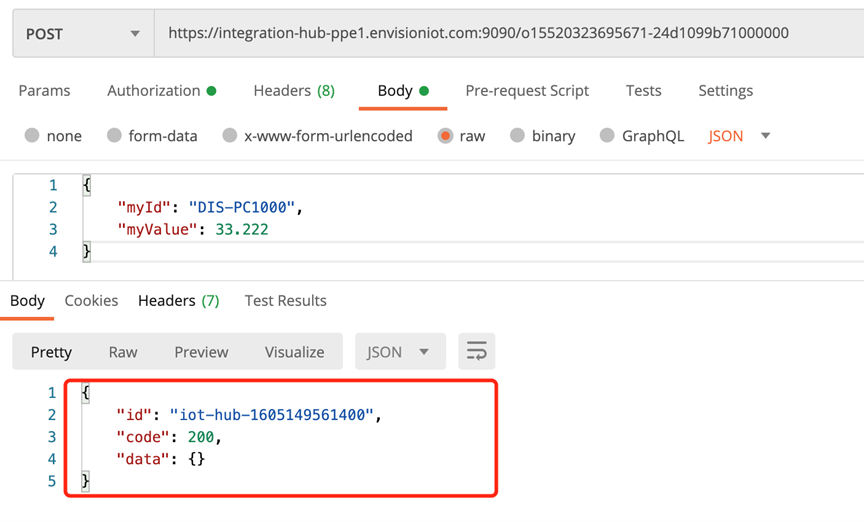
Open the Postman tool for testing and create a POST request.
Select POST in the address bar and enter the URL provided by the HTTP Server node.
In the Authorization tab, select Bearer Token in the TYPE drop-down, and enter the token configured in the HTTP Server node, which is abc123.

In the Body tab, select raw and JSON, and enter the JSON protocol data of the device for the simulation test.
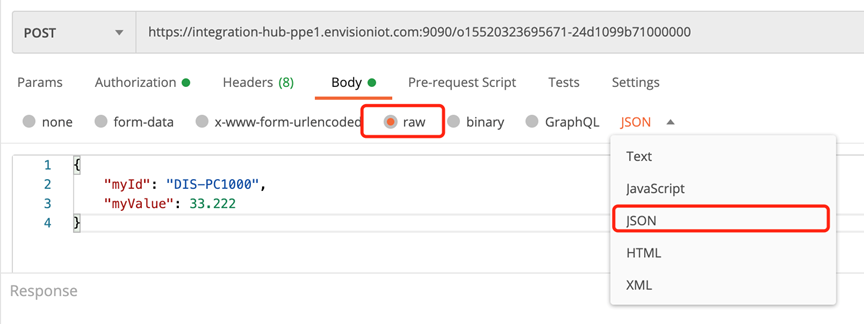
Click Send to send the request and test the connection. If the test is successful, the HTTP Server will return data in JSON format with code 200.
Note
If you do not have Postman installed, you can also use other tools to test. The command reference is as per the below.
Linux/MacOS:

Checking the Integrated Data
In the EnOS Console Management, go to Device Management > Device Assets to check the online status of the connected device.

Click the View icon for the device and click the Measurement Points tab to check the integrated data.

Enable the Real-time Update switch to continuously send HTTP requests and you can see the data changes.
Monitoring the Integration Flow
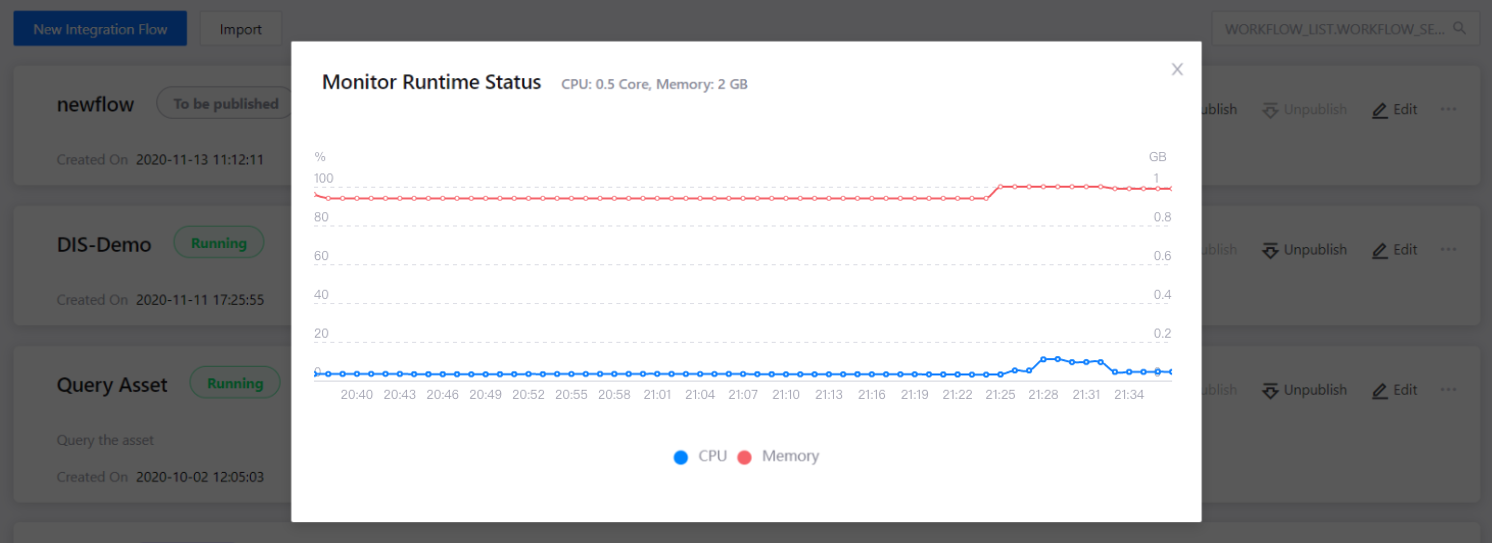
At the Flow Designer page, click … > Monitor Status for the DIS-Demo flow.

The pop-up windown will show a graph of the flow’s CPU and memory usage for the past hour.
