What’s New in R2405?
This section introduces the new services and features included in EnOS R2405.
Application Building
Application Portal
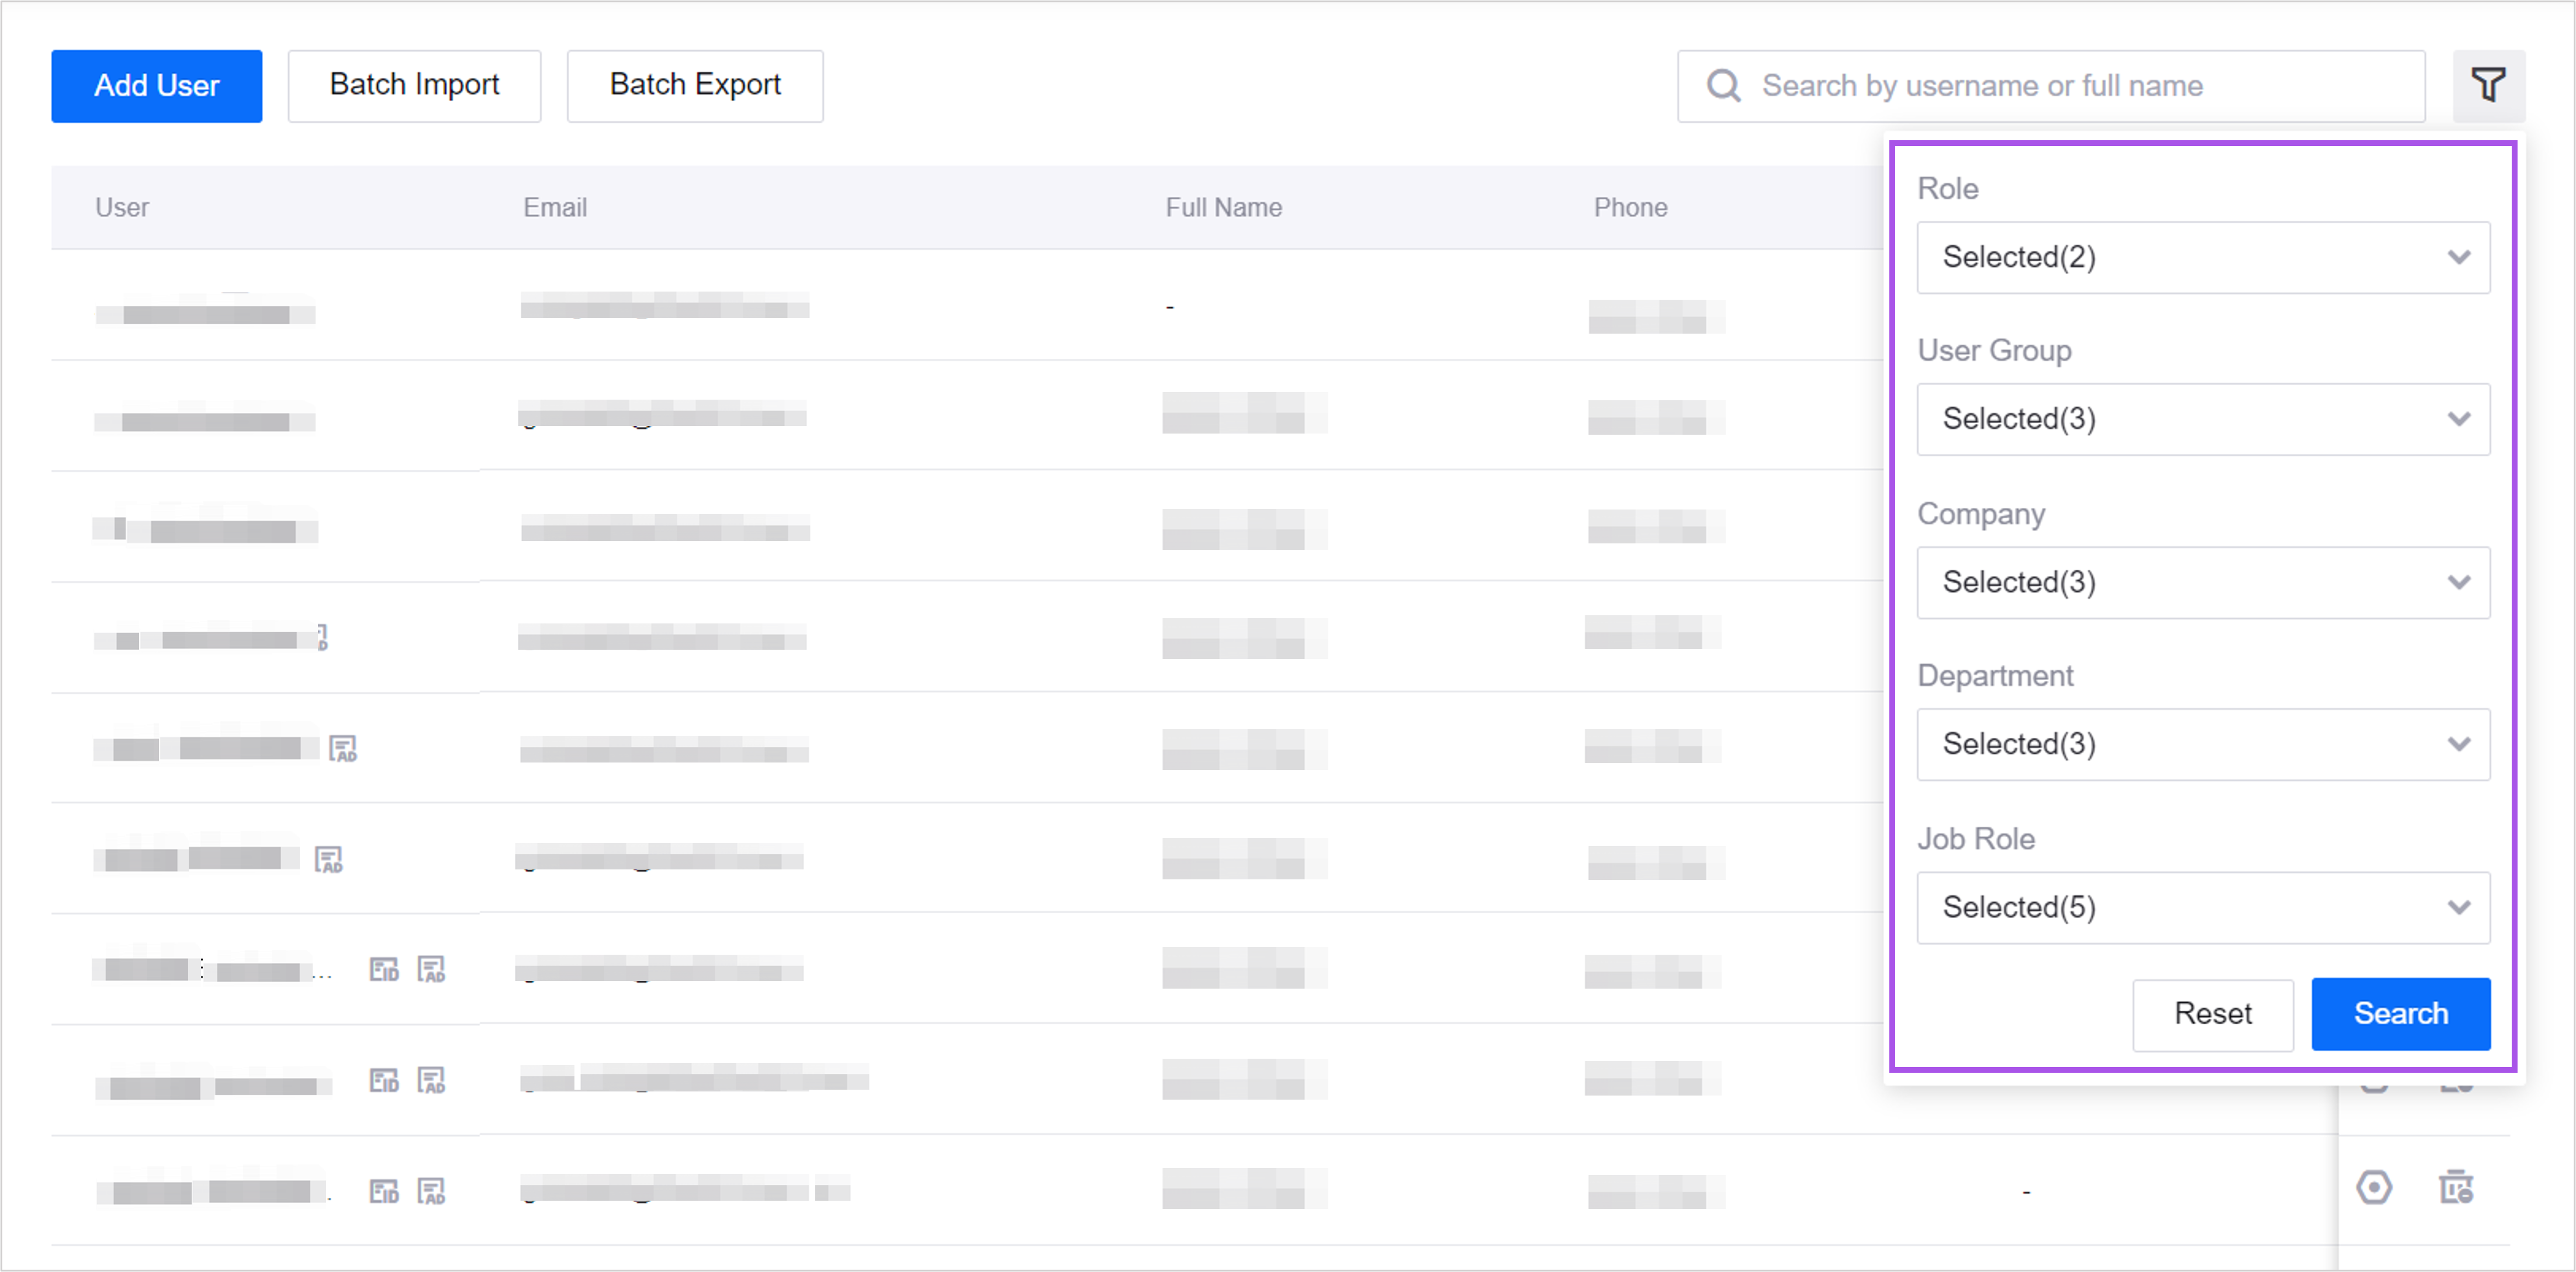
Added a filter in the user list for OU administrators to filter users by role, user group, company, department, and job role to improve user management efficiency.
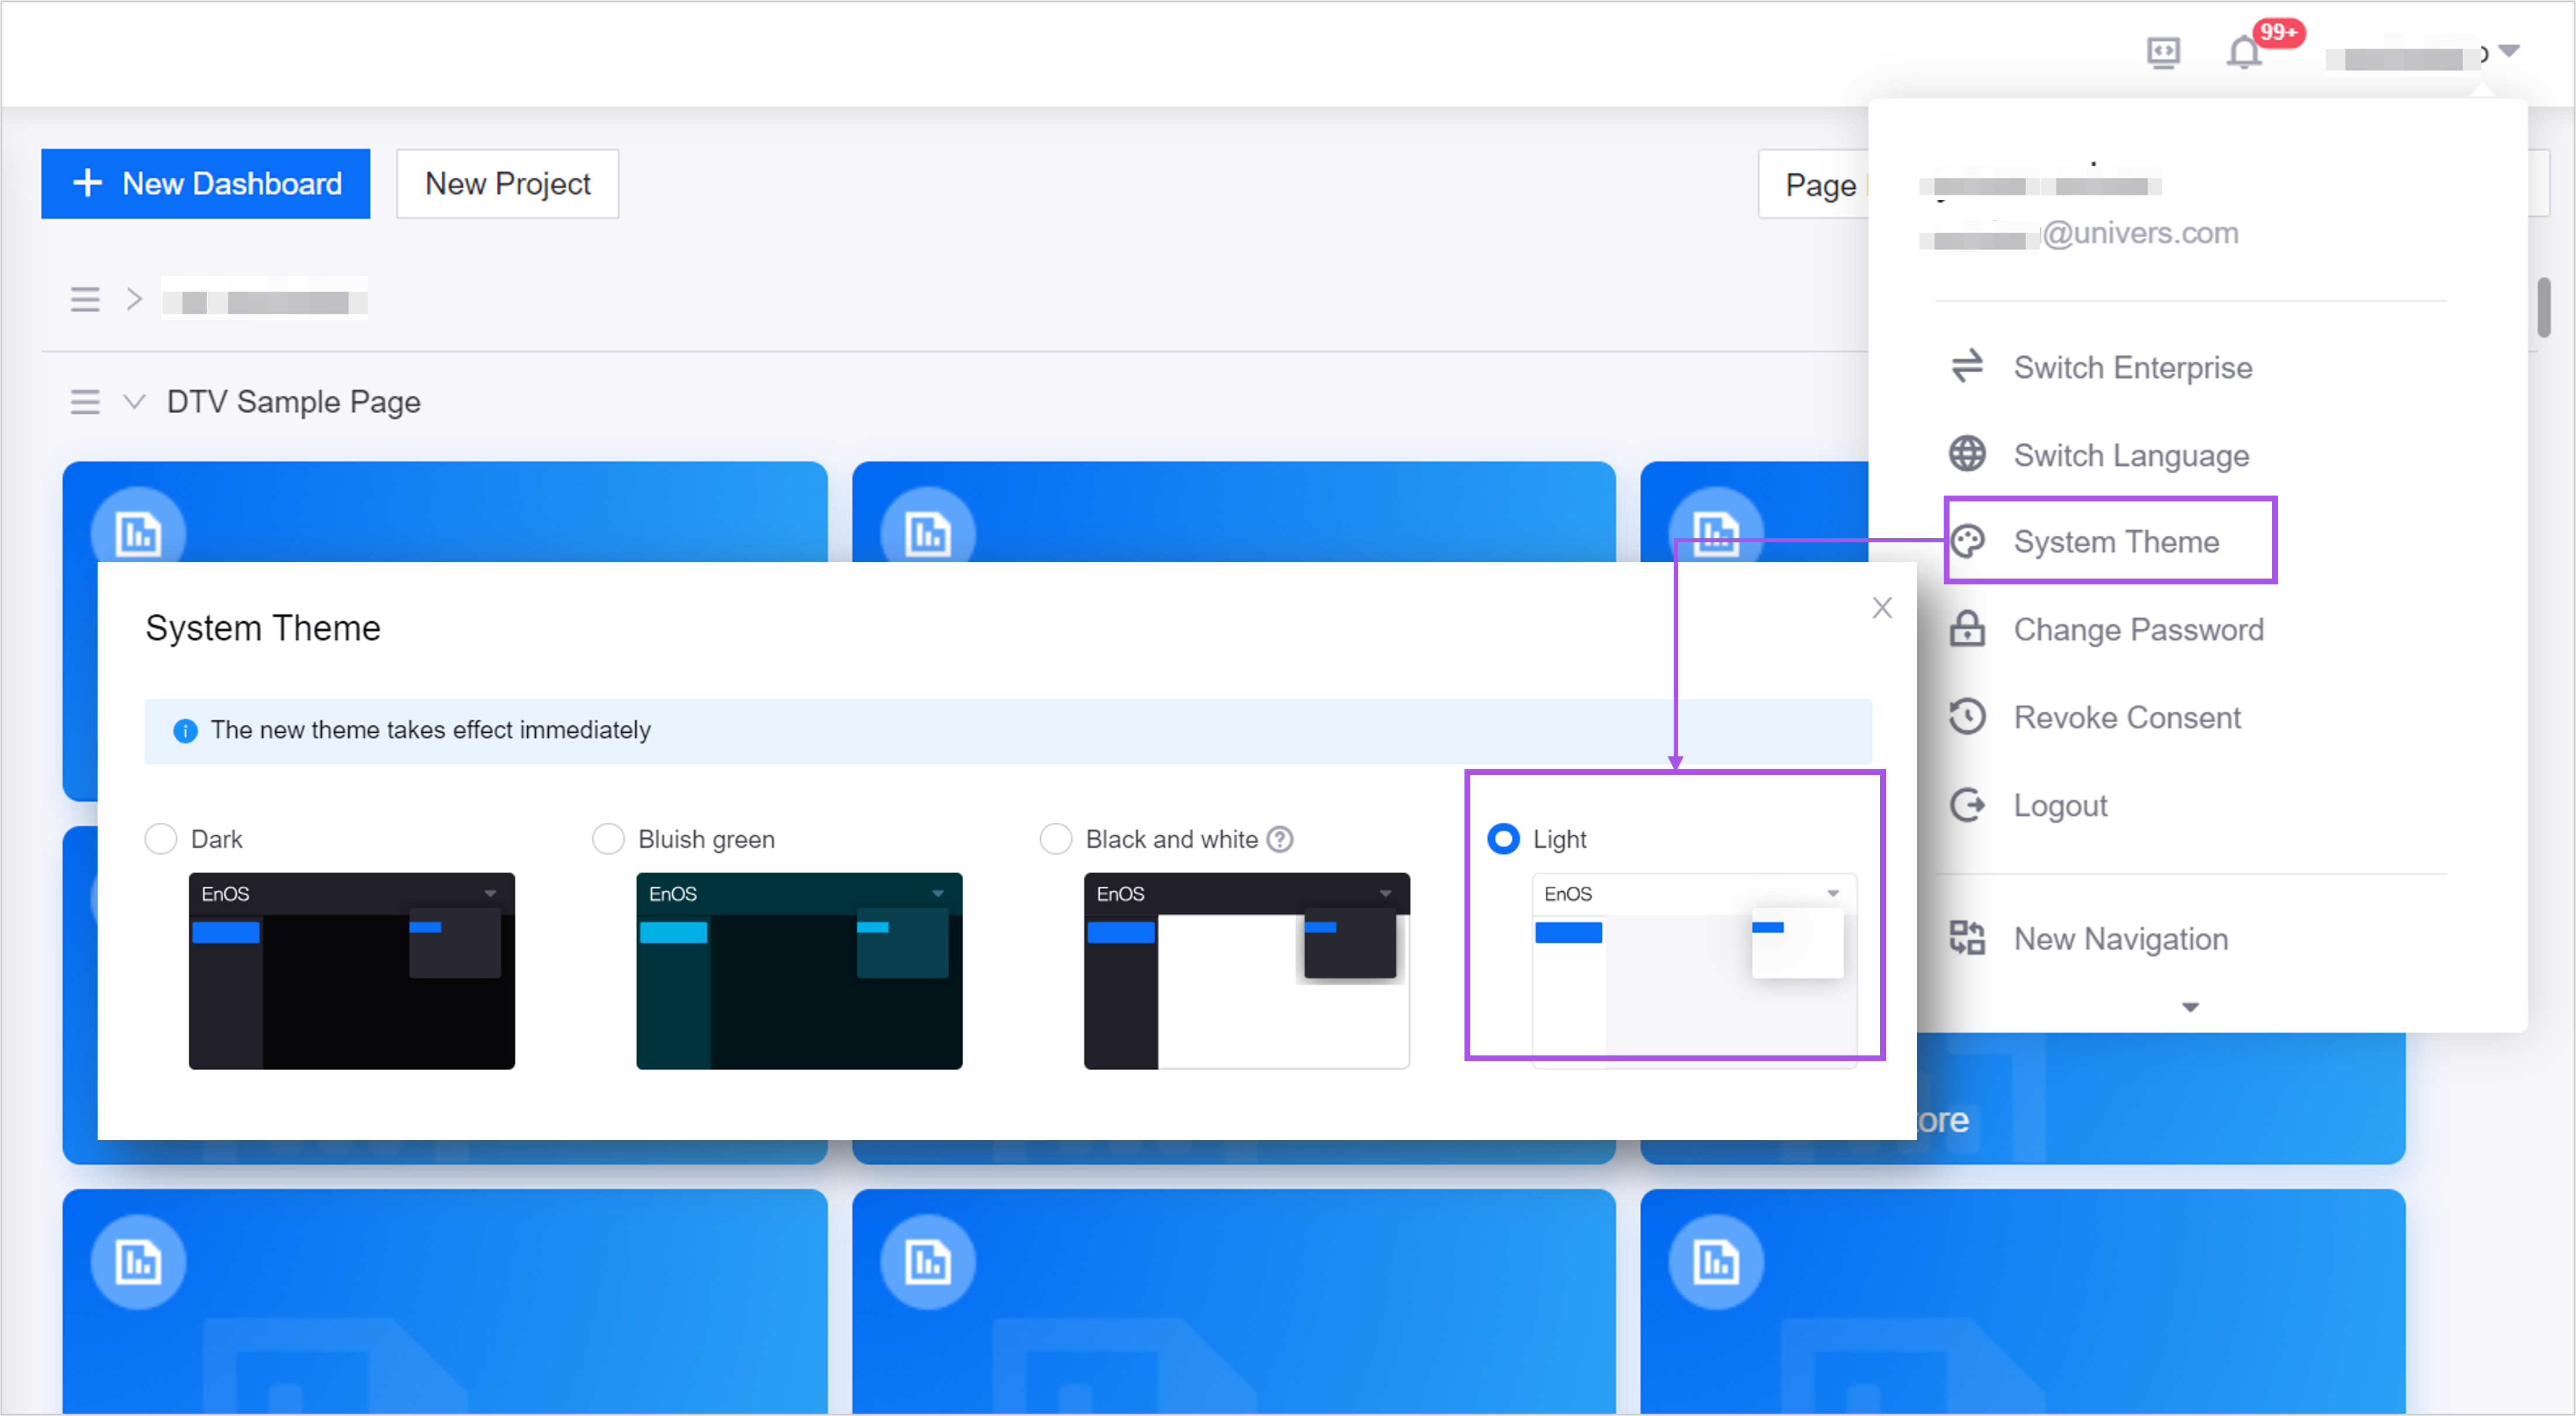
Added a Light theme in System Theme. Users can now switch to the light theme from the dropdown menu in the top right corner.
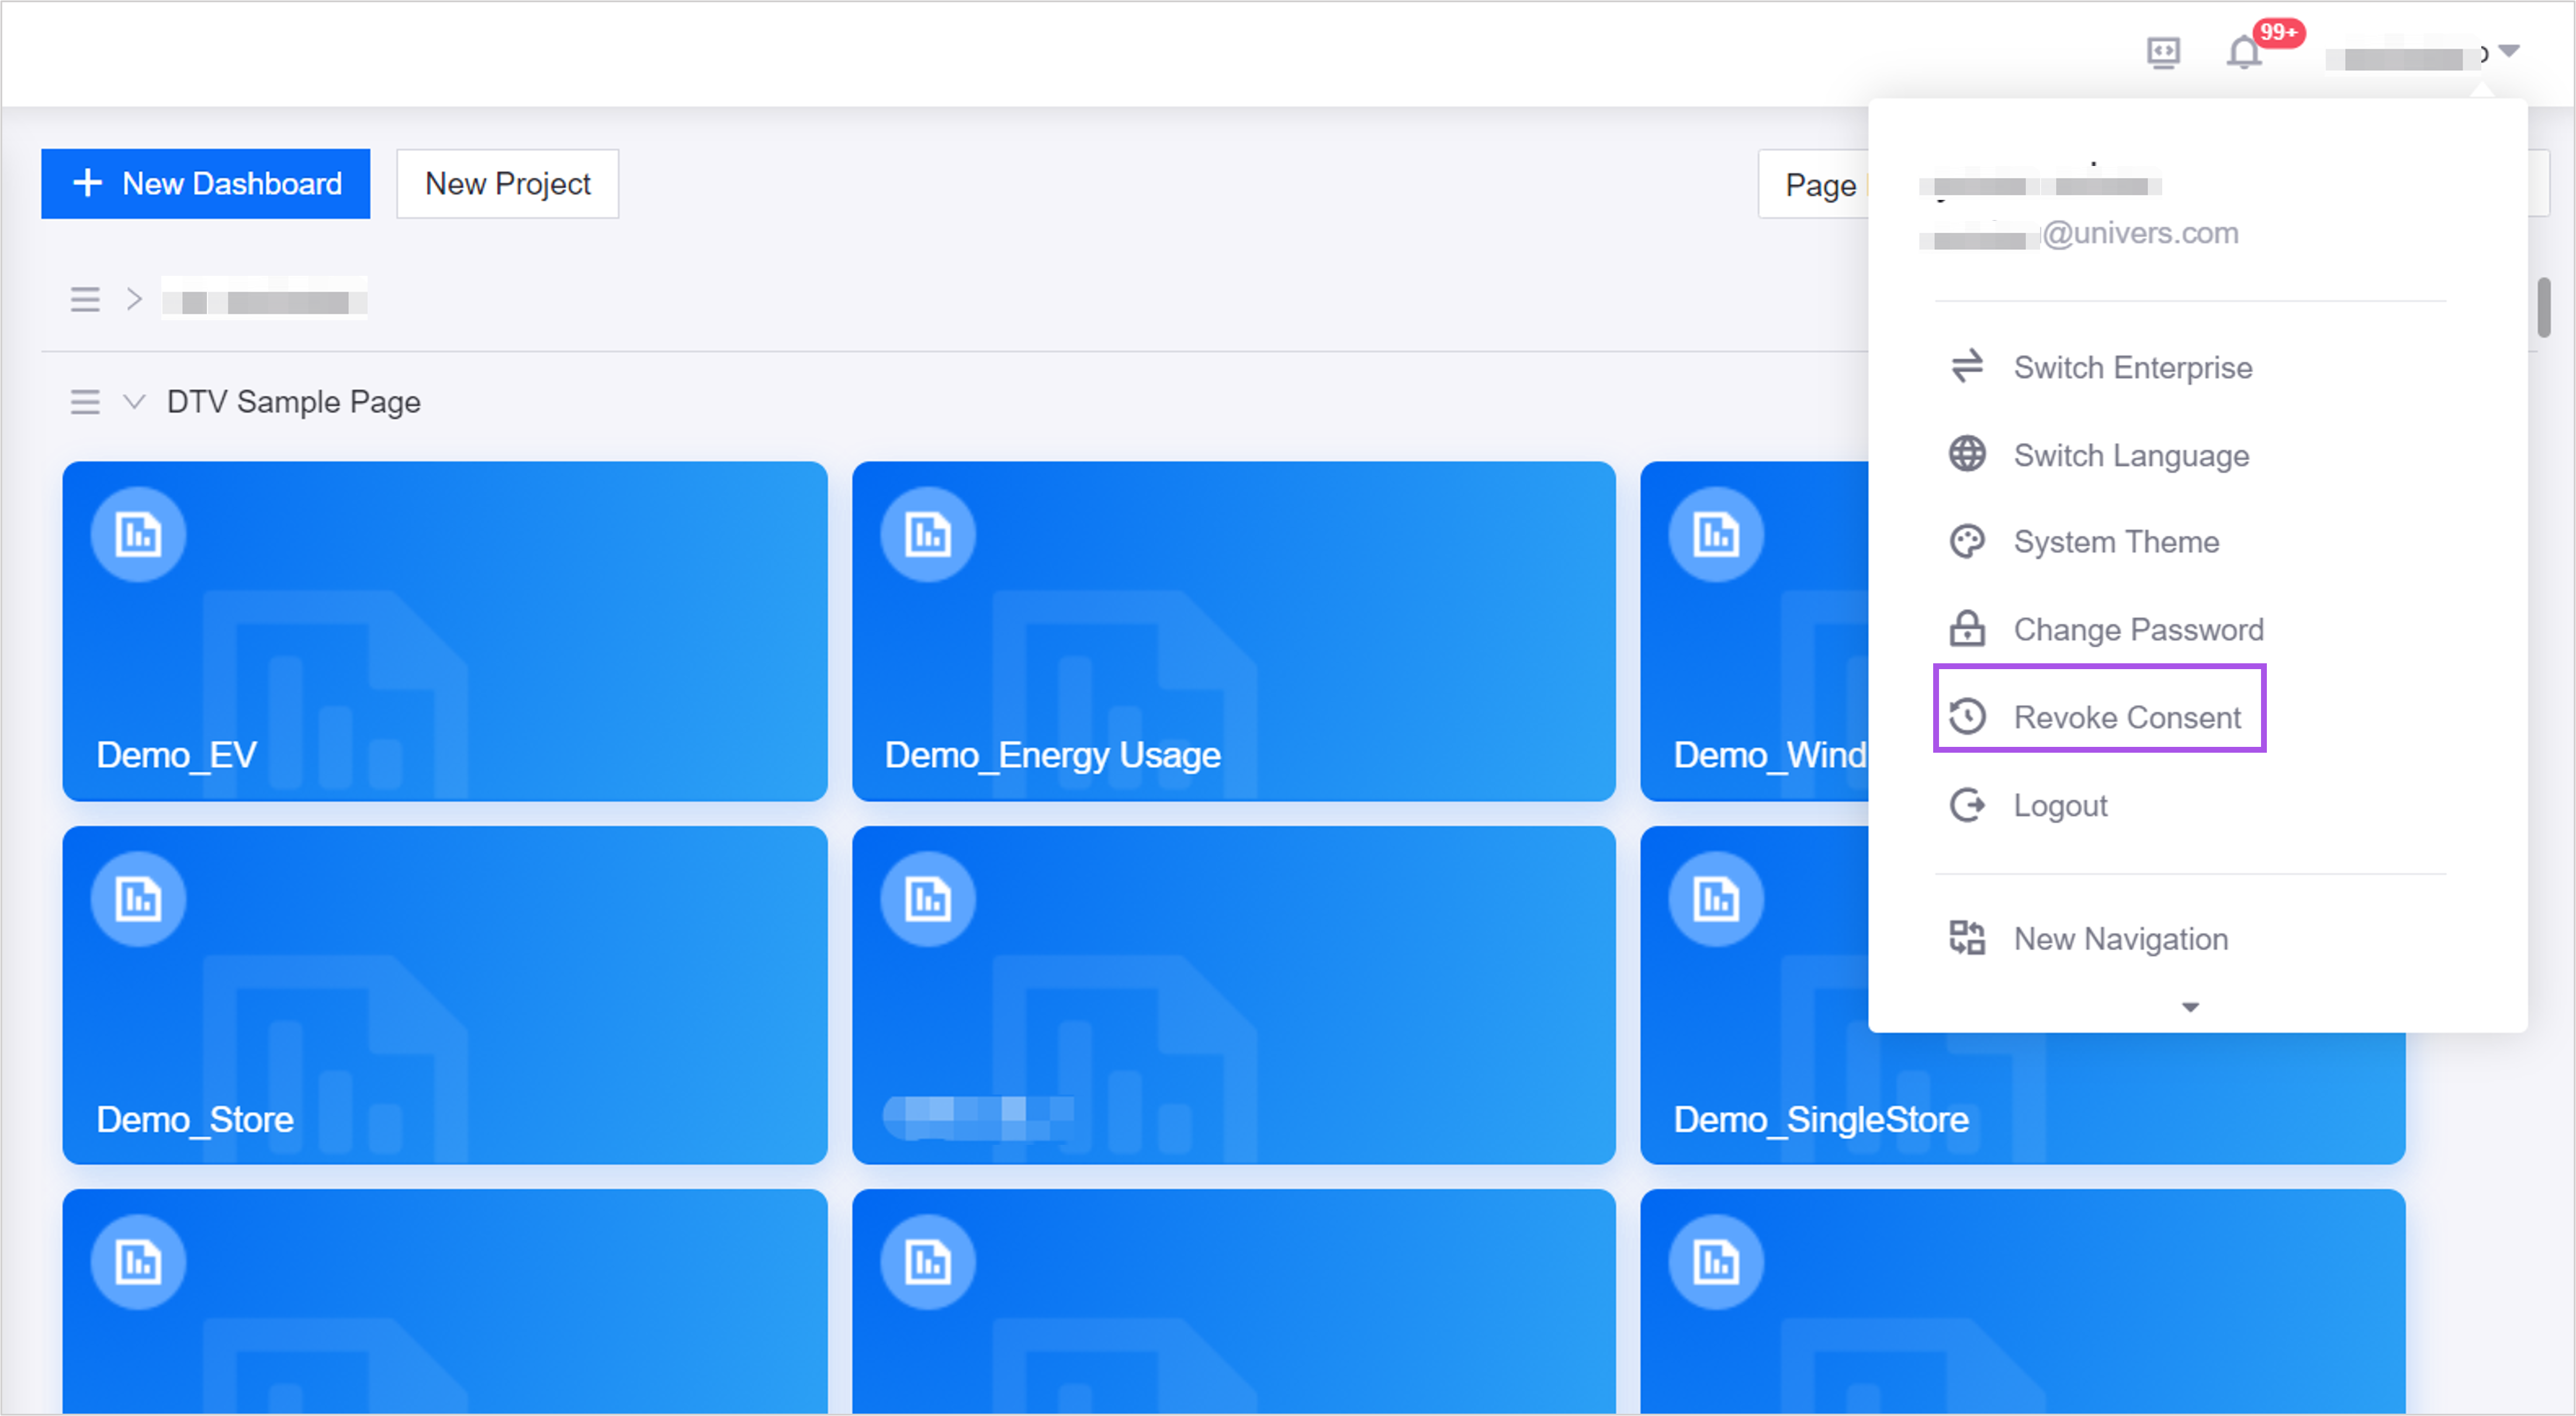
Added a Revoke Consent button for users to revoke the consent to Privacy Notice and User Agreement after logging in for privacy protection.
EnOS Mobile
Added a Revoke Consent button in Settings > About for users to revoke the consent to Privacy Notice and User Agreement after logging in for privacy protection.
Digital Twin Visualization
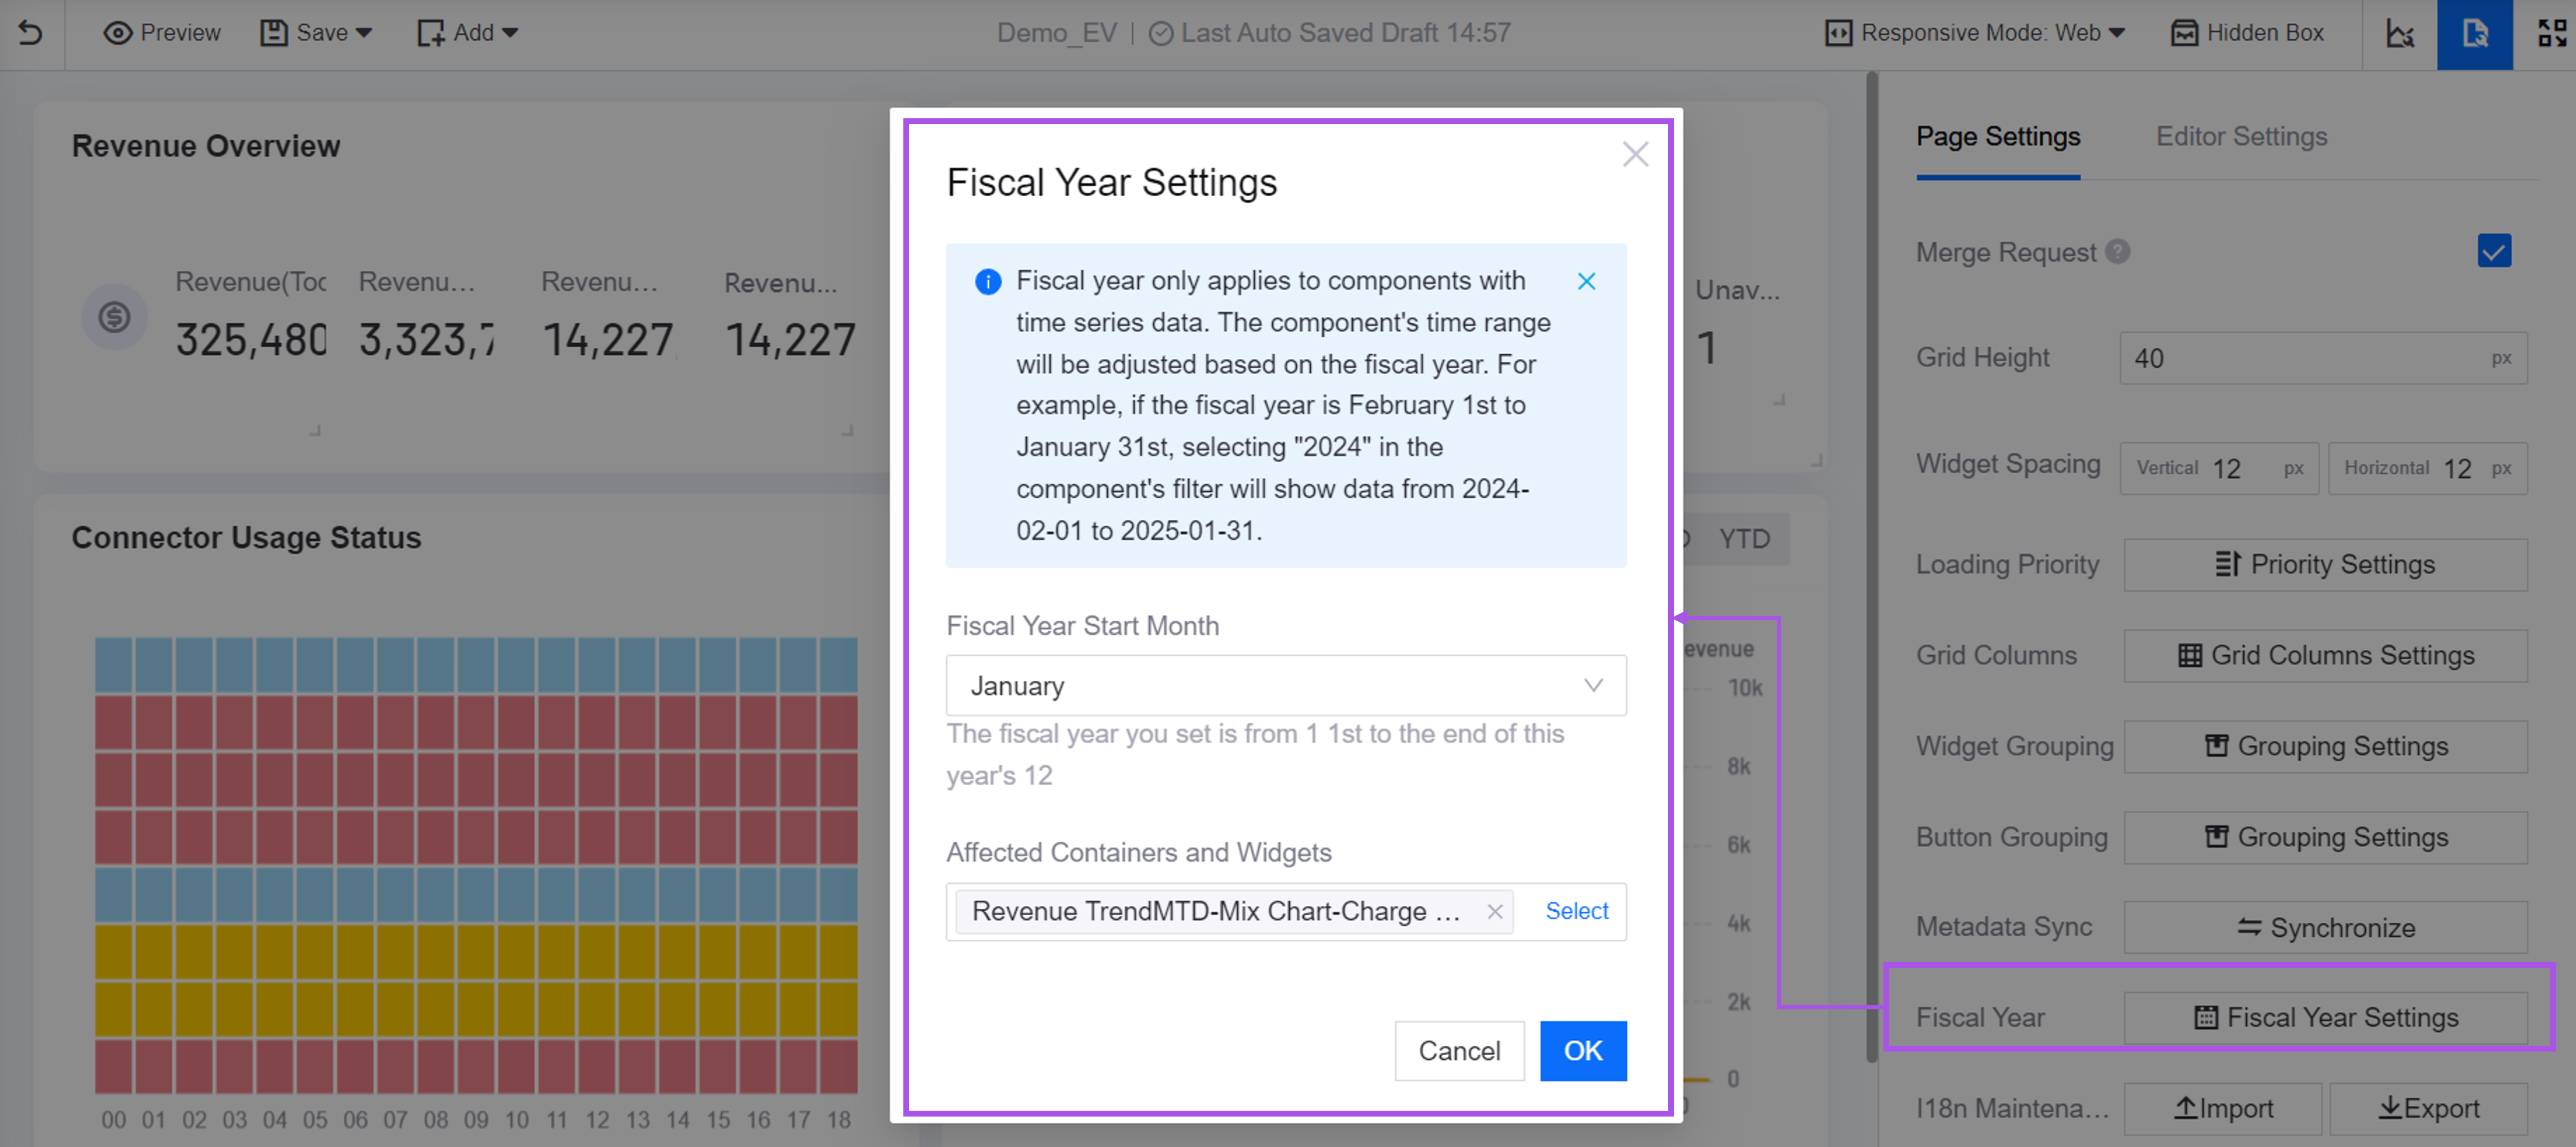
Added Fiscal Year Settings for application creators to set the fiscal year range in the dashboards. After the fiscal year start month and the affected containers and widgets is set, the containers and widgets will display data by fiscal year, while others will be default to display data by calendar year.
Added an alarm status item to the widget filters in the dashboards. After configuring the Common Data Service type Alarm data source for the widget filter, application creators can now filter alarm data by the acknowledgement status.

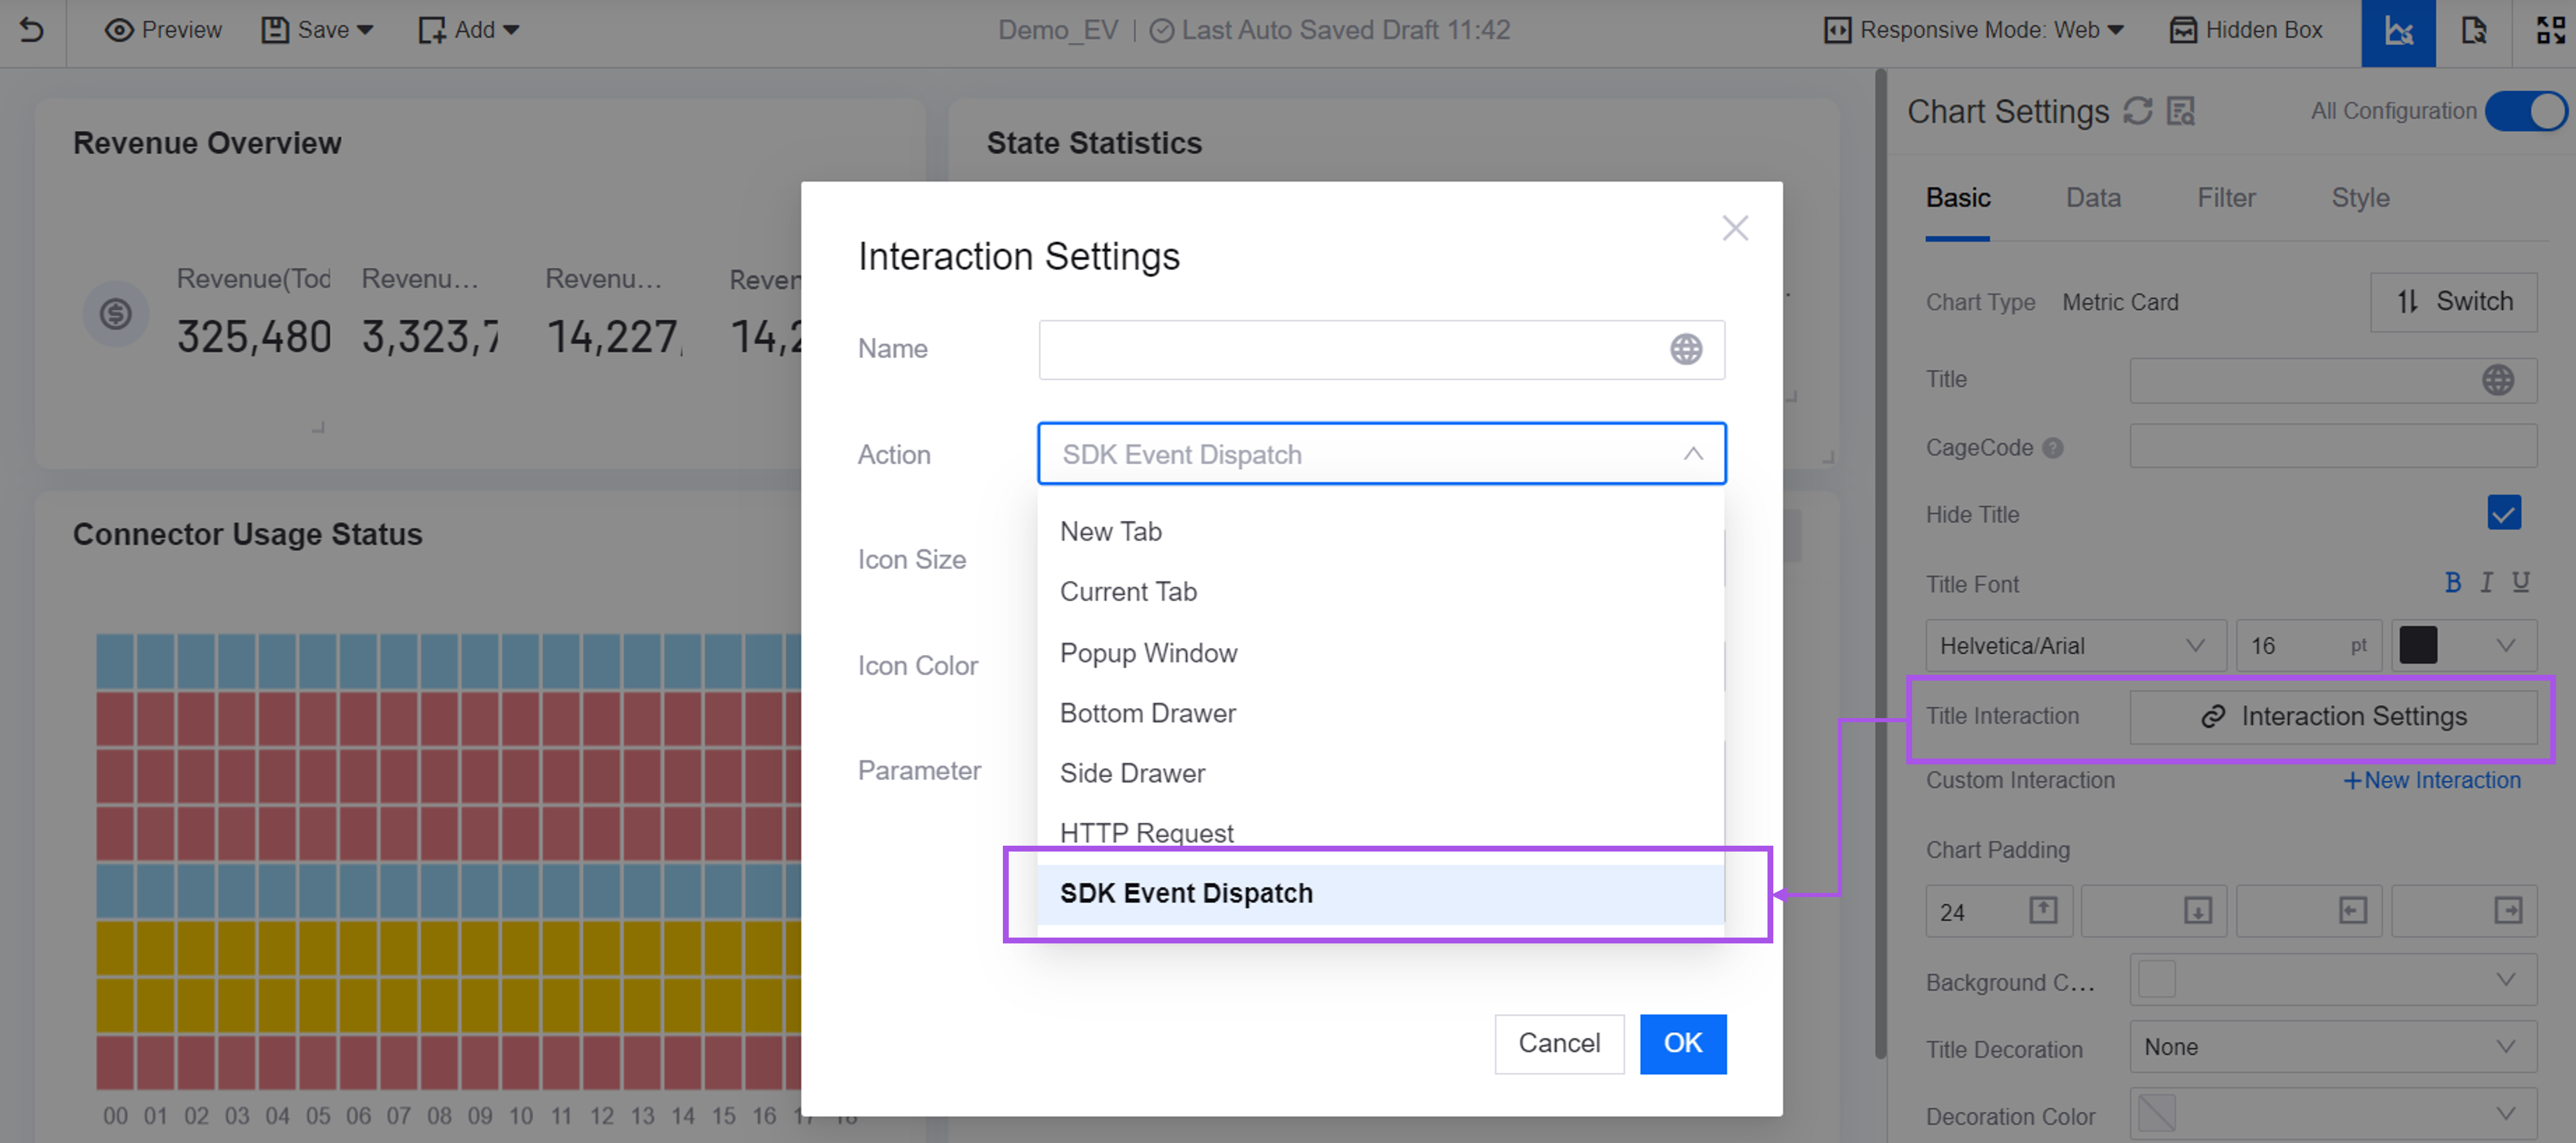
Added the SDK Event Dispatch action to Title Interaction for the dashboard widgets. This option enables application creators to configure an interaction where clicking a widget title triggers the dispatching of an SDK event, thereby expanding the range of interaction scenarios.
Added the display languages German and Italian. Application creators can now configure German and Italian for internationalized fields.
Unified Monitoring
Added a Coordinate System configuration item in Portfolio for application creators to set the coordinate system for assets and maps. When the assets and the maps use different coordinate systems, the assets’ coordinate will be automatically converted to the map’s coordinate for accurately display.
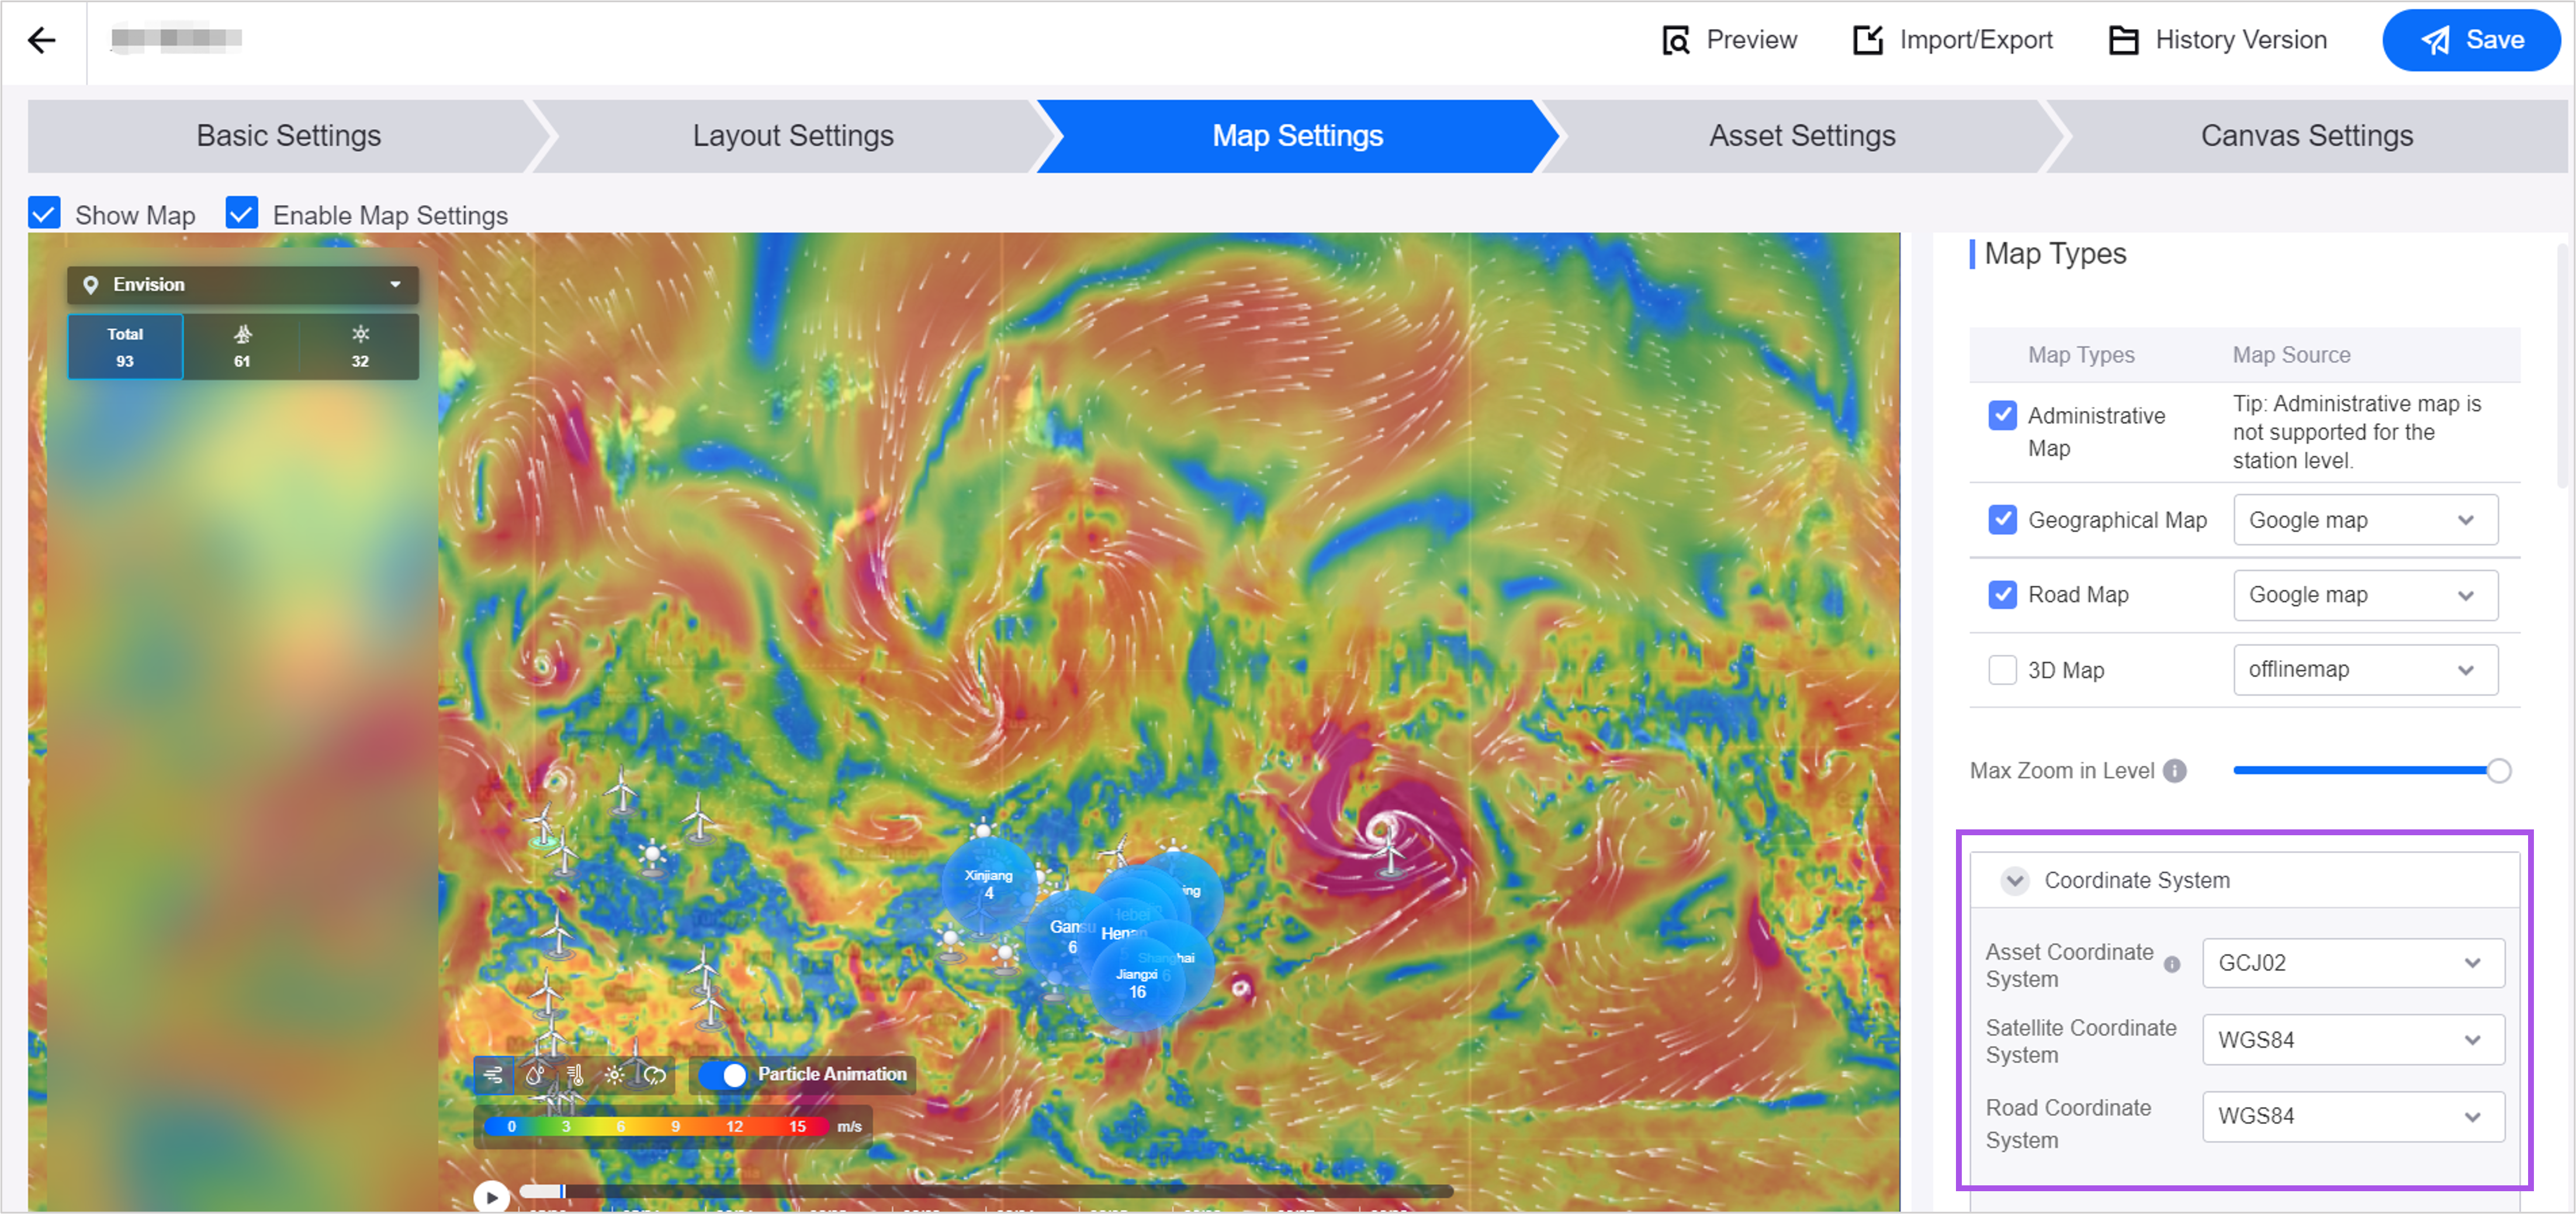
Added Layers to the global map in Portfolio:
Application creators can now configure layers such as Wind Speed, Temperature, and Humidity to dynamically display various weather data on the map.
Users can now display and switch between layers, enable particle animation, and move the timeline to view 10-day weather data to help accurately assess the impact of weather on assets.

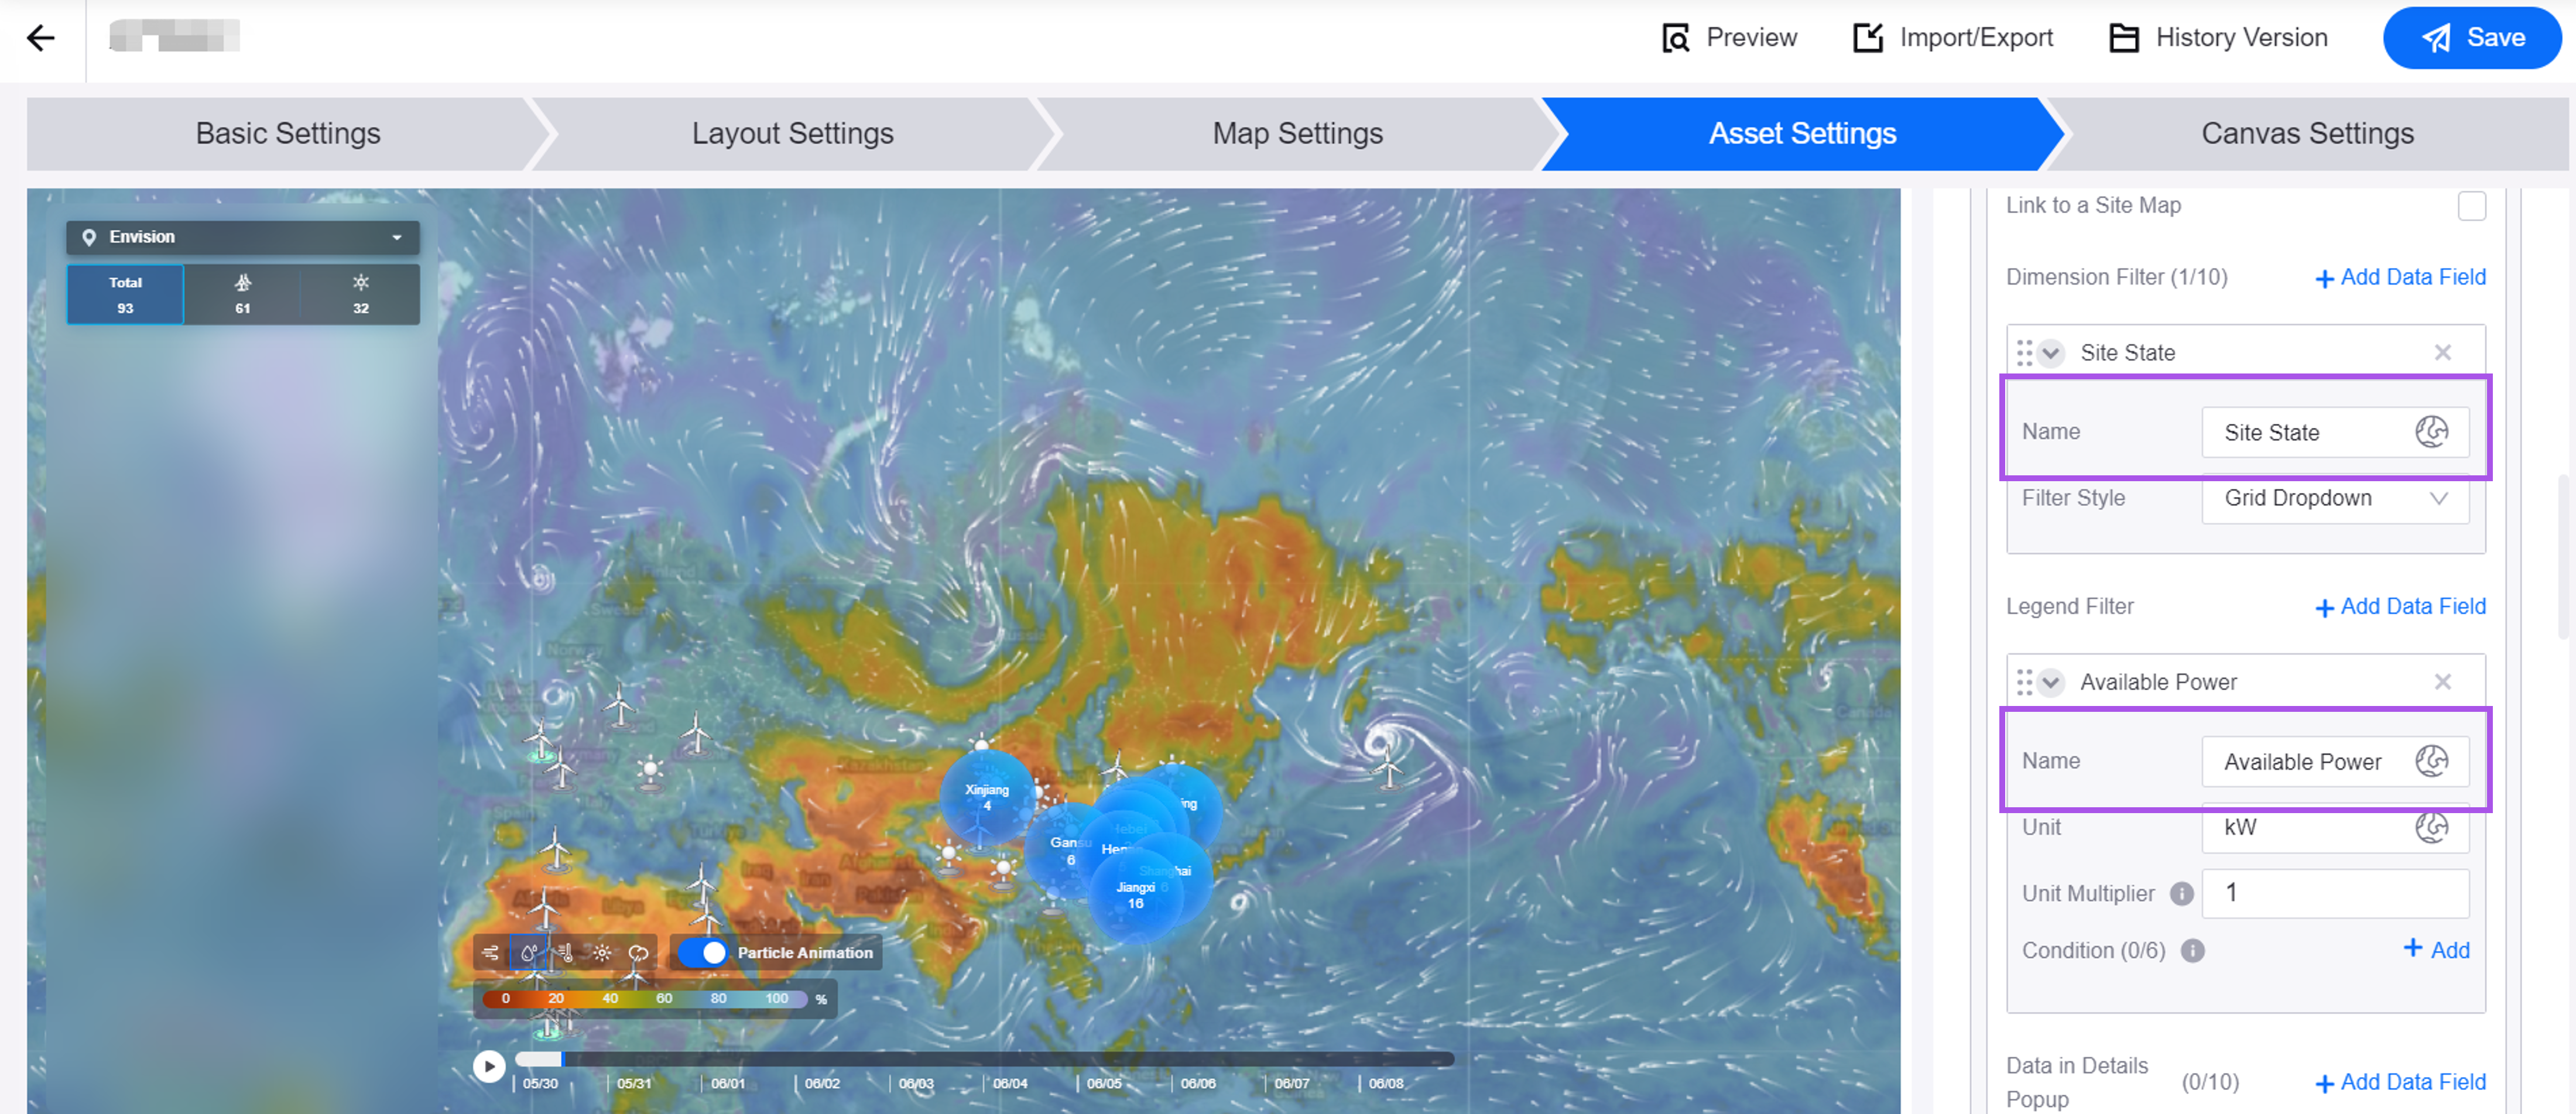
Added a Name configuration item for the filters in Portfolio for application creators to customize the display name of filters based on the business scenario.
Added an Asset List widget to the canvas in Portfolio for application creators to add asset lists to the left, top, or right panels of the global and regional maps to display asset data in a list.
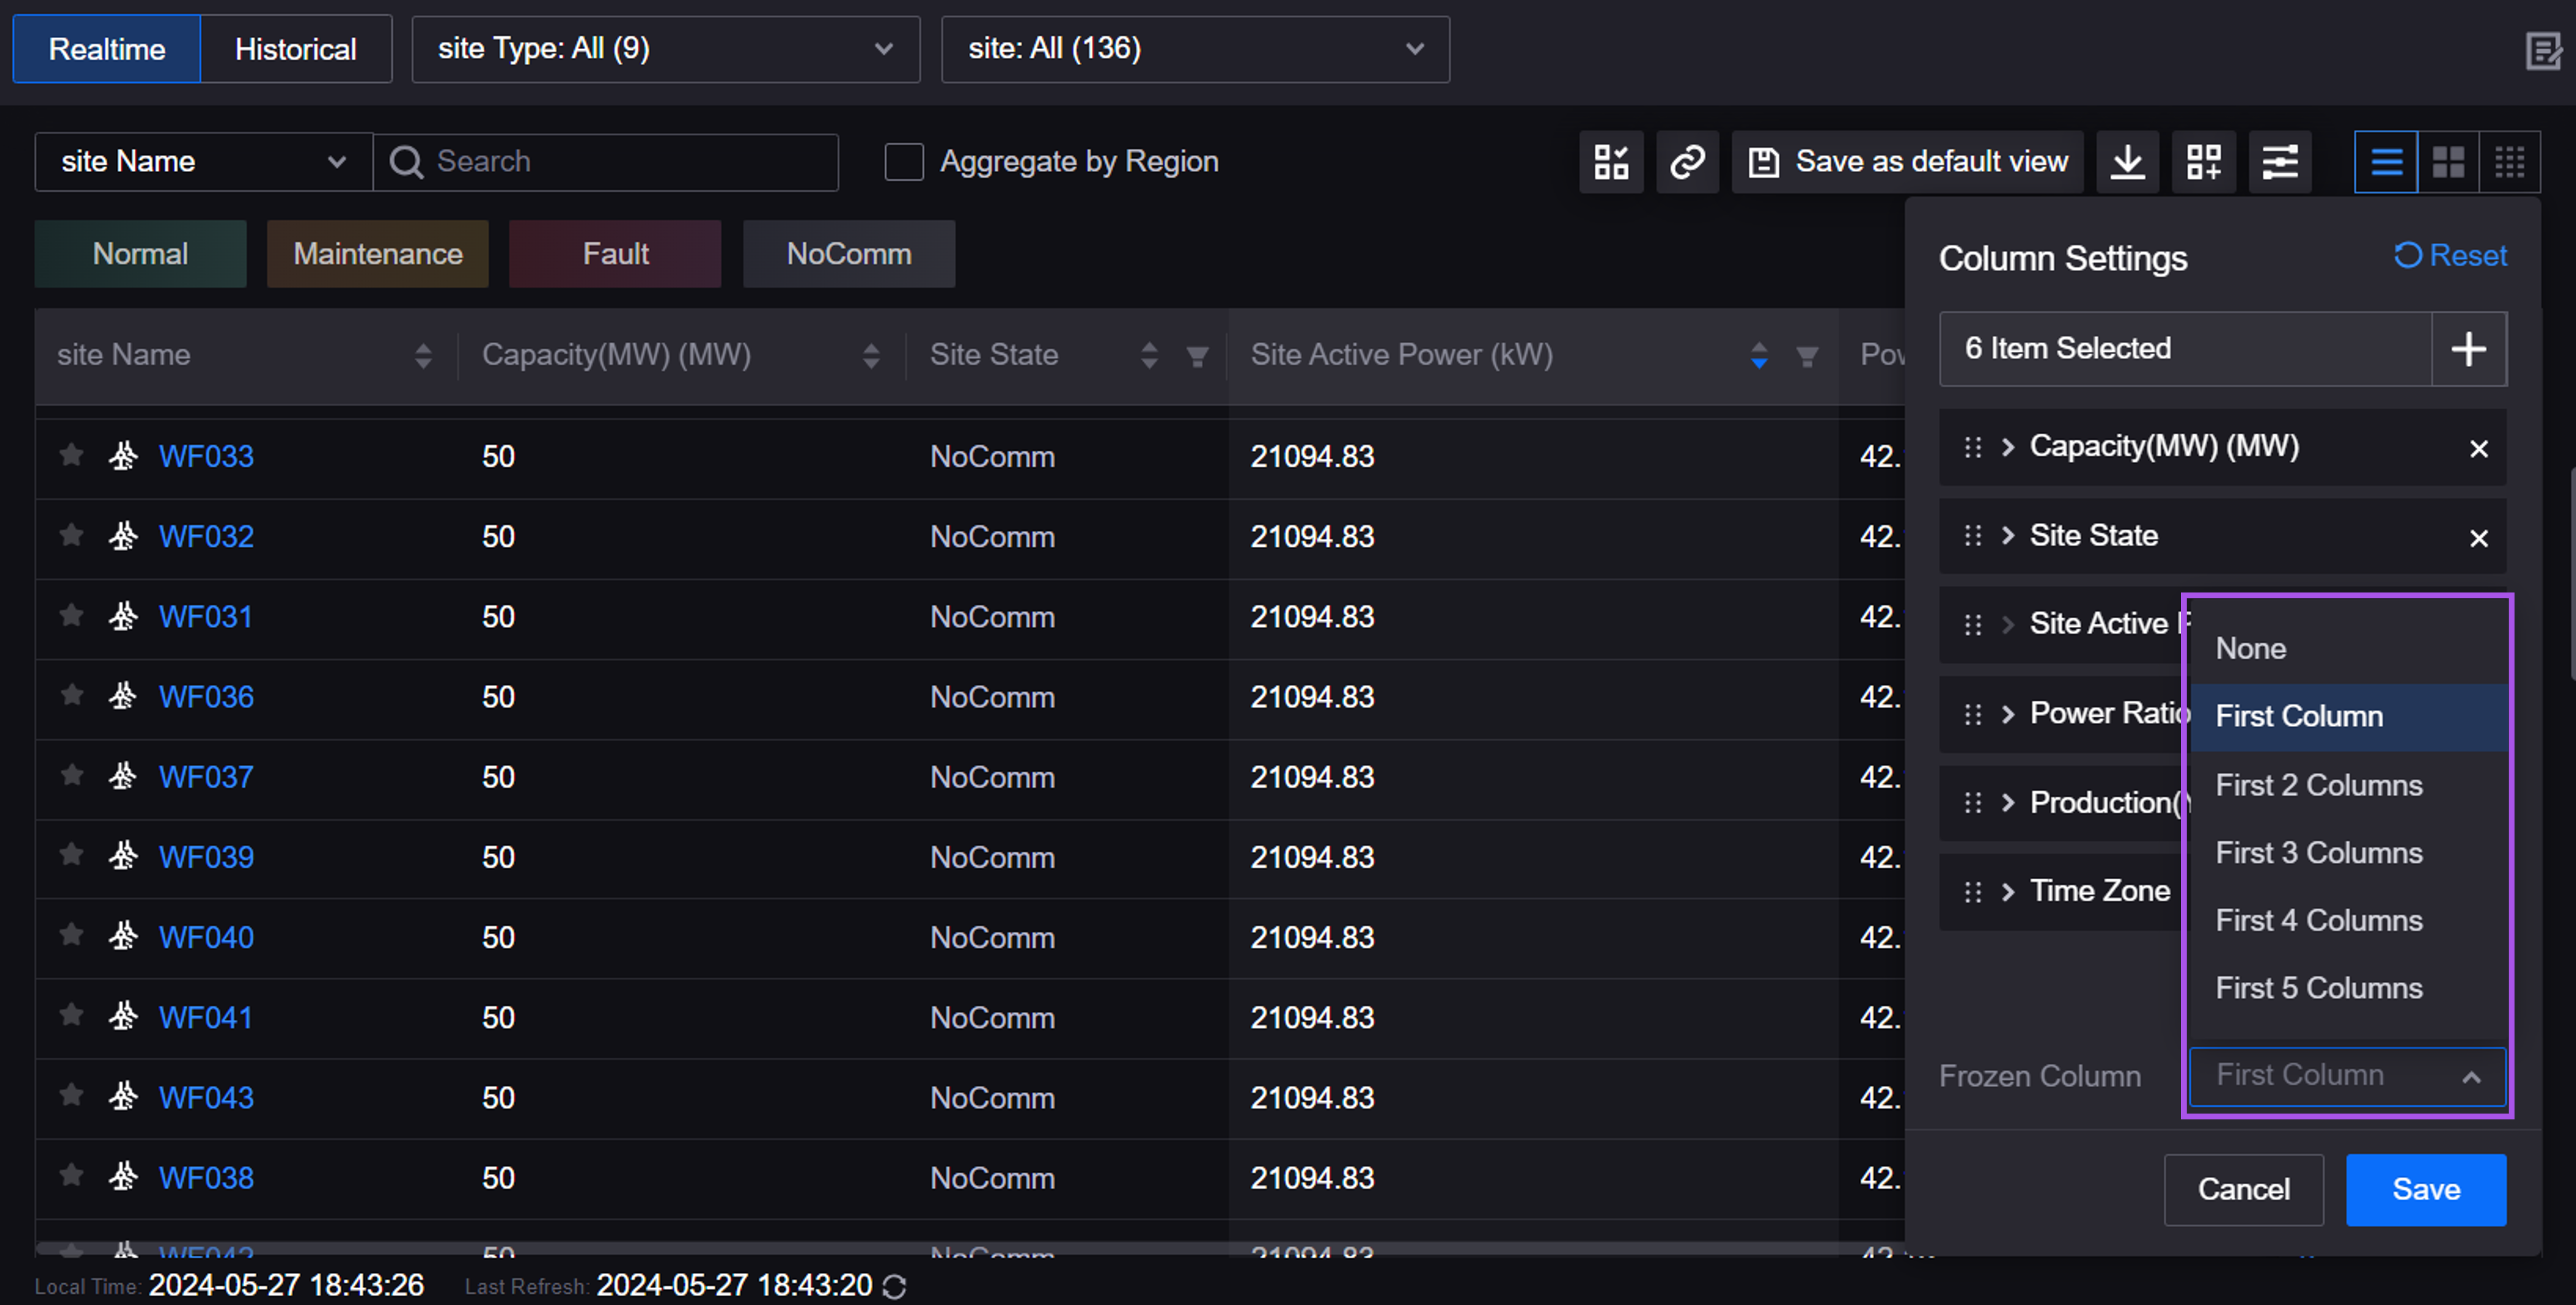
Added Frozen Column in Column Settings for users to freeze multiple columns in Asset List for easier data analysis and comparison.
Added the display languages German and Italian. Application creators can now configure German and Italian for internationalized fields.
Reporting Tool
Added the display language Japanese. Application creators can now create report templates in Japanese.
Work Management
Application creators can now display real-time data of work orders from 3rd-party Computerized Maintenance Management Systems (CMMS) in Schedule Board. Users can now schedule the 3rd-party work orders by drag-and-drop, enabling data synchronization and unified management of work orders across multiple systems.
Users can now redirect to the 3rd-party CMMS page from the Source column in Service Request Hub, improving service request handling efficiency.

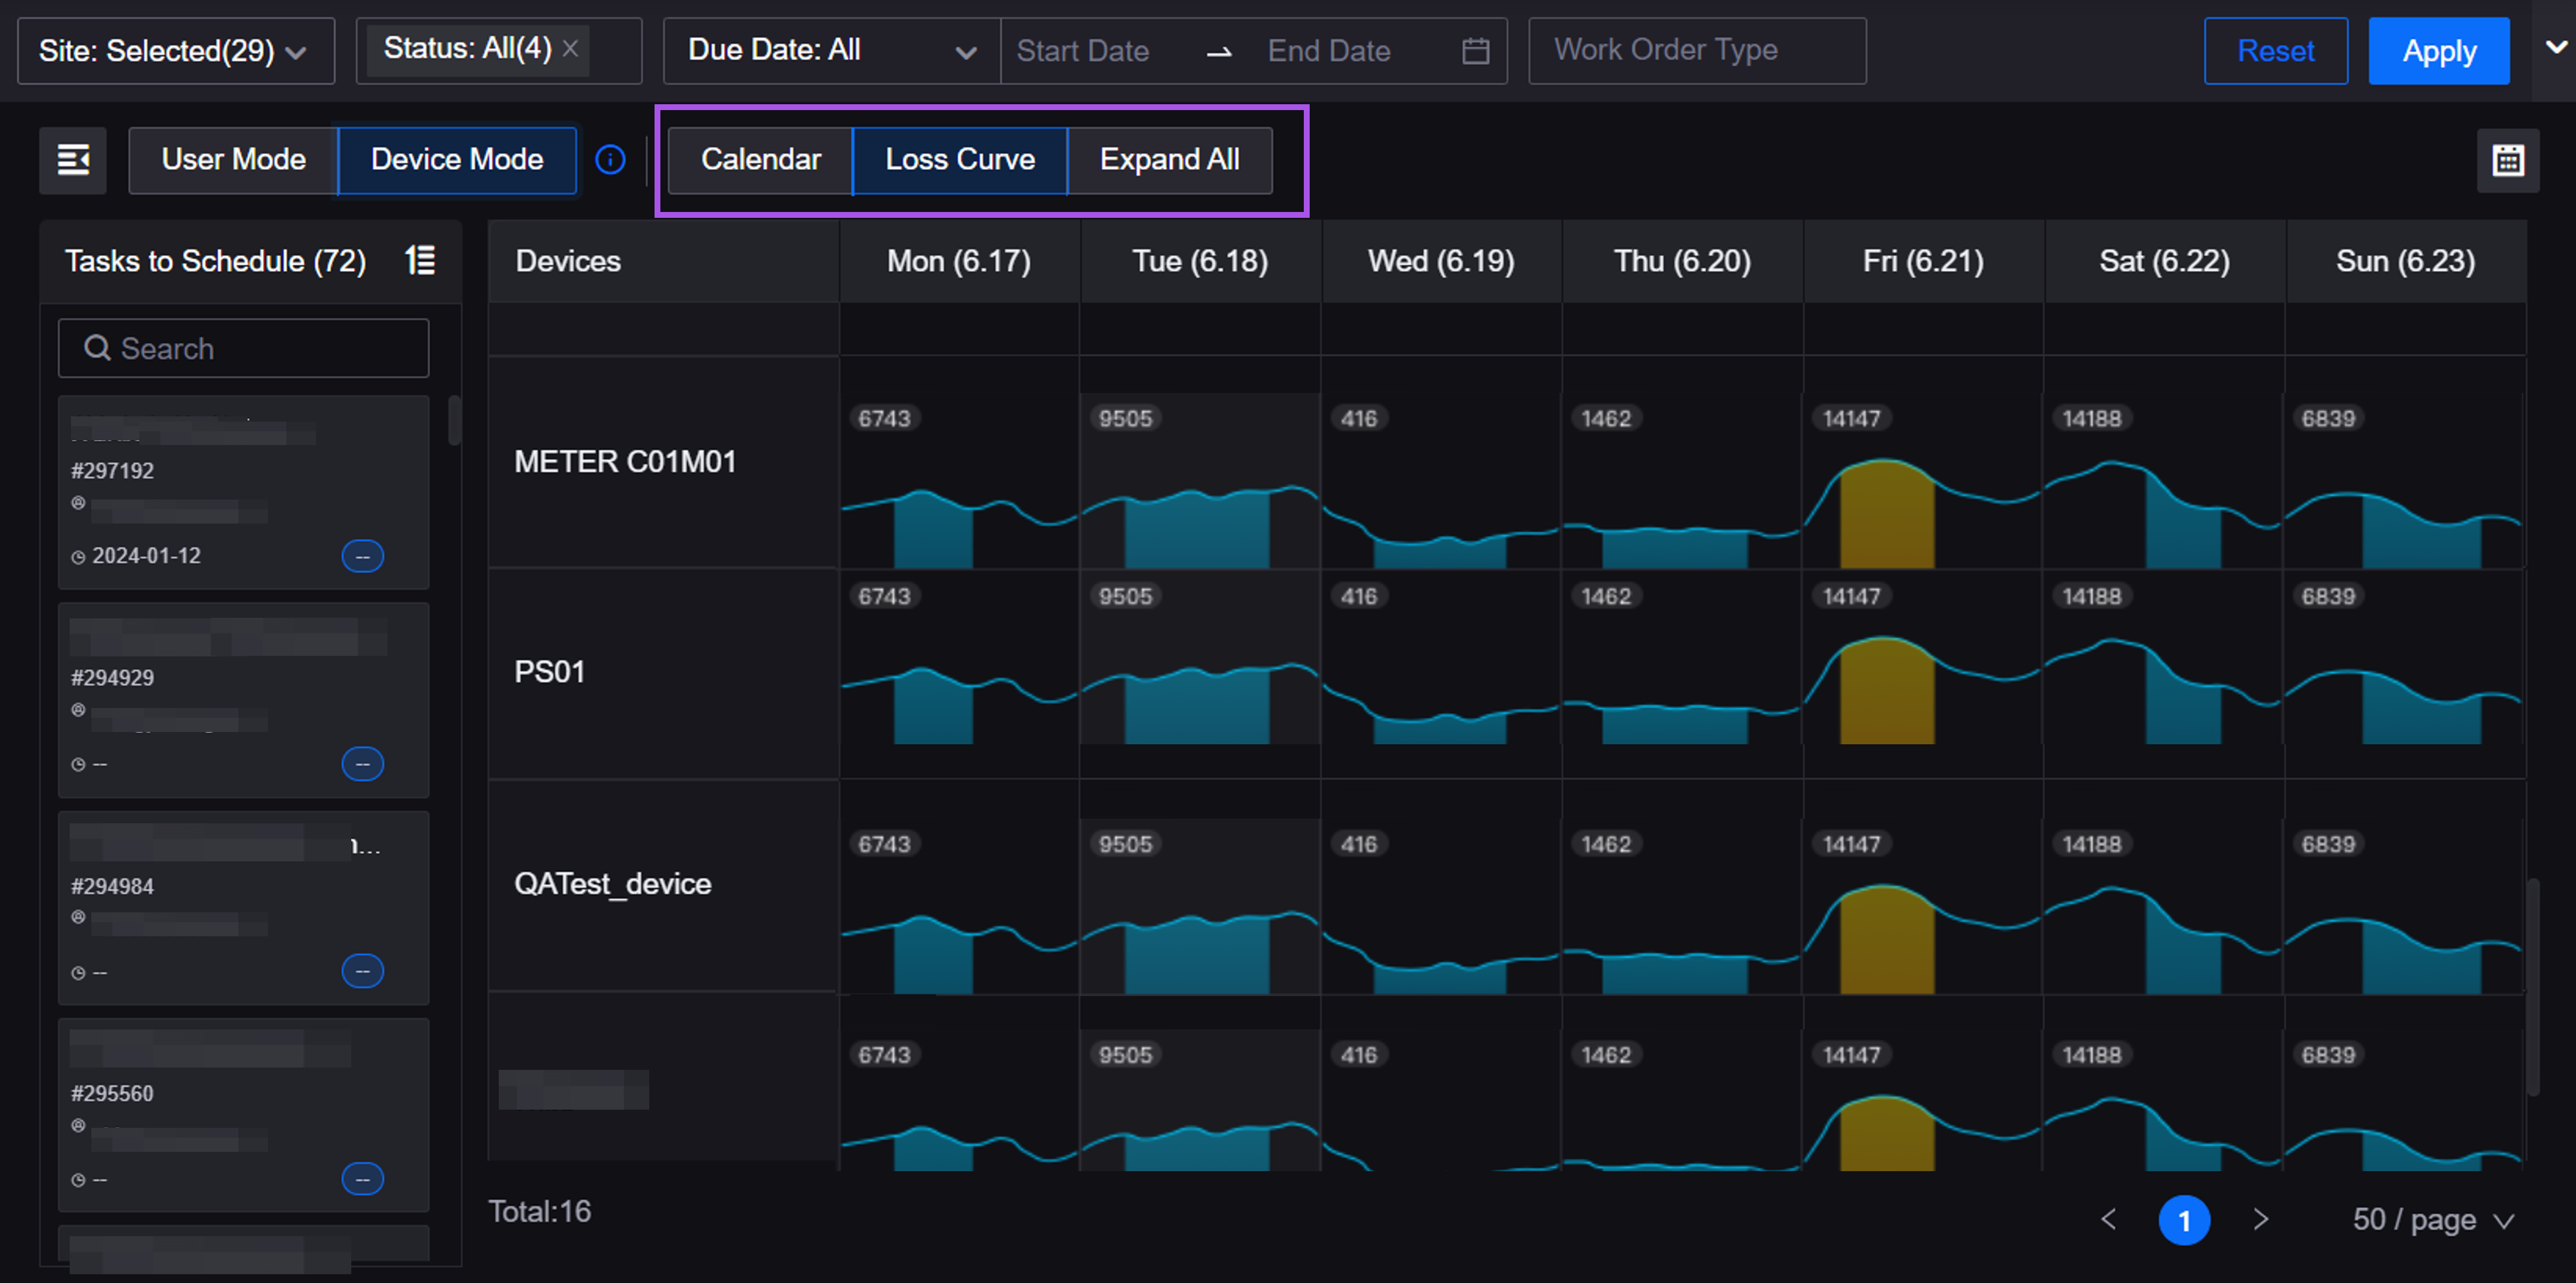
Added the Loss Curve view to Device Mode in Schedule Board to help users find the maintenance window with the lowest loss. Users can now switch between the Calendar view and the Loss Curve view, or choose Expand All for a global overview.
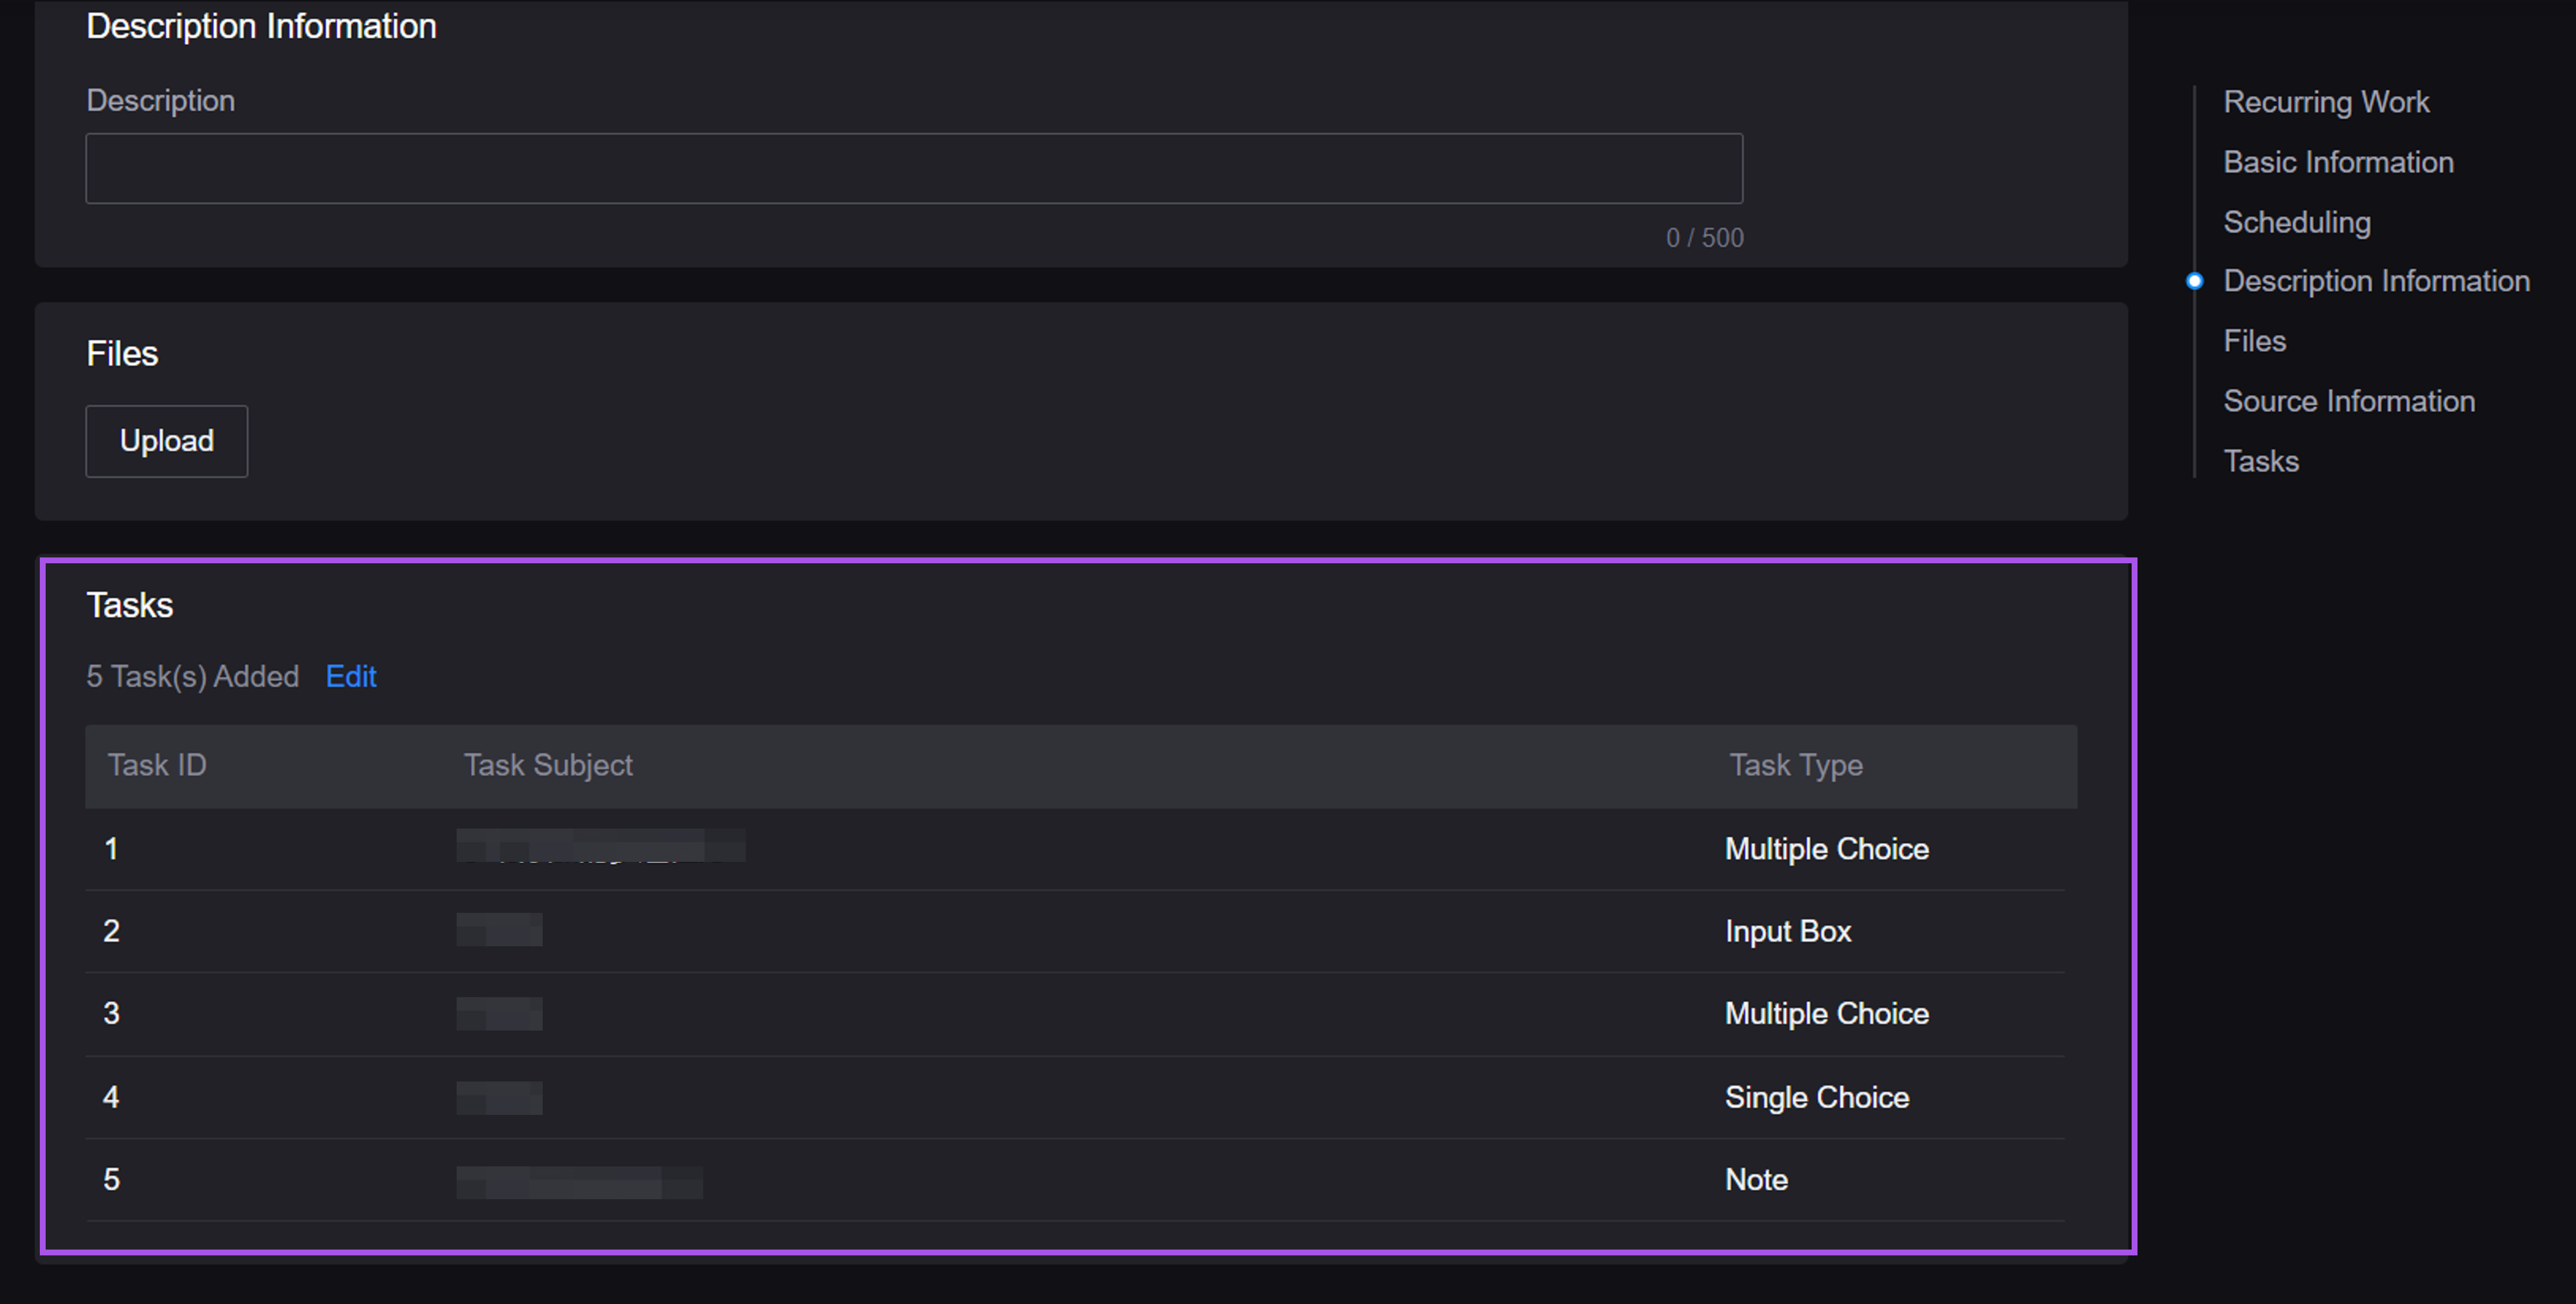
Added the Tasks list in Recurring Works. Users can now create tasks one by one or add tasks in batches from Checklist for the recurring works. Work orders created based on the recurring works will be automatically associated with each task, reducing the manual effort.
Fleet Control
Added the following options in the Rule Type field of Conditional Control. Asset administrators can now choose the effective scope of control conditions based on different scenarios to customize tailored condition control policies:
Single Device Type: configure the control conditions and execution actions that take effect for the selected device type. For example, when water heaters in all sites are in rapid heating mode, the system will set the water heaters to energy saving mode.
Cross Device Type: configure the control conditions and execution actions that take effect between different device types in the same site. For example, set all air conditioners in a store to high airflow mode when PM 2.5 value from all air quality sensors in the store reaches a certain level.
Configuration Center
When exporting a resource package, domain experts can now select all onboarding templates with one click for better efficiency.
Domain experts can now assign permissions of Common Data Service to the role in the solution templates.
Device Connection
Data Quality
Added view tabs in the dashboards, including “Site View”, “Device Type View”, “Device View”, and “Point View”. Users can now switch between these views to explore data quality from multiple perspectives.
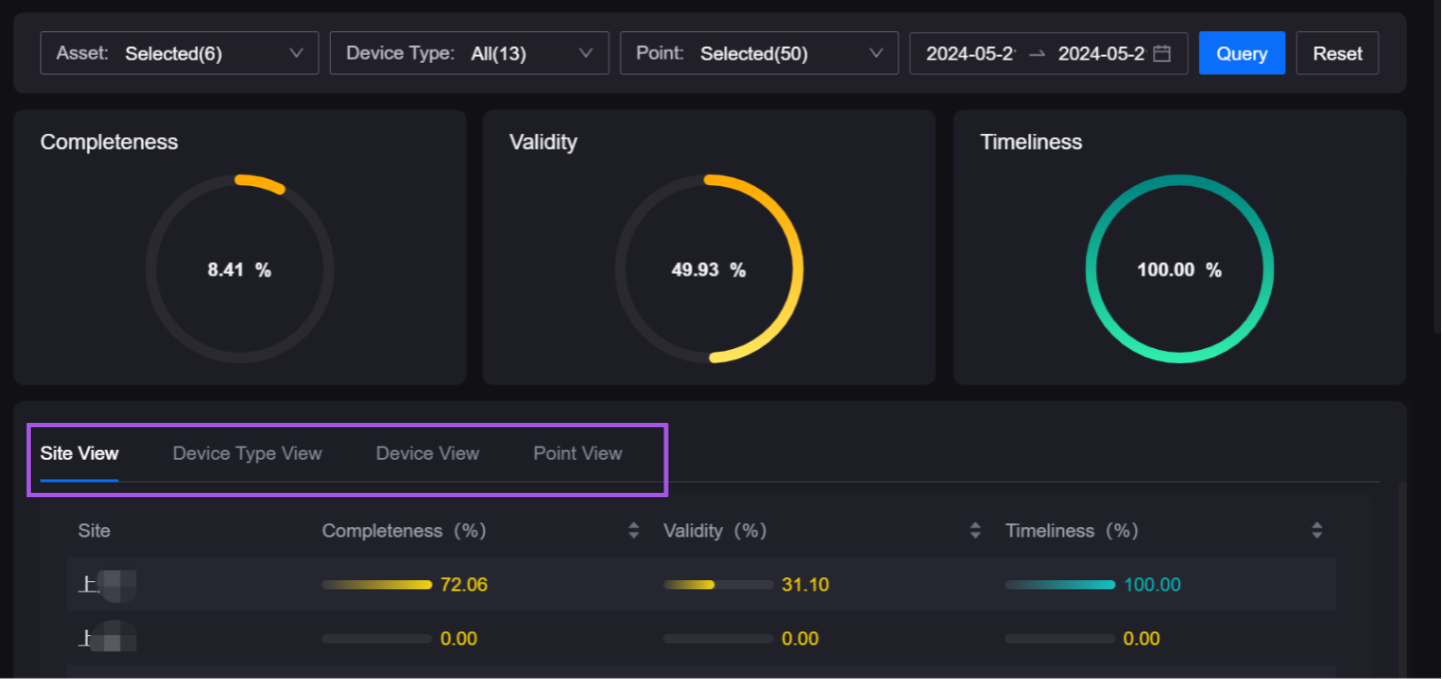
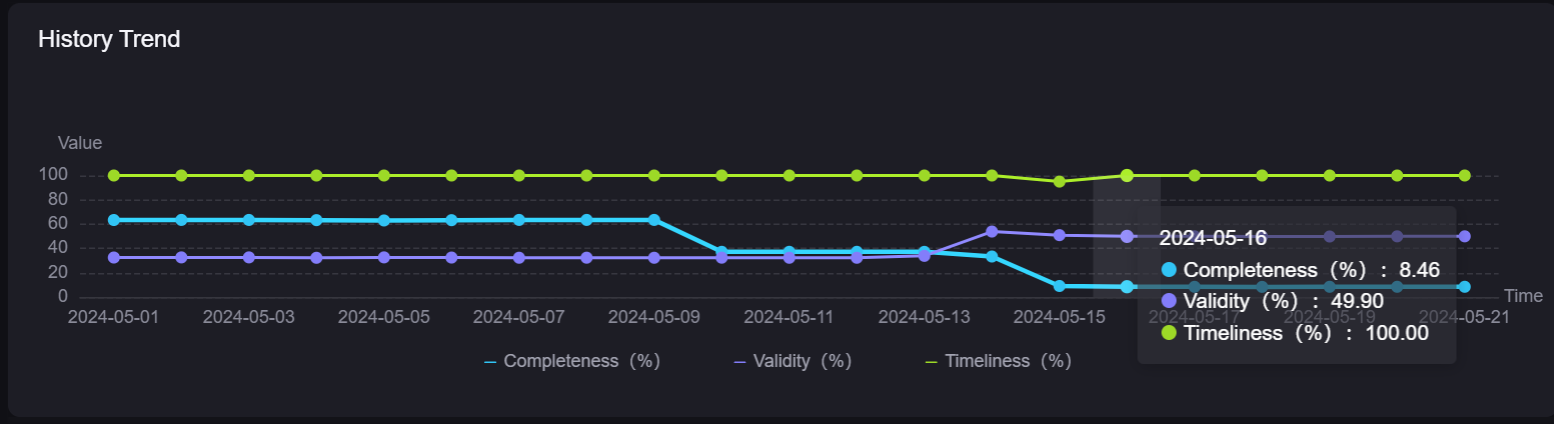
Users can now customize the time period of history trends in the dashboards, gaining insights into the changes of overall data quality during the selected time.
Added the Coverage Rate widget. Users can now view different dimensions of the data quality on the same dashboard.
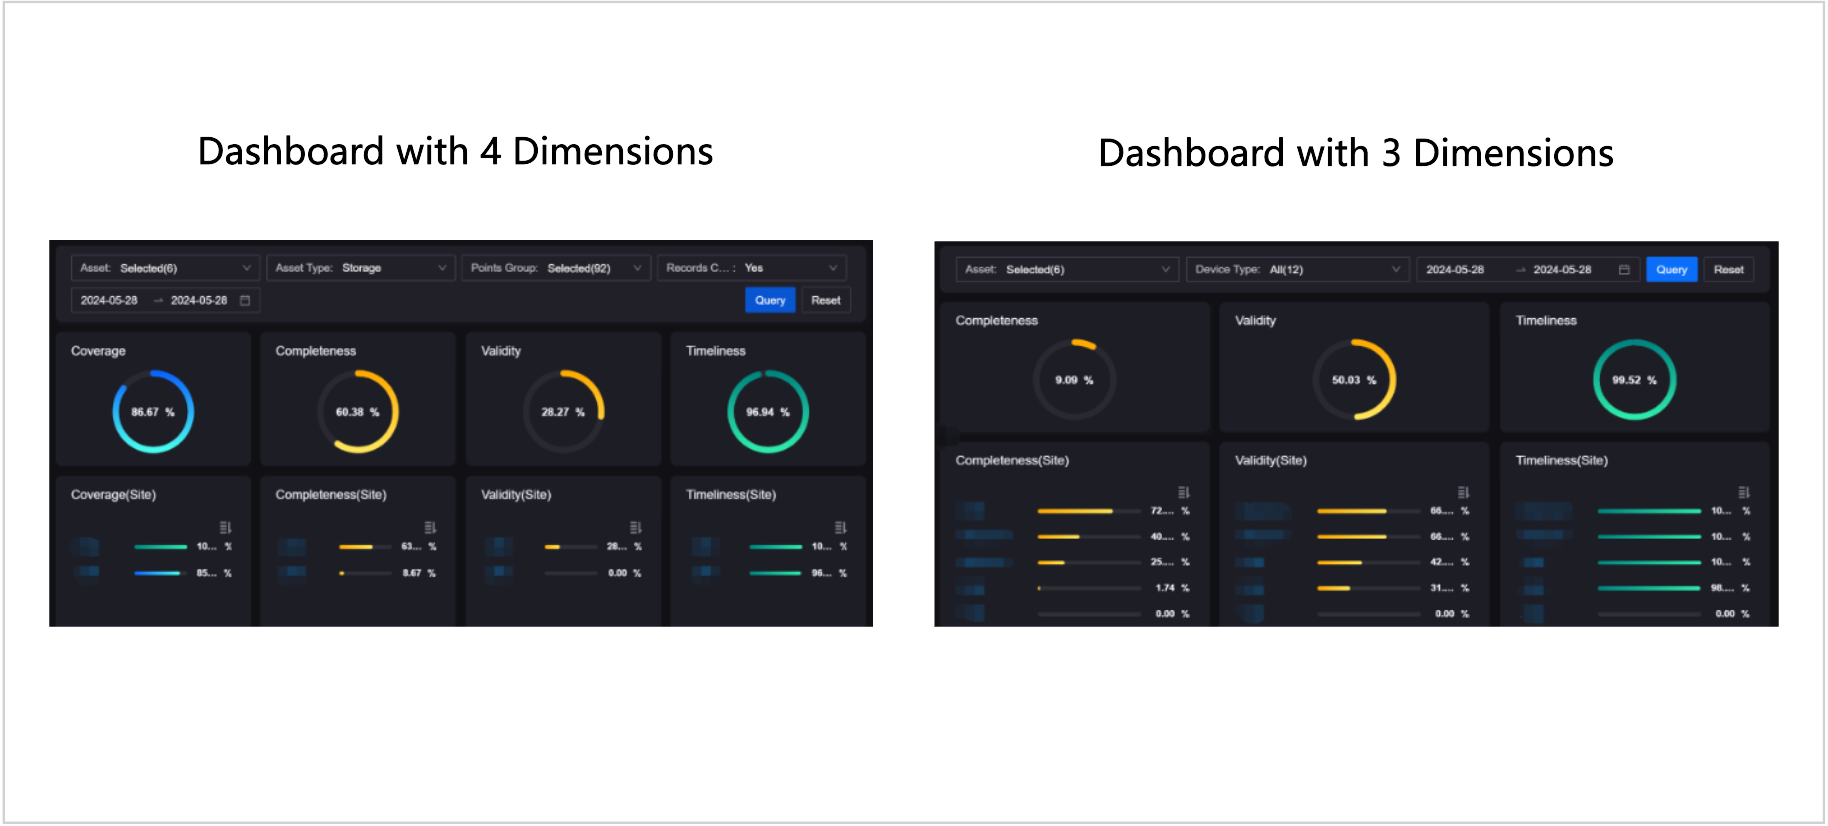
Application creators can flexibly customize the above dashboards using the Digital Twin Visualization (DTV) application.