Viewing Real-time Statistics
You can view the real-time statistics of device behaviors and connections such as device event reporting failures, number of messages sent by and to the platform, etc., displayed via line charts or histograms, and the network status of devices.
Before You Start
You need to be assigned the Device Management Administrator policy. If you are not assigned, contact your OU administrator. For more information about policies in EnOS, see Policies, Roles, and Permissions.
Viewing Device Behaviors and Connections
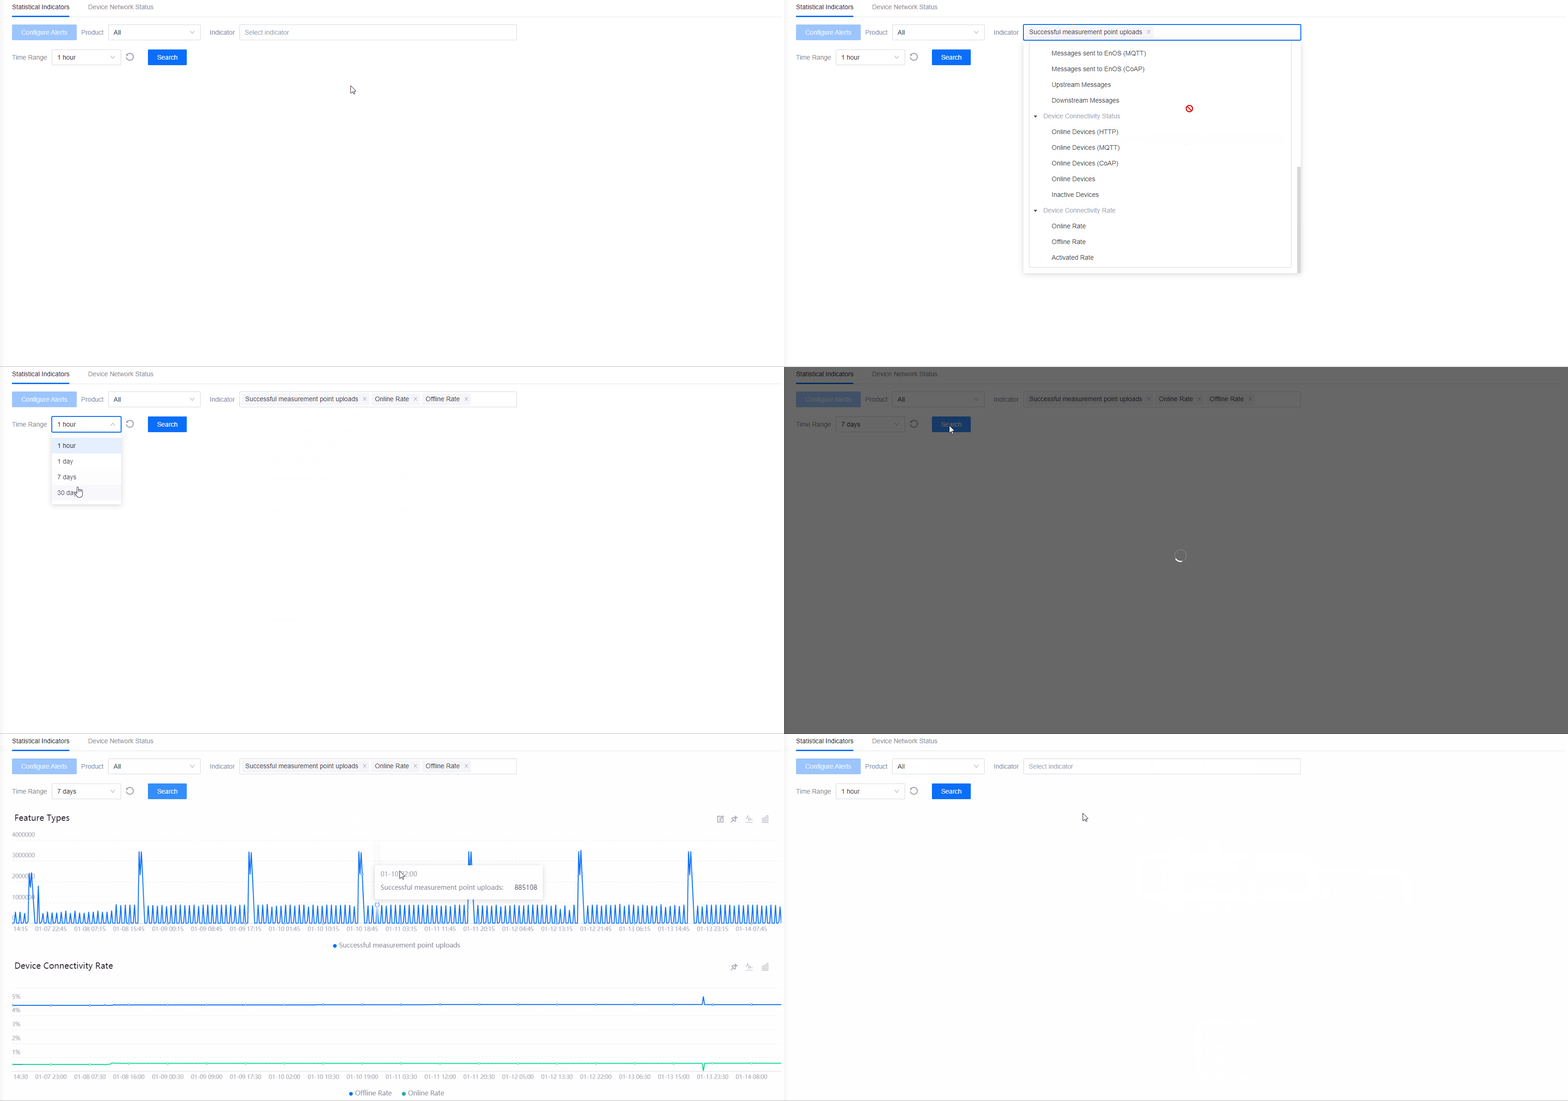
In the EnOS Management Console, go to Device Monitoring > Real-time Statistics > Statistical Indicators.
Select All for all products, or select a product from the drop-down list.
Next, select one or more indicators. The indicators are grouped into 5 different types (graphs) and will be displayed based on the type they belong to. For example, if indicators Successful measurement point uploads from Feature Types and Offline Rate and Online Rate from Device Connectivity Rate are selected, two graphs will be displayed, with Successful measurement point uploads displayed in one graph, and Offline Rate and Online Rate from Device Connectivity Rate displayed in another.
Select a time range. Available options are 1 hour, 1 day, 7 days, and 30 days.
Click Search and the results will be displayed via line graph below.

To view the results via bar graph, click the bar graph icon
 on the right for the respective graph. Click the line graph icon
  to go back to the line graph display.
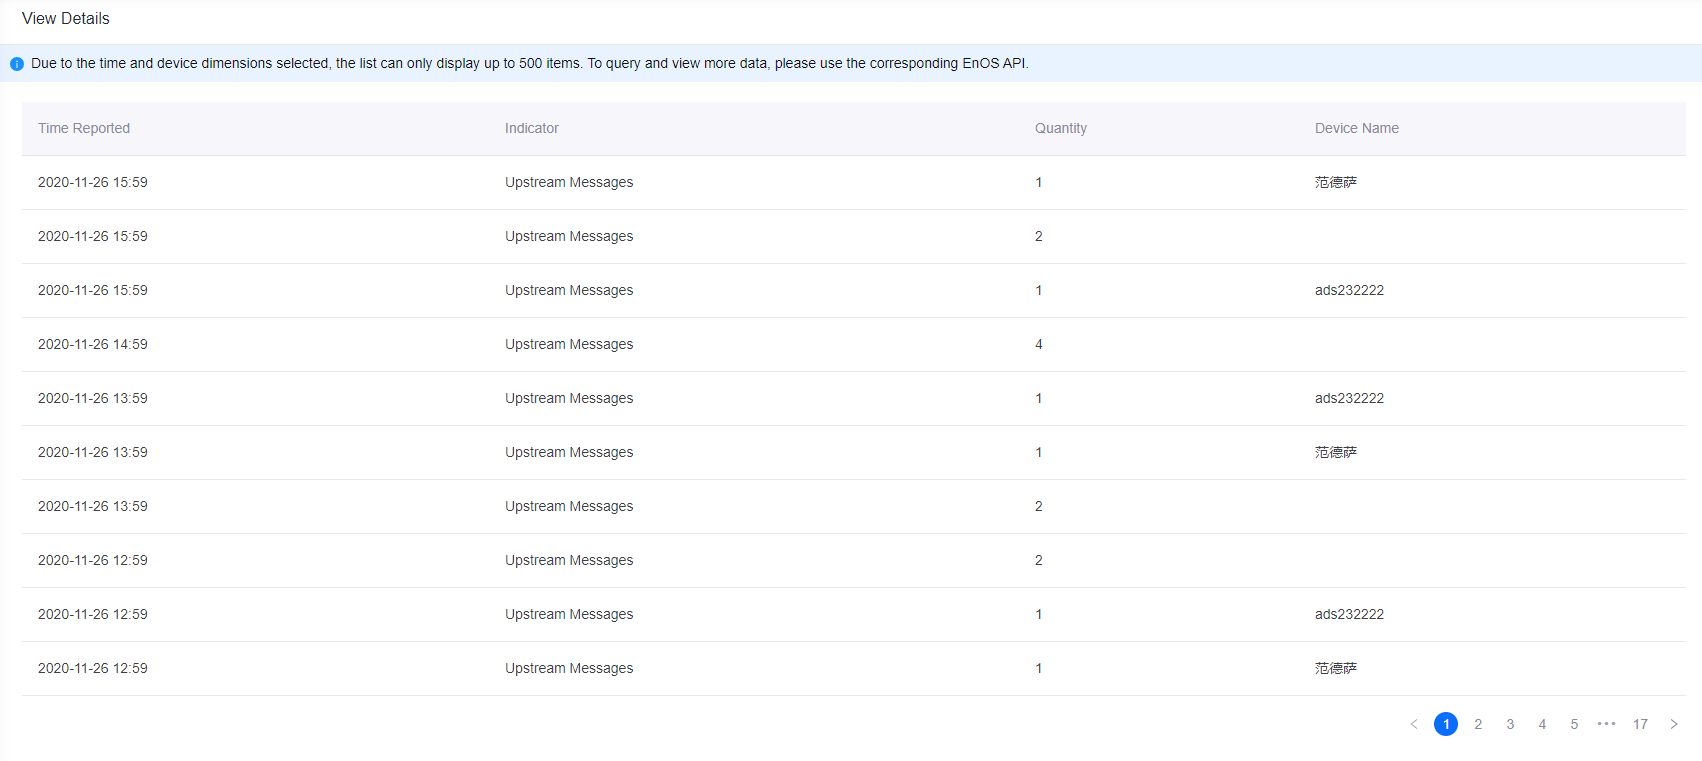
To view the details of the results for each indicator such as the time reported, quantity, and device name, click the View Details icon
 for the graph that the indicator belongs to and select the indicator and time range.
Note
The list can only display up to 500 items.
You can add any of the result graphs to the device monitoring dashboard so that you can go straight to the dashboard to view the graph without having to do a search every time. To pin the graph to the dashboard, click the Pin to Dashboard icon
 . For more information about the dashboard, see Monitoring Dashboard.
You can clear the search results and search fields by clicking the Reset icon
 .
.
Viewing Device Communication Status
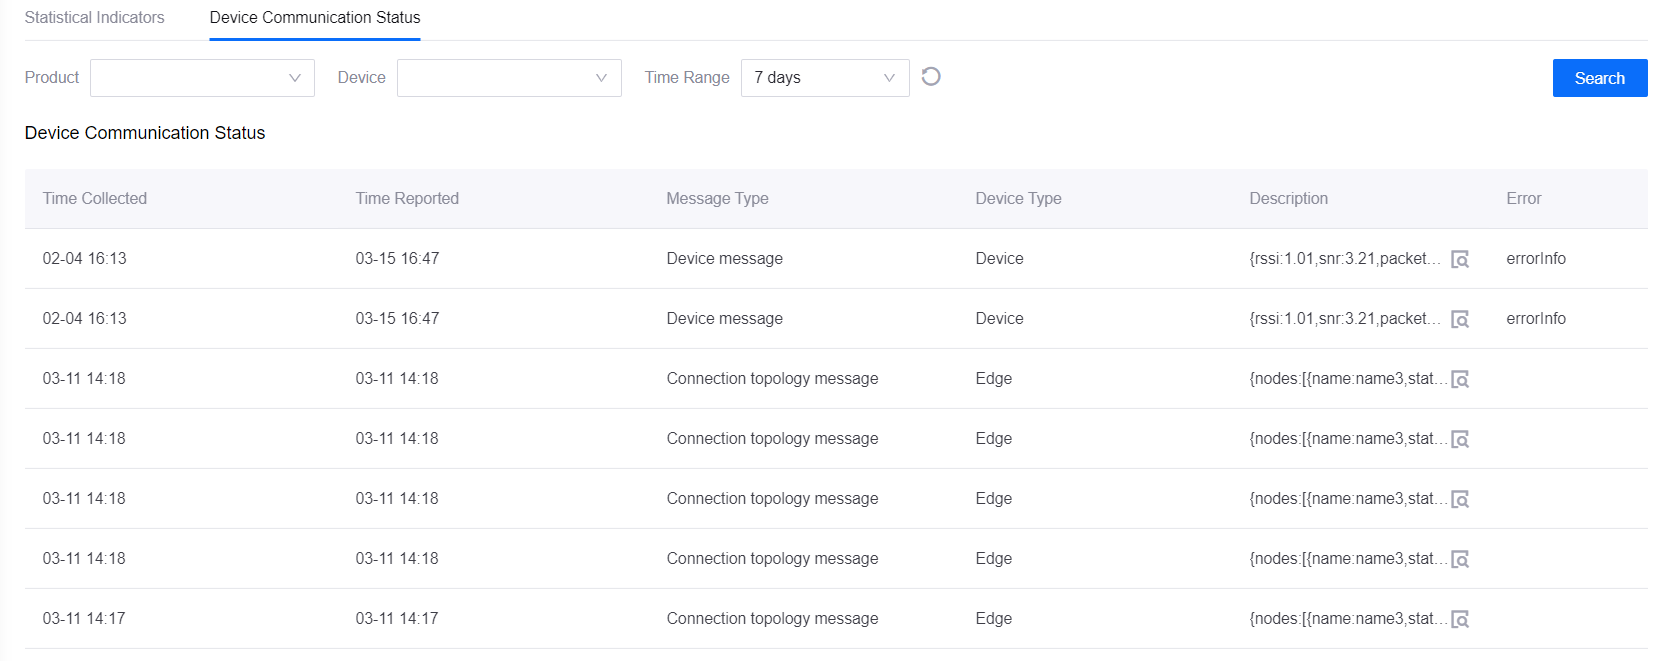
You can view the details of a device’s communication status such as its message type, device type, time reported, etc. for a certain time range.
In the EnOS Management Console, go to Service Monitoring > Real-time Statistics > Device Communication Status.
To view a device’s communication status, first select the product it belongs to, then select the device, and the time range. Available time range options are 1 hour, 1 day, 7 days, and 30 days.
Click Search and the results will be displayed below.

To view an item’s description in its entirety, click its View icon
 .
.
Next Step
You can configure alerts based on the statistical indicators. For more information, see Configuring Indicator Alerts.