Monitoring Dashboard
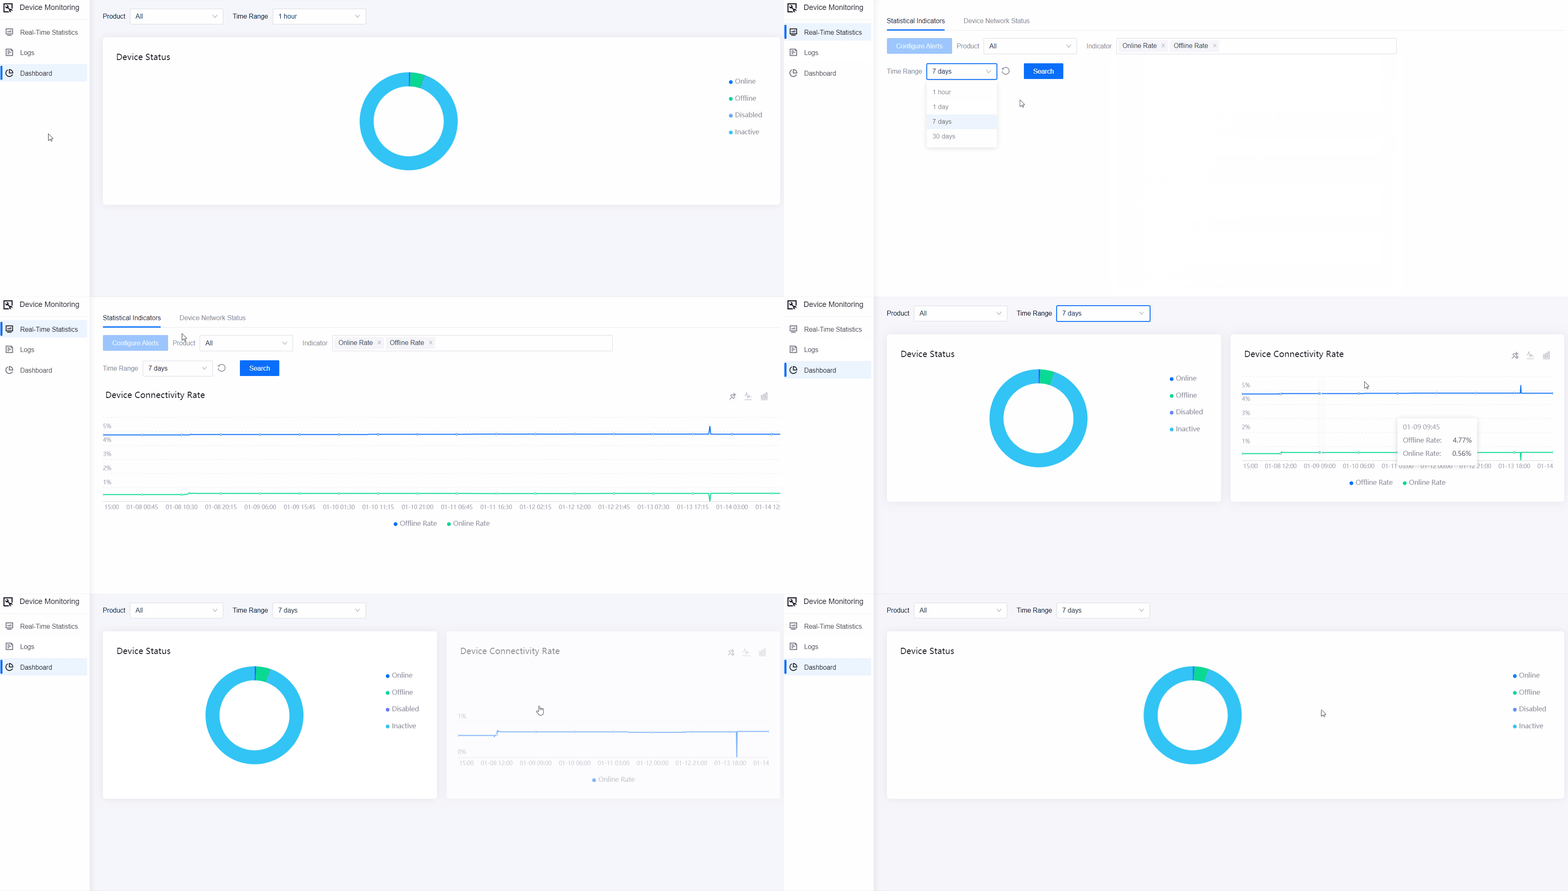
The device monitoring dashboard provides you with an easy to read summary of the device status, behaviours, and connections. You can view the real-time device status of products as well as customize the dashboard by pinning the graph search results from Real-time Statistics.
Before You Start
You need to be assigned the Device Management Administrator policy. If you are not assigned, contact your OU administrator. For more information about policies in EnOS, see Policies, Roles, and Permissions.
Viewing Device Status
In the EnOS Management Console, go to Device Monitoring > Dashboard.
The dashboard displays the device status for all products in the past 1 hour by default. You can select a specific product in the Product drop-down and change the Time Range to view the device status for the past 1 day, 7 days, or 30 days. The results are refreshed every minute.

The types of device status are Online, Offline, Disabled, and Inactive. You can mouseover any of the status to highlight it on the pie chart or click on any of the status to remove it from or add it to the pie chart.

Customizing the Dashboard
You can customize the dashboard and pin the graph search results from Real-Time Statistics. This helps you to save time where you can come straight to the dashboard and monitor without the need to do a search every time.
In the EnOS Management Console, go to Device Monitoring > Real-time Statistics > Statistical Indicators. Follow the steps in Viewing Real-time Statistics to search for the information required.
Click the Pin to Dashboard icon
 for the graph that you wish to add to the dashboard.
Go to Device Monitoring > Dashboard and you will be able to see the pinned graph from Real-time Statistics. The time range for the pinned results is 1 hour by default. Change it by selecting your desired from Time Range.
To remove a graph or an indicator from the dashboard, click the Delete Indicator(s) icon
 and select the indicator to remove.
