Viewing the Connection Topology of Devices
It is common for an organization to have a massive number of Edge devices connected to each other and the cloud, and the connection topology of the devices can often be complex and their connection status hard to track. When connection breaks between Edge devices and the devices connected to them, the O&M personnel need to locate the disconnected device.
The connection topology function in the EnOS Management Console enables Edges to upload the topology structure and connection status of connected devices through MQTT protocol. Edges can detect the subsequent connection status of the devices (broken/connected) and report the status to the cloud where you can search for and view the device details and pinpoint the location of disconnected devices.
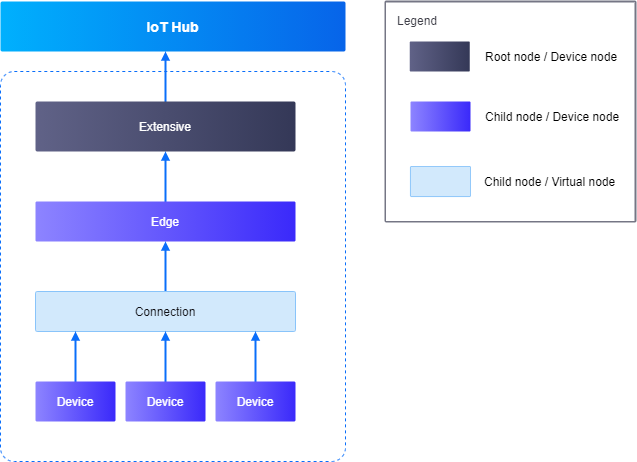
The diagram above shows a connection topology structure with root and child nodes, and device and virtual nodes.
- Connection: Refers to the connection channel. Generally, an Edge can establish multiple connections, and one connection can connect multiple devices at the same time.
- Node: The Edge, sub-devices, connections, etc. in the connection topology.
- Root nodes: Devices that establish the MQTT connection with IoT Hub.
- Child nodes: Non-root nodes.
- Device nodes: Device assets, which are mapped to the device assets in IoT Hub using the device assetIds.
- Virtual nodes: Non-device assets such as the connection channel of a gateway device.
Limitations
- Reported connection information is maintained for 30 days.
Before You Start
You need to be assigned the Device Management Administrator policy. If you are not assigned, contact your OU administrator. For more information about policies in EnOS, see Policies, Roles, and Permissions.
Procedure
The root node needs to connect to IoT Hub via MQTT to report the topology information and connection status (including its own connection channel as well as the connection status of the devices to the channel). For more details, see Establishing Connection with EnOS Cloud using the MQTT Protocol.
Report the connection topology status through MQTT to the cloud. For more details, see Report Connection Topology Status.
In the EnOS Management Console, go to Device Monitoring > Connection Topo. You will see the connection topology interface, which is divided into 4 sections.
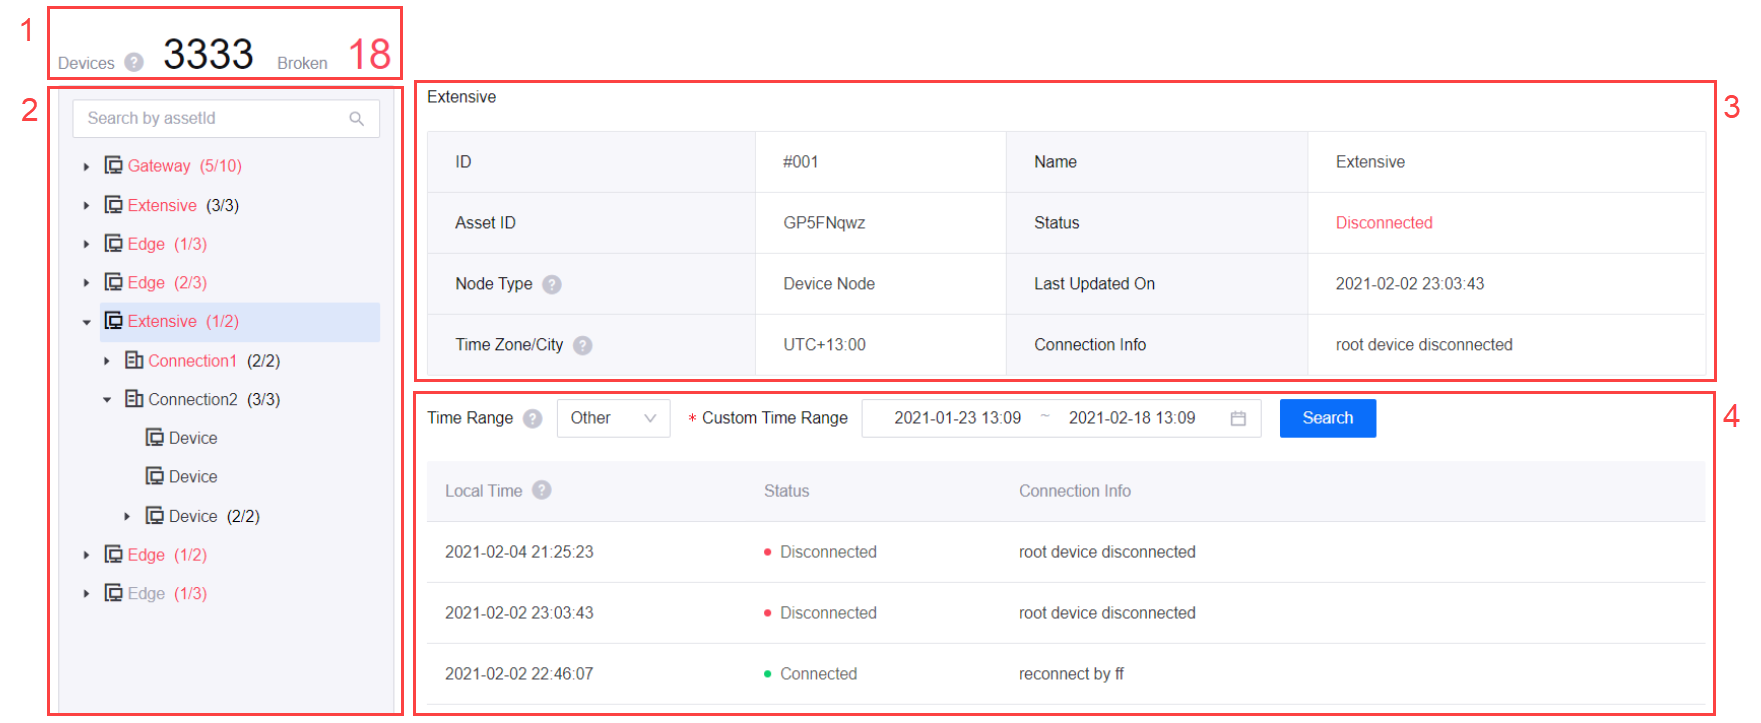
Section 1: Displays a summary of the total number of device nodes and number of disconnected devices in the connection topology.
Section 2: Displays the list of nodes in the connection topology, where you can search for a device node via its assetId. Root nodes have a node summary beside their names that show the number of connected nodes / total number of child nodes.
- Node summary color
- Black: All nodes under them are currently connected.
- Red: There are nodes with a disconnected or unknown status under them.
- Node name color
- Black: The node is currently connected.
- Gray: The node’s connection status is unknown.
- Red: The node is disconnected.
- Node summary color
Section 3: Displays the detailed information of the selected node in Section 2, such as its node ID, asset ID, node type, connection status, etc.
Section 4: You can search for the node’s connection status within 1 hour, 4 hours, 1 day, 7 days, or set a custom time range to search. The search results are displayed according to the device’s local time.