Checking Data Quality Reports
The Report page allows you to view data quality reports at different granularities and export reports.
Prerequisites
Before starting, make sure the user account has been assigned the required asset permissions and a menu group including Report. If not assigned, contact the application administrator.
Procedure
Select Assessment > Report from the left navigation pane to go to the Report page.
You can quickly filter target data based on the following filters.
Filter
Description
Note
Device Type
Select a device type that needs to be viewed in the device type drop-down list.
If the device type you want to select is not in the drop-down list, contact the asset administrator.
Aggregate Dimension
In the aggregation dimension drop-down list, you can choose to view data quality by the aggregate granularity of
Region,Region - Site, orRegion - Site - Device.The finer the granularity, the more information displayed in the quality report details.
Sensor point
Select the groups and sensor points under the current device type in the sensor point drop-down list.
The sensor point is the monitoring object.
The parent level of the sensor point group can be expanded. If the parent level is checked, all sensor points under the parent level are automatically selected.
Contact the asset administrator to configure groups and sensor points.Time
You can quickly select the
Current Week,Current Month, orCurrent Yearin the time drop-down list.
If you selectCustom, you will need to further select Start Date and End Date.Up to 31 days of data quality can be selected and viewed within the range of the previous year.
If you selectCurrent Weekon Monday orCurrent Monthon the 1st, the start and end time will both be the current day, and the query result will be blank.Date
In the drop-down list, you can quickly choose display data quality reports by
DayorAggregate.Day: Displays data quality of each day in the selected time range.
Aggregate: Displays the aggregated results of data quality for the selected time range.Select Query at the top right of the page to view data quality reports under the current aggregated dimension:
Aggregation by
Region: You can view the completeness rate, validity rate, and timeliness rate of the data of the current region.Aggregation by
Region - Site: You can view the completeness rate, validity rate, and timeliness rate of the data of the current site.Aggregation by
Region - Site - Device: You can view the completeness rate, validity rate, and timeliness rate of the data of the current device.
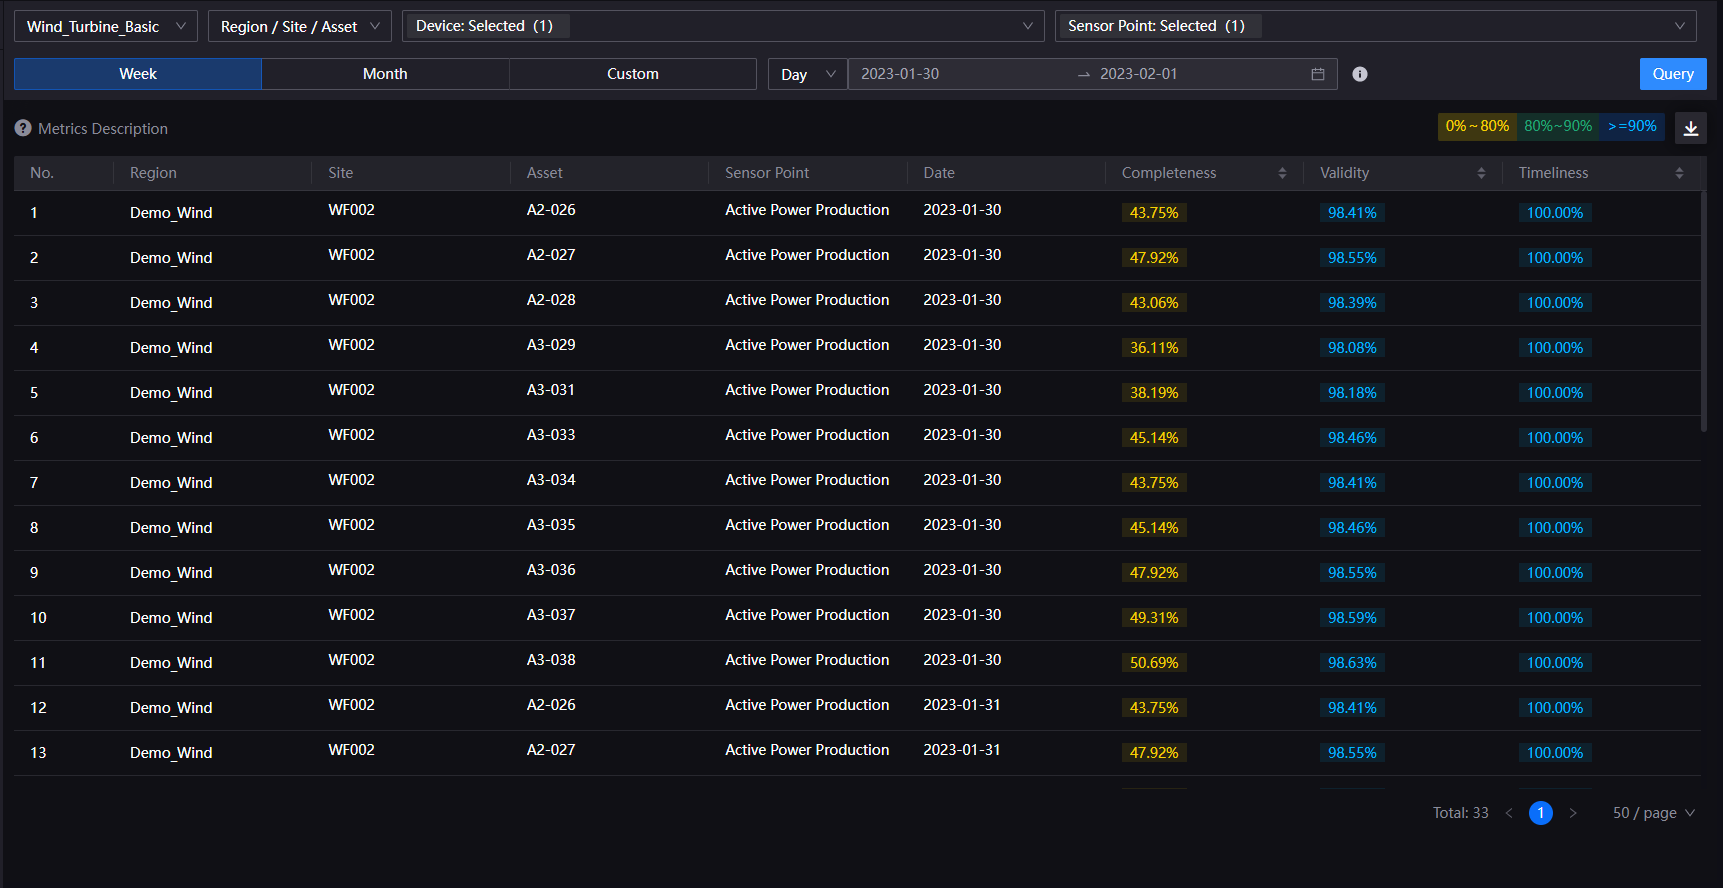
To learn more about the concepts and calculation of completeness, validity, and timeliness, see Quality Dimensions and Data Quality Metrics.
To download the current data quality report for further data analysis and processing, select Download
 at the top right of the page.