Maintaining Stream Processing Jobs
After a stream processing job is published online, you can manage the job through various operations on the Stream Operation page, such as configuring running resources, setting alarms, starting a job, pausing and stopping a running job, and checking the running status of a job.
Configuring Running Resources
You can run the job either by the standalone or cluster mode. Each mode requires a different processing resource. Before configuring running resources for a stream processing job, ensure that your OU has requested for the required stream processing resource through EnOS Console Management > Resource Management.
Standalone mode: You need to request for the Standalone Processing resource.
Cluster mode: You need to request for the Cluster Processing resource.
For the steps on how to request resources, see Managing Resources.
Follow the steps below to configure the running mode of the stream processing job and the required resources.
Open the Stream Operation page and find the published stream processing job under the User Pipeline tab. The status of the newly published job is PUBLISHED by default.
Select … > Configure Resource of the job and configure the running resources that are required by the stream processing job.
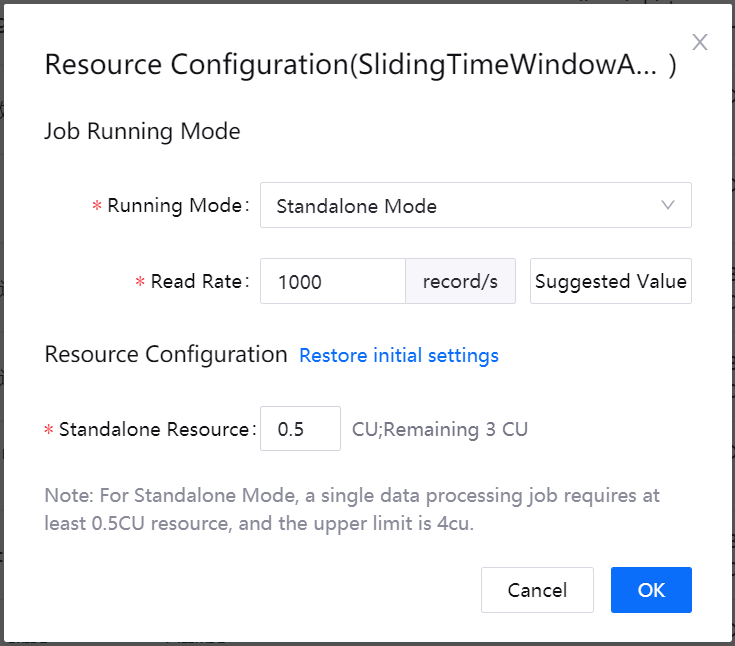
If you want to run the job by standalone mode, select Standalone Mode from the Running Mode drop down list, enter the data read rate, and enter the number of CUs that are required for running the job.
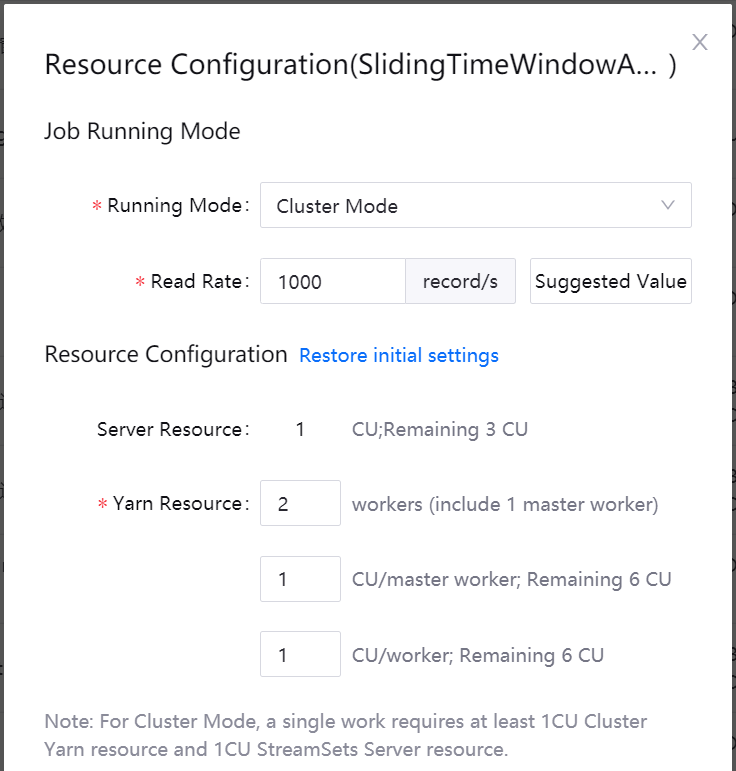
If you want to run the job by cluster mode, select Cluster Mode from the Running Mode drop down list, enter the data read rate, and configure the Yarn resources that are required for running the job.
If you want to configure advanced parameters for running the job by the cluster mode, click Add Parameter and enter the parameter key and value. For description of parameters than can be configured, see Advanced Parameters.

Click OK to complete the running resource configuration.
Advanced Parameters
The table below lists the advanced parameters that can be set for cluster mode.
Parameter Name |
Description |
|---|---|
spark.streaming.backpressure.enabled |
Enables or disables Spark Streaming’s internal backpressure mechanism. This enables the Spark Streaming to control the receiving rate of data records based on the current batch scheduling delays and processing times so that the system receives only as fast as the system can process. Internally, this dynamically sets the maximum receiving rate of receivers. This rate is upper bounded by the values of |
spark.yarn.driver.memoryOverhead |
The amount of off-heap memory (in megabytes) to be allocated per driver in cluster mode. This is memory that accounts for things like VM overheads, interned strings, other native overheads, etc. This tends to grow with the executor size (typically 6-10%). |
spark.yarn.executor.memoryOverhead |
The amount of off-heap memory (in megabytes) to be allocated per executor. This is memory that accounts for things like VM overheads, interned strings, other native overheads, etc. This tends to grow with the executor size (typically 6-10%). |
spark.memory.fraction |
Fraction of (heap space - 300MB) used for execution and storage. The lower this is, the more frequently spills and cached data eviction occur. The purpose of configuring this parameter is to set aside memory for internal metadata, user data structures, and imprecise size estimation in the case of sparse, unusually large records. Leaving this parameter at the default value (0.6) is recommended. |
spark.memory.storageFraction |
Amount of storage memory immune to eviction, expressed as a fraction of the size of the region set aside by |
Setting Alarm
The Stream Operation supports the setting of alarms based on the stream processing job’s running status and Kafka lags. Alarms can be sent to job owners through email or SMS when exceptions occur.
Follow the steps below to set the alarms for the stream processing job.
From the operation column of the job list, select … > Set Alarm, and complete the alarm settings in the pop-up window.
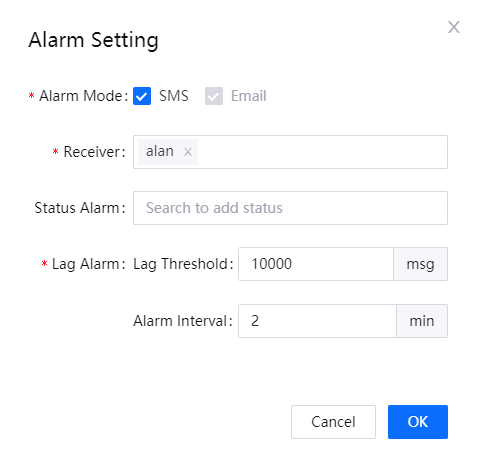
Select the alarm mode, alarm receivers, job status that triggers the alarm, and the Kafka lag threshold that triggers the lag alarm. Then, click OK to save the configuration.
Starting the Job
Before starting the stream processing job, make sure that the corresponding system pipelines are started and running. The real-time and offline message channels have 2 system pipelines (data writer and data reader) separately.
Follow the steps below to start the stream processing job.
Open the Stream Operation page, and check the status of the system pipelines under the System Pipeline tab.
In the list of system pipelines, click the Start icon
 to start the required system pipeline. After that, you can start your stream processing job.
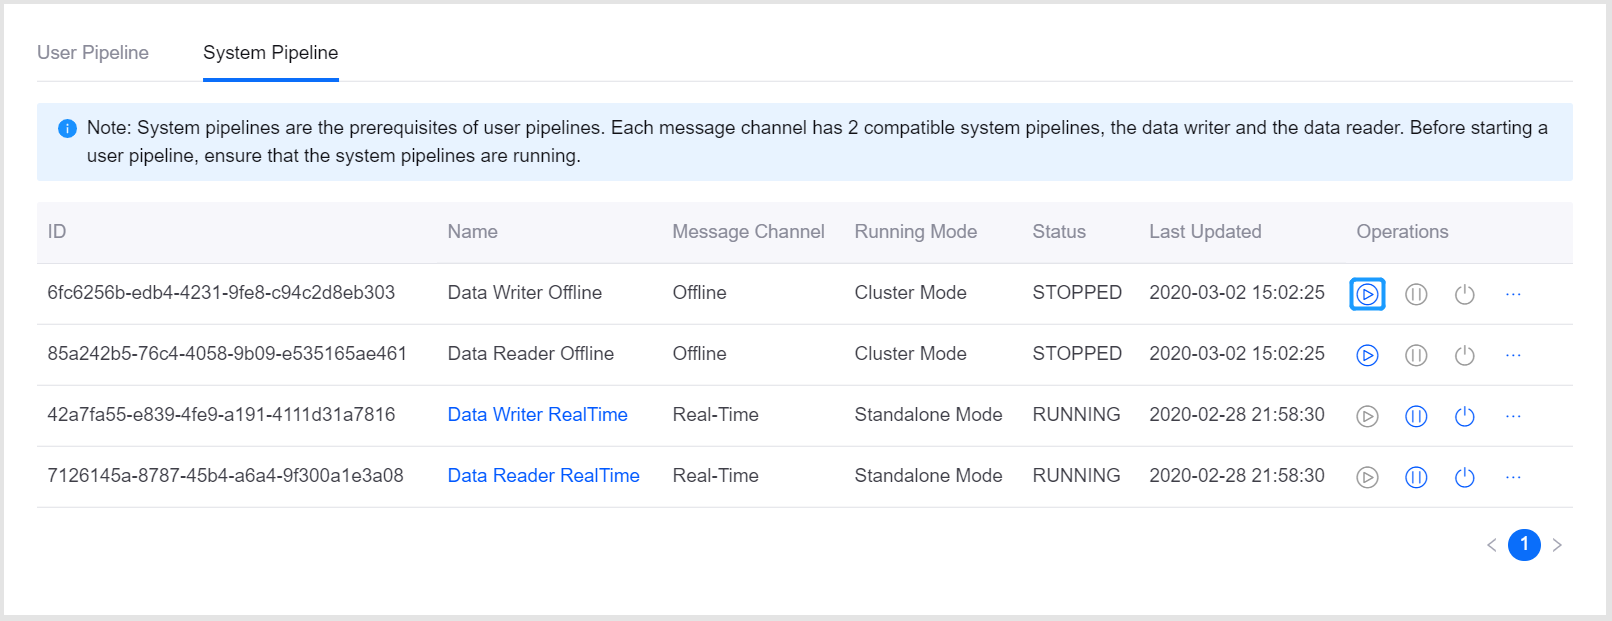
Operating and Maintaining the Job
On the Stream Operation page, you can perform the following actions for the stream processing jobs.
Start a job: Click the Start icon
to start a job. The job will then run continuously in the streaming system.Pause a job: Click the Pause icon
 to pause a running job. The cached data will be stored temporarily and will resume running from the pause point when the job is restarted. Note that the job cannot be paused for more than 24 hours.
Stop a job: Click the Stop icon
 to stop a running job. After the job is stopped, the cached data and the data consumption offset information of the job will be cleared. When restarted, job will resume running from the point when the job was stopped. The computed data before the job was stopped will not be not stored.
View configuration: Click … > View to view the stream processing configuration details of the job.
Export configuration: Click … > Export to download the stream processing configuration file of the job.
Monitoring the Job Running Status
You can monitor the real-time running status of the steam processing job with the following steps.
On the Stream Operation page, locate the running stream processing job in the list of stream processing jobs.
Select … > Monitor to view the running status of the job in the pop-up window.
Producer Rates: The data producing speed of Kafka.
Consumer Rates: The data consuming speed of the job.
If the data consuming speed of the job is slow, you can add running resources for the job to improve the job running efficiency.
Viewing the Job Running Results
On the Stream Operation page, locate the running stream processing job in the list of stream processing jobs.
Click the name of a running job to view the job running results.
Summary: View the summary of the job running results, such as the statistics of processed data records.
Log: Click the View Logs icon in the upper right corner to view the job running logs.