Viewing the Data Quality Report
Tagging quality information to data enables you to query its quality report. The data quality reports provide data quality information in 3 dimensions - completeness, accuracy, and timeliness - helping you to quickly understand the data quality of your assets.
Prerequisites
TSDB storage policies have been configured for the device measurement point data.
The device measurement point data has been quality tagged with the Streamsets quality rule stages.
Setting Query Conditions for Quality Report
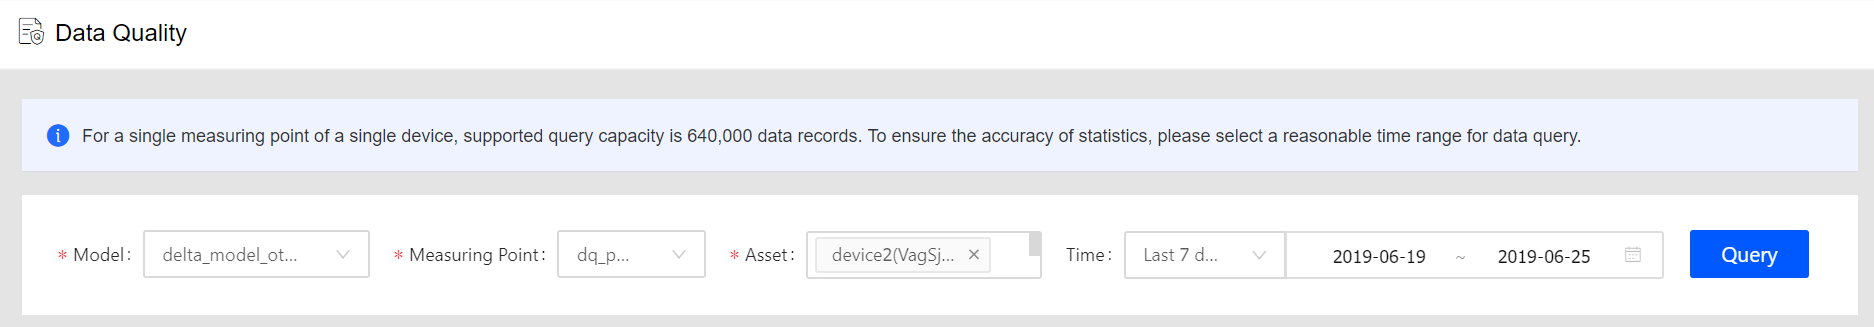
After logging in to the EnOS Management Console, select Data Quality from the left navigation panel, fill in the information for the following, and click the Query button.
Model: Select the model to be queried. All public and private models under the current organization is listed in the drop-down list.
Measuring Point: Select the measurement point to be queried under the selected model. Currently only supports the querying of the daily quality report for a single measurement point.
Asset: Select one or multiple assets (under the same model).
Time: Select or customize a time period (days) to query the quality report. To avoid large amounts of queried data, the current query limit is: number of assets * days ≤ 600.
Viewing the Data Quality Report
After the data quality report is generated, you can view the data quality details for the following dimensions.
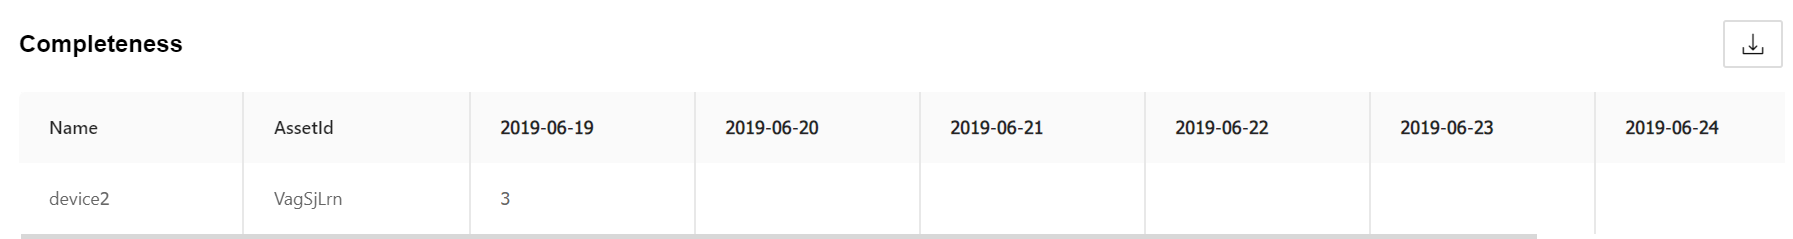
Completeness
View the completeness of the measurement point data by day. Currently, only the number of measurement points reached each day (determined by the number of data points stored in TSDB) is counted.
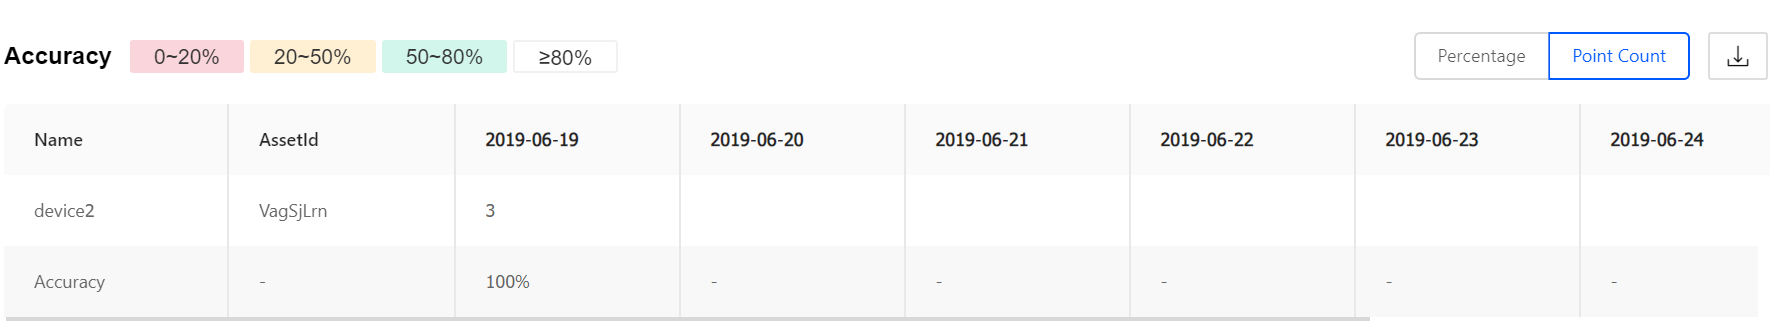
Accuracy
View the accuracy of the measurement point data by day. Accuracy = Accurate points / Total points.
Accuracy of data is determined by whether the measurement point value exceeds the specified threshold range. If the value exceeds the upper limit, the data will have the over-upper-limit tag. If the value exceeds the lower limit, the data will have the over-lower-limit tag. Data with these two tags will be deemed as inaccurate.
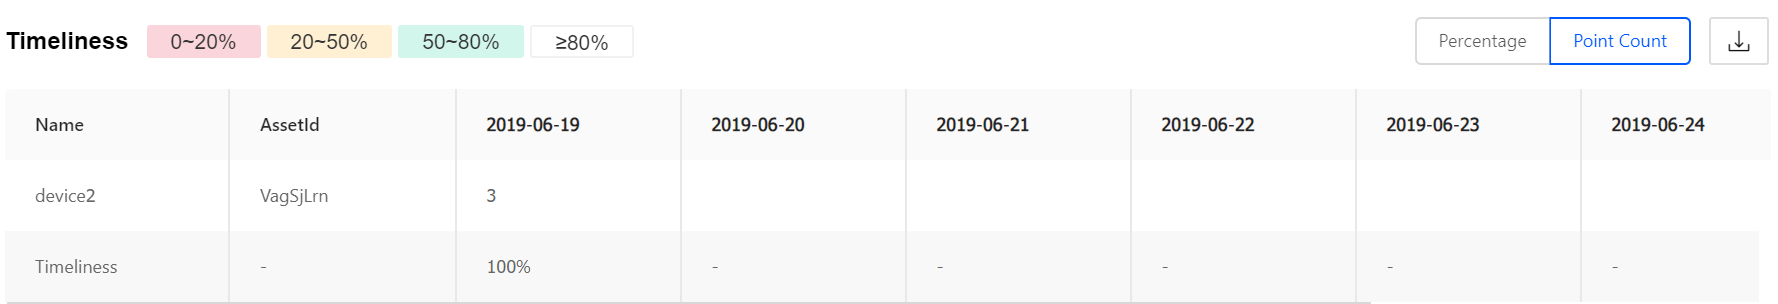
Timeliness
View the timeliness of the measurement point data by day. Timeliness = Timely points / Total points.
Timeliness of data is determined by comparing the timestamp of each uploaded data point with the timestamp of the latest data of the measurement point. If the timestamp of the uploaded data is later than the timestamp of the latest data, the data will be tagged as late. If it is earlier than the timestamp of the latest data, the uploaded data will not be tagged as late, and the timestamp of the latest data is replaced with that of the current data.
Color marking for abnormal quality
Different levels of data quality are tagged with different colors in the data quality report to facilitate rapid identification of abnormal data:
0 -20%: red
20 -50%: orange
50 - 80%: blue
≥80%: transparent
Toggling between point count/percentage
Click Point Count or Percentage to toggle how the data quality report data is presented.
Downloading quality report
Click the Download icon ![]() to download and save the data quality report.
to download and save the data quality report.