Enabling Event Monitoring
Using the event monitoring function, you can quickly access the event monitoring metrics generated by the application to the platform and generate a monitoring dashboard. Users can then create alerts based on metrics through the common alerting service capability.
Prerequisites
Created and deployed applications.
Procedures
Turn on the event monitoring service by following these steps:
From the left navigation bar, select Monitor > Event Monitoring Dashboard.
In Event Monitoring Dashboard page, select the corresponding Application, Environment, Cluster and Time Range.
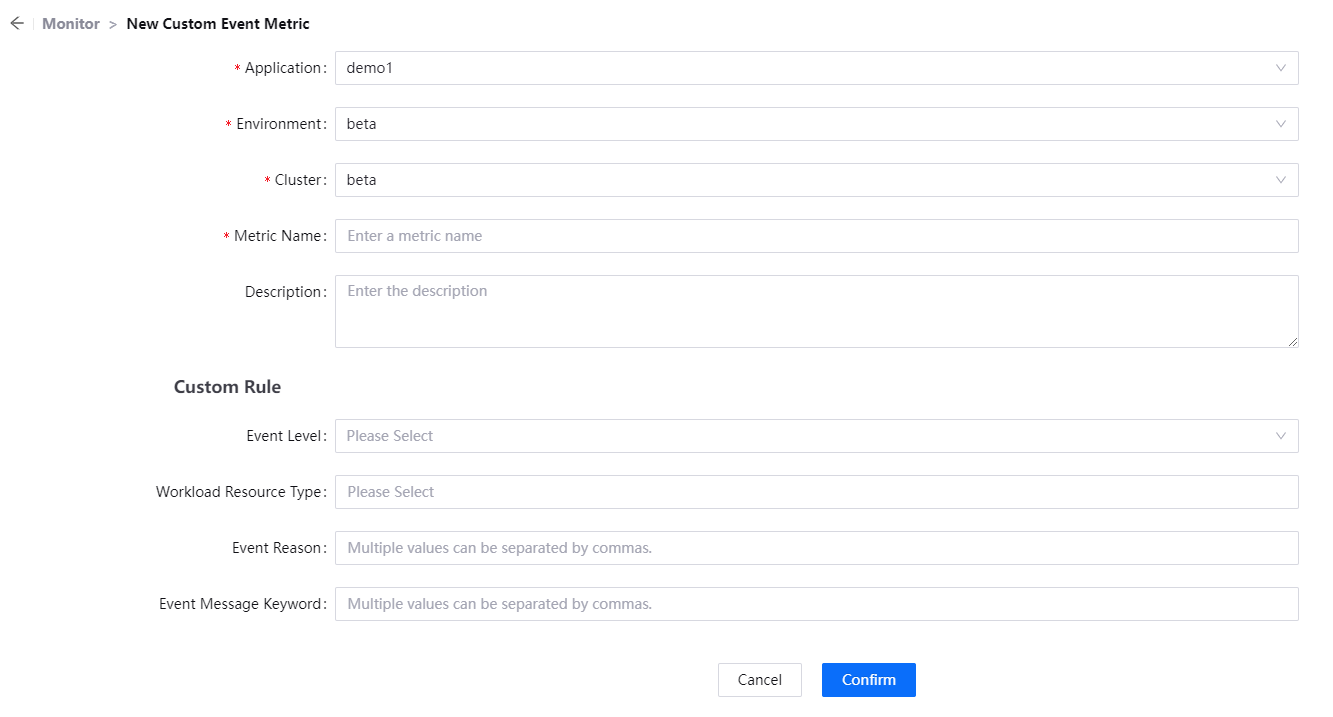
To configure event metrics, click New Custom Metric to create a custom event metric.
Application:Select the application for which you need to create event metrics.
Environment:Select the environment where the application is located.
Cluster:Select the cluster where the application is located.
Metric Name:Enter the name of the custom event metric.
Event Level:Select the level of this event metric.
Workload Resource Type:Select the resource to which the event metric corresponds.
Event Reason:Enter the reason for the event.
Event Message Keyword:Enter the event message keyword.

Click Confirm to create a custom event metric configuration and view the monitoring information on the Event Monitoring Dashboard page.
Next Steps
Users can create alert rules based on event metrics and receive alert events, the following are the event metrics that support setting alert rules:
K8s Common Warning Event:A Warning type event has occurred for the applied K8s resource.
Pod Restart:Pod startup failure event.
Pod Start Failed:Pod creation failure event.
Pod Create Failed:Number of Pod reboots.
Image Pull Failed:Image pull failure event.
Custom Event Metrics:Customize event metrics.
For more information on how to create alert rules, see Configuring alert rules.