Viewing Logs
Logs play an important part in device monitoring. Reviewing logs regularly can help to identify and analyze issues early and ensure that things can run smoothly.
Device logs in EnOS are categorized into the following types:
Cloud Operation Logs: Include uplink and downlink messages. Uplink message logs are messages sent from the device to the cloud, such as device startup, data reporting, file uploads, and command execution status callbacks. Downlink message logs are primarily messages sent from the cloud to the device, such as firmware upgrades and command issuance.
Device Local Logs: Include information related to the device’s operational status and processing logic. Note: The device must support log reporting for these logs to be viewable.
Device Communication Status: Includes status information related to communication between the device and the cloud, such as message type, device type, collection time, and reporting time.
This section shows how you can view logs of all devices under a product for the above two categories.
Prerequisites
Ensure that you have obtained the Developer role to have the access to Application Portal > Developer Console. If not, contact your OU administrator.
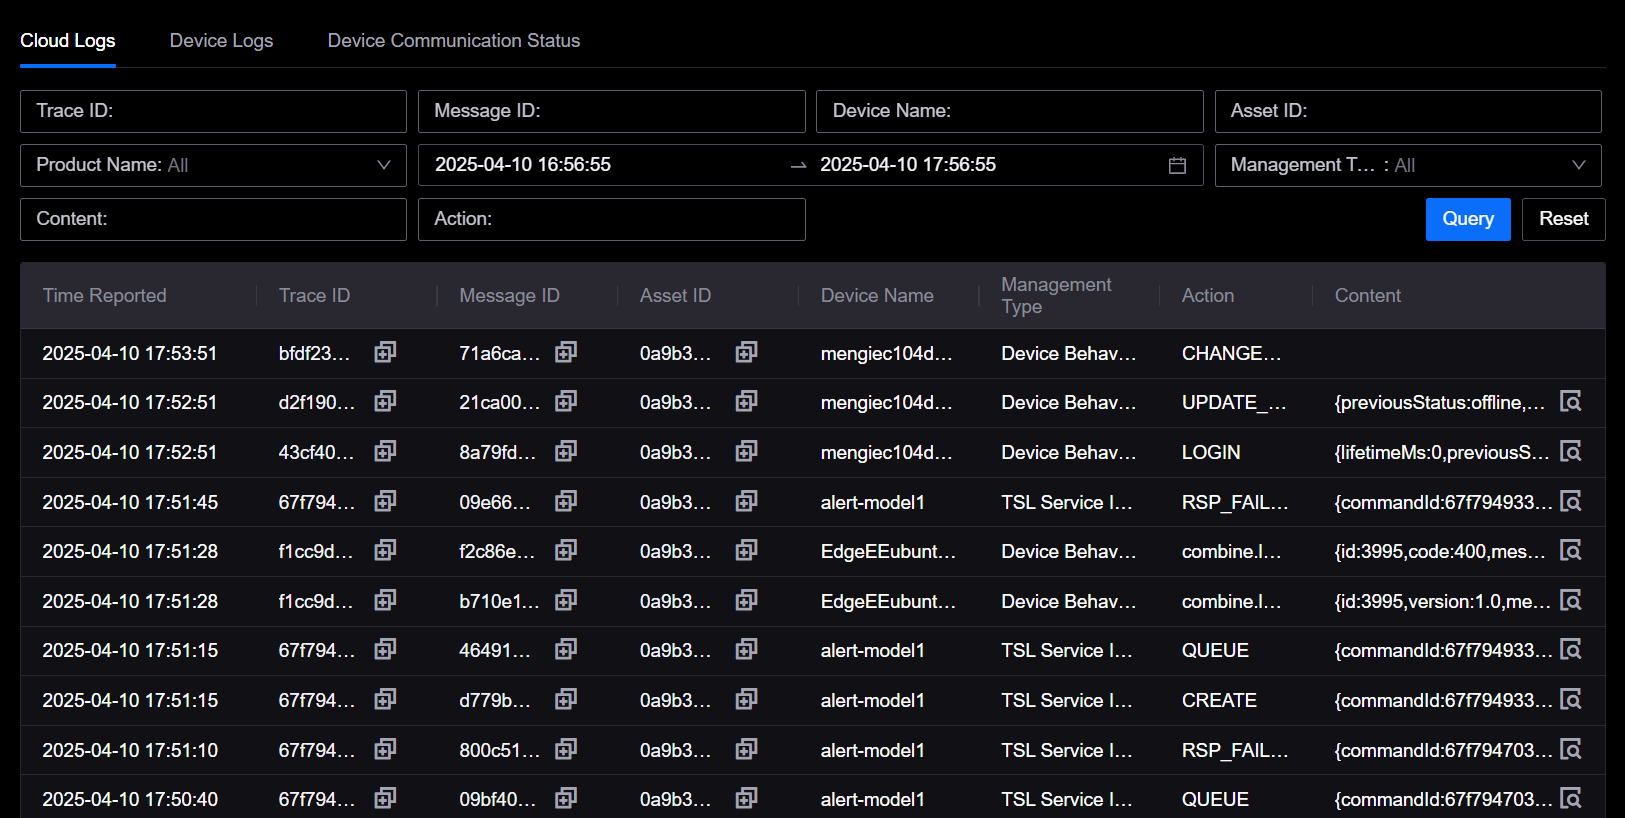
Viewing Cloud Logs
In EnOS Application Portal > Developer Console, select Operation Monitoring > Logs > Cloud Logs.
Enter or select the desired search conditions and click Search.
The search results will be displayed below, including the time of the log, management type, operation type, device name, etc.
Click Reset to clear the selected conditions (restoring default values), and the display area below will be emptied.
Viewing Device Logs
In EnOS Application Portal > Developer Console, select Operation Monitoring > Logs > Device Logs.
Enter or select the desired search conditions and click Search.
The search results will be displayed below, including the time of the log, management type, operation type, device name, etc.
Click Reset to clear the selected conditions (restoring default values), and the display area below will be emptied.
Viewing Device Communication Status
In EnOS Application Portal > Developer Console, go to Operation Monitoring > Logs > Device Communication Status.
To view a device’s communication status, first select the product it belongs to, then select the device, and the time range. Available time range options are 1 hour, 1 day, 7 days, and 30 days.
Click Search and the results will be displayed below.
To view an item’s description in its entirety, click its View icon
 .
.